

Key Insights
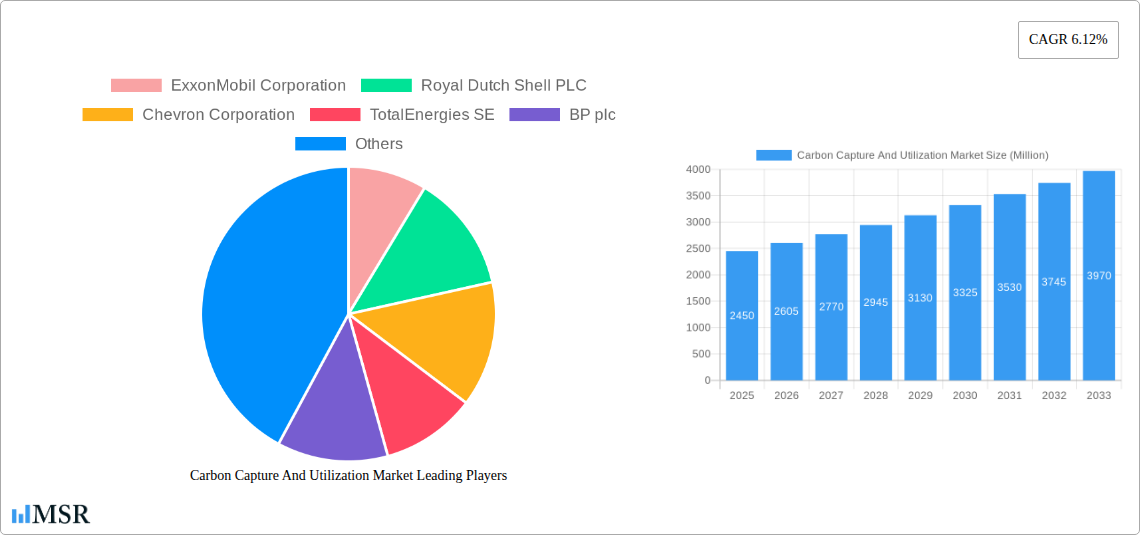
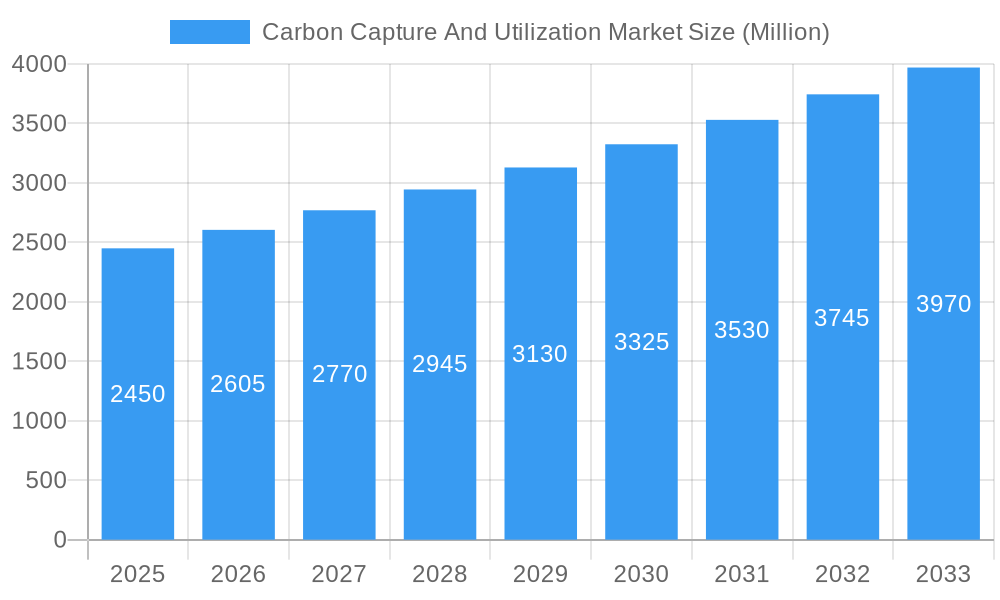
The global Carbon Capture and Utilization (CCU) market is poised for robust expansion, projected to reach approximately $2.45 billion by 2025. This growth is driven by an increasing imperative to mitigate climate change and stringent governmental regulations aimed at reducing industrial carbon emissions. The market is expected to witness a Compound Annual Growth Rate (CAGR) of 6.12% during the forecast period of 2025-2033, indicating a sustained upward trajectory. Key growth drivers include technological advancements in capture efficiency, rising awareness among corporations regarding environmental, social, and governance (ESG) principles, and significant investments in developing CO2 utilization pathways. The demand for CCU solutions is particularly pronounced in sectors with high carbon footprints, such as oil and gas, power generation, and heavy industries like iron and steel, chemical, and petrochemicals. These industries are actively seeking cost-effective and scalable methods to decarbonize their operations, making CCU a critical component of their sustainability strategies.
Carbon Capture And Utilization Market Market Size (In Billion)
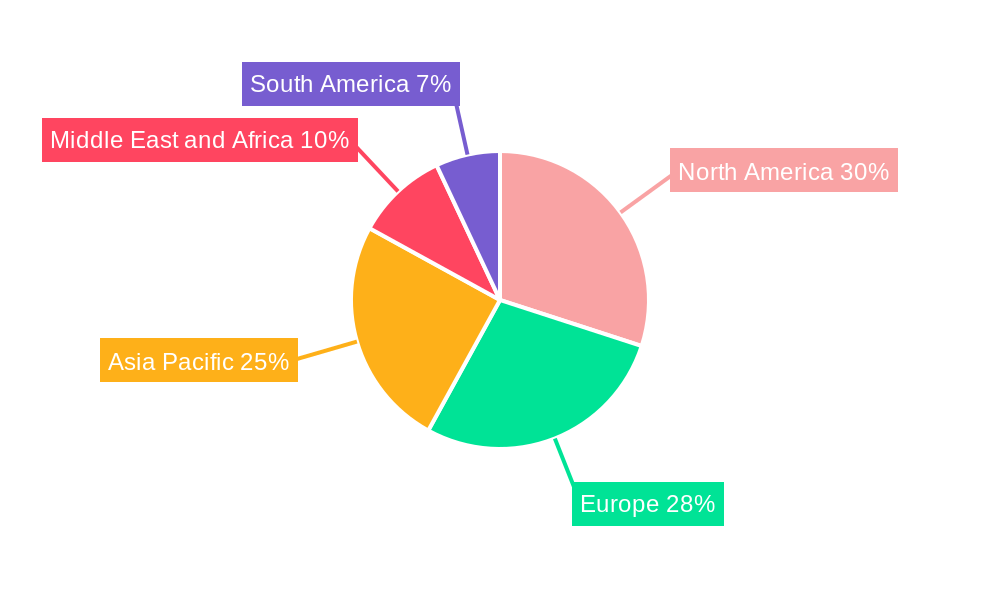
The CCU market is segmented across various services and technologies. In terms of services, capture, transportation, utilization, and storage are all crucial aspects, with utilization presenting significant growth opportunities as new applications for captured CO2 emerge. Technologically, pre-combustion, oxy-fuel combustion, and post-combustion capture methods are being refined and deployed to enhance efficiency and reduce costs. The leading end-users, including Oil and Gas and Power Generation, are at the forefront of adopting these technologies. Geographically, North America and Europe are currently leading the market due to established regulatory frameworks and substantial R&D investments. However, the Asia Pacific region, particularly China and India, is expected to witness rapid growth driven by industrial expansion and increasing environmental consciousness. Emerging economies in the Middle East and Africa also represent nascent but promising markets. Challenges to market growth, such as high initial investment costs and the need for robust CO2 transportation and storage infrastructure, are being addressed through policy support and technological innovation, paving the way for widespread CCU adoption.
Carbon Capture And Utilization Market Company Market Share
Unlocking a Sustainable Future: Comprehensive Report on the Carbon Capture and Utilization Market (2019–2033)
This in-depth report provides an authoritative analysis of the global Carbon Capture and Utilization (CCU) market, offering critical insights and actionable intelligence for industry stakeholders. With a comprehensive study period from 2019 to 2033, including a detailed 2025 base and estimated year, and a robust forecast period from 2025 to 2033, this research quantifies market trajectories and identifies key growth opportunities. Delve into the strategic landscape, technological advancements, and emerging trends shaping this vital sector. Our analysis covers market dynamics, industry insights, segment dominance, product developments, challenges, growth drivers, strategic outlook, leading players, and key industry milestones.
Carbon Capture And Utilization Market Market Concentration & Dynamics
The Carbon Capture and Utilization (CCU) market is characterized by a dynamic blend of consolidation and emerging innovation, with a moderate to high market concentration. Leading players like ExxonMobil Corporation, Royal Dutch Shell PLC, Chevron Corporation, TotalEnergies SE, and BP plc are actively investing in and deploying CCU technologies, leveraging their extensive expertise in oil and gas, power generation, and chemical sectors. These giants possess significant market share, often exceeding xx% combined in key segments. The innovation ecosystem is fueled by a growing number of technology providers and startups, fostering a competitive yet collaborative environment. Regulatory frameworks are increasingly supportive, with governments worldwide implementing carbon pricing mechanisms and incentives to drive CCU adoption, significantly impacting market dynamics. Substitute products, while evolving, are primarily focused on emission reduction strategies that do not involve direct capture. End-user trends show a strong shift towards industrial decarbonization, with the Oil and Gas, Power Generation, and Iron and Steel industries emerging as primary adopters. Mergers and acquisitions (M&A) activities are on the rise, as larger entities seek to acquire innovative technologies and expand their CCU portfolios. Deal counts are projected to increase by xx% in the coming years, indicating a strategic consolidation phase.
- Market Share: Major players collectively hold an estimated xx% of the current market share.
- M&A Deal Counts: Projected to increase by xx% from 2025 to 2030.
- Innovation Ecosystem: Robust with an increasing number of patents filed in post-combustion capture technologies.
- Regulatory Impact: Policy incentives are a critical determinant of market penetration.
Carbon Capture And Utilization Market Industry Insights & Trends
The global Carbon Capture and Utilization (CCU) market is poised for substantial growth, driven by mounting environmental concerns, stringent regulatory mandates, and the increasing demand for sustainable industrial practices. The market size for CCU is projected to reach approximately $XXX Million by 2033, exhibiting a Compound Annual Growth Rate (CAGR) of XX% during the forecast period (2025–2033). This impressive growth is fueled by a confluence of factors, including the urgent need to mitigate climate change, the economic viability of CO2 utilization for valuable products, and technological advancements that are making CCU more efficient and cost-effective. The historical period (2019–2024) saw foundational investments and pilot projects, laying the groundwork for the current expansion phase. Evolving consumer behaviors are also playing a significant role, with an increasing preference for products manufactured using sustainable processes, compelling industries to adopt CCU solutions. Technological disruptions are central to this market's evolution, with significant breakthroughs in solvent-based absorption, membrane separation, and cryogenic capture technologies enhancing efficiency and reducing operational costs. The development of novel utilization pathways, transforming captured CO2 into chemicals, fuels, and building materials, is a key trend that is unlocking new revenue streams and driving market demand. The base year (2025) marks a critical inflection point, with widespread commercial adoption beginning to take hold.
Key Markets & Segments Leading Carbon Capture And Utilization Market
The Carbon Capture and Utilization (CCU) market is experiencing robust growth across various segments, with certain regions and industries spearheading adoption. Geographically, North America and Europe are currently leading the CCU market due to strong governmental support, established industrial infrastructure, and ambitious decarbonization targets. Asia-Pacific is rapidly emerging as a significant growth region, driven by a burgeoning industrial base and increasing awareness of environmental issues.
Within the Service segment, Capture technologies are witnessing the highest investment, as the initial step of any CCU process is paramount. This is closely followed by Transportation, with the development of dedicated pipelines and shipping infrastructure becoming increasingly crucial. Utilization is gaining significant traction as CO2 is repurposed into valuable products, while Storage remains a vital component for residual emissions.
In terms of Technology, Post-combustion Capture currently dominates the market share due to its applicability to existing industrial facilities. However, Pre-combustion Capture and Oxy-fuel Combustion Capture are gaining momentum with advancements in efficiency and cost-effectiveness, particularly in new plant designs.
The End User landscape is led by the Oil and Gas sector, where CCU is being deployed for enhanced oil recovery (EOR) and emissions reduction. The Power Generation industry is a close second, with a focus on decarbonizing fossil fuel-based power plants. The Iron and Steel and Chemical and Petrochemical sectors are also significant adopters, leveraging CCU to meet stringent environmental regulations and produce low-carbon materials. The Cement industry is increasingly exploring CCU for clinker production.
- Dominant Regions: North America and Europe lead, with Asia-Pacific showing rapid growth.
- Service Segment Dominance: Capture and Transportation are leading the market.
- Technology Segment Dominance: Post-combustion Capture currently holds the largest market share.
- End User Segment Dominance: Oil and Gas and Power Generation are the primary drivers of demand.
- Oil and Gas: Driven by EOR and emissions reduction mandates.
- Power Generation: Focused on decarbonizing existing facilities.
- Iron and Steel: Addressing Scope 1 emissions and sustainability goals.
- Chemical and Petrochemical: Producing sustainable chemicals and fuels.
- Cement: Investigating carbon-neutral production methods.
Carbon Capture And Utilization Market Product Developments
Product developments in the Carbon Capture and Utilization (CCU) market are largely centered on enhancing the efficiency and reducing the cost of capture technologies, as well as expanding the range of CO2-derived products. Innovations in novel sorbent materials, advanced membrane technologies, and improved cryogenic separation processes are leading to significant gains in capture efficiency, with some technologies achieving capture rates exceeding xx%. Furthermore, the utilization segment is witnessing the development of more sophisticated catalytic processes that convert captured CO2 into high-value chemicals like methanol, ethylene, and polycarbonates, as well as low-carbon fuels and building materials such as carbon-negative concrete. The market relevance of these developments lies in their ability to directly address the economic viability of CCU, making it a more attractive proposition for industries and fostering a circular carbon economy.
Challenges in the Carbon Capture And Utilization Market Market
Despite the promising growth trajectory, the Carbon Capture and Utilization (CCU) market faces several significant challenges. High capital and operational costs associated with capture technologies remain a primary barrier, often requiring substantial upfront investment. The development of robust and cost-effective CO2 transportation and infrastructure networks is still in its nascent stages in many regions. Furthermore, regulatory uncertainty and a lack of standardized policies can hinder long-term investment decisions. Supply chain constraints for specialized equipment and materials can also impact project timelines and costs. Finally, the market for CO2-derived products is still evolving, and its ability to absorb large volumes of captured CO2 at competitive prices needs further development.
- High Costs: Significant upfront capital and operational expenses.
- Infrastructure Gaps: Underdeveloped transportation and distribution networks.
- Regulatory Uncertainty: Evolving policies and lack of standardization.
- Supply Chain Bottlenecks: Availability of specialized equipment and materials.
- Market Development: Need for robust and scalable markets for CO2-derived products.
Forces Driving Carbon Capture And Utilization Market Growth
Several powerful forces are driving the expansion of the Carbon Capture and Utilization (CCU) market. The escalating global concern over climate change and the urgent need to meet ambitious decarbonization targets set by governments and international bodies are primary catalysts. Stringent environmental regulations, including carbon taxes and emissions trading schemes, are creating economic incentives for industries to invest in CCU solutions. Technological advancements are continuously improving the efficiency and reducing the cost of CCU processes, making them more commercially viable. Furthermore, the increasing demand for sustainable products and the recognition of CO2 as a valuable feedstock for various industrial applications are opening up new market opportunities and driving innovation in utilization pathways.
Challenges in the Carbon Capture And Utilization Market Market
Addressing the long-term growth of the Carbon Capture and Utilization (CCU) market hinges on overcoming persistent challenges and capitalizing on strategic opportunities. Continued innovation in capture technologies, focusing on lower energy intensity and higher capture rates, will be crucial. The development of integrated CCU value chains, from capture to utilization, will be essential for economic viability. Strategic partnerships between technology providers, industrial emitters, and end-users are vital for scaling up deployment and creating market certainty. Expanding the portfolio of CO2-derived products and ensuring their market competitiveness will drive demand. Moreover, policy frameworks that provide long-term certainty and financial support will be critical for sustained investment and growth in the CCU sector.
Emerging Opportunities in Carbon Capture And Utilization Market
The Carbon Capture and Utilization (CCU) market is brimming with emerging opportunities that promise to reshape its future. The growing interest in the circular economy presents a significant opportunity for CCU to play a pivotal role, transforming CO2 from a waste product into a valuable resource. The development of direct air capture (DAC) technologies, while currently in its early stages, offers immense potential for achieving net-negative emissions. New markets for CO2-derived products, such as sustainable aviation fuels, advanced building materials, and bio-based chemicals, are rapidly expanding. Furthermore, government incentives and the increasing corporate commitment to Environmental, Social, and Governance (ESG) goals are creating a favorable investment climate for CCU projects. Exploring novel utilization pathways and fostering international collaboration will be key to unlocking these opportunities.
Leading Players in the Carbon Capture And Utilization Market Sector
- ExxonMobil Corporation
- Royal Dutch Shell PLC
- Chevron Corporation
- TotalEnergies SE
- BP plc
- Equinor ASA
- Mitsubishi Heavy Industries Ltd
- Air Products and Chemicals Inc
- Aker Solutions ASA
- Schlumberger Limited
Key Milestones in Carbon Capture And Utilization Market Industry
- April 2024: TotalEnergies and Vanguard Renewables inked a deal to establish a 50-50 joint venture for Farm Powered RNG initiatives across the United States, showcasing a significant move towards utilizing organic waste and developing renewable energy solutions.
- February 2023: Aker Solutions confirmed signing the contract for the Draugen project with OKEA, a development expected to result in substantial CO2 emission reductions of up to 200,000 tons per year, demonstrating tangible progress in emission mitigation.
Strategic Outlook for Carbon Capture And Utilization Market Market
The strategic outlook for the Carbon Capture and Utilization (CCU) market is exceptionally positive, driven by a confluence of technological advancements, supportive regulatory landscapes, and increasing global demand for decarbonization solutions. The market is expected to witness accelerated growth as CCU technologies mature and become more cost-competitive, making them an integral part of industrial operations. Strategic opportunities lie in the further development of integrated CCU value chains, the expansion of carbon-neutral product portfolios, and the creation of robust marketplaces for captured CO2. Continued investment in research and development, coupled with strong policy support and international collaboration, will be paramount in driving the widespread adoption of CCU and achieving global climate objectives, ensuring a sustainable future for the industry and the planet.
Carbon Capture And Utilization Market Segmentation
-
1. Service
- 1.1. Capture
- 1.2. Transportation
- 1.3. Utilization
- 1.4. Storage
-
2. Technology
- 2.1. Pre-combustion Capture
- 2.2. Oxy-fuel Combustion Capture
- 2.3. Post-combustion Capture
-
3. End User
- 3.1. Oil and Gas
- 3.2. Power Generation
- 3.3. Iron and Steel
- 3.4. Chemical and Petrochemical
- 3.5. Cement
- 3.6. Other End Users
Carbon Capture And Utilization Market Segmentation By Geography
-
1. Asia Pacific
- 1.1. India
- 1.2. China
- 1.3. Japan
- 1.4. Australia
- 1.5. Rest of Asia Pacific
-
2. North America
- 2.1. United States
- 2.2. Canada
- 2.3. Rest of North America
-
3. Europe
- 3.1. Germany
- 3.2. United Kingdom
- 3.3. France
- 3.4. Russia
- 3.5. Rest of Europe
-
4. South America
- 4.1. Brazil
- 4.2. Argentina
- 4.3. Rest of South America
-
5. Middle East and Africa
- 5.1. United Arab Emirates
- 5.2. South Africa
- 5.3. Rest of Middle East and Africa
Carbon Capture And Utilization Market Regional Market Share
Geographic Coverage of Carbon Capture And Utilization Market
Carbon Capture And Utilization Market REPORT HIGHLIGHTS
| Aspects | Details |
|---|---|
| Study Period | 2020-2034 |
| Base Year | 2025 |
| Estimated Year | 2026 |
| Forecast Period | 2026-2034 |
| Historical Period | 2020-2025 |
| Growth Rate | CAGR of 6.12% from 2020-2034 |
| Segmentation |
|
Table of Contents
- 1. Introduction
- 1.1. Research Scope
- 1.2. Market Segmentation
- 1.3. Research Objective
- 1.4. Definitions and Assumptions
- 2. Executive Summary
- 2.1. Market Snapshot
- 3. Market Dynamics
- 3.1. Market Drivers
- 3.2. Market Restrains
- 3.3. Market Trends
- 3.4. Market Opportunities
- 4. Market Factor Analysis
- 4.1. Porters Five Forces
- 4.1.1. Bargaining Power of Suppliers
- 4.1.2. Bargaining Power of Buyers
- 4.1.3. Threat of New Entrants
- 4.1.4. Threat of Substitutes
- 4.1.5. Competitive Rivalry
- 4.2. PESTEL analysis
- 4.3. BCG Analysis
- 4.3.1. Stars (High Growth, High Market Share)
- 4.3.2. Cash Cows (Low Growth, High Market Share)
- 4.3.3. Question Mark (High Growth, Low Market Share)
- 4.3.4. Dogs (Low Growth, Low Market Share)
- 4.4. Ansoff Matrix Analysis
- 4.5. Supply Chain Analysis
- 4.6. Regulatory Landscape
- 4.7. Current Market Potential and Opportunity Assessment (TAM–SAM–SOM Framework)
- 4.8. MSR Analyst Note
- 4.1. Porters Five Forces
- 5. Market Analysis, Insights and Forecast 2021-2033
- 5.1. Market Analysis, Insights and Forecast - by Service
- 5.1.1. Capture
- 5.1.2. Transportation
- 5.1.3. Utilization
- 5.1.4. Storage
- 5.2. Market Analysis, Insights and Forecast - by Technology
- 5.2.1. Pre-combustion Capture
- 5.2.2. Oxy-fuel Combustion Capture
- 5.2.3. Post-combustion Capture
- 5.3. Market Analysis, Insights and Forecast - by End User
- 5.3.1. Oil and Gas
- 5.3.2. Power Generation
- 5.3.3. Iron and Steel
- 5.3.4. Chemical and Petrochemical
- 5.3.5. Cement
- 5.3.6. Other End Users
- 5.4. Market Analysis, Insights and Forecast - by Region
- 5.4.1. Asia Pacific
- 5.4.2. North America
- 5.4.3. Europe
- 5.4.4. South America
- 5.4.5. Middle East and Africa
- 5.1. Market Analysis, Insights and Forecast - by Service
- 6. Global Carbon Capture And Utilization Market Analysis, Insights and Forecast, 2021-2033
- 6.1. Market Analysis, Insights and Forecast - by Service
- 6.1.1. Capture
- 6.1.2. Transportation
- 6.1.3. Utilization
- 6.1.4. Storage
- 6.2. Market Analysis, Insights and Forecast - by Technology
- 6.2.1. Pre-combustion Capture
- 6.2.2. Oxy-fuel Combustion Capture
- 6.2.3. Post-combustion Capture
- 6.3. Market Analysis, Insights and Forecast - by End User
- 6.3.1. Oil and Gas
- 6.3.2. Power Generation
- 6.3.3. Iron and Steel
- 6.3.4. Chemical and Petrochemical
- 6.3.5. Cement
- 6.3.6. Other End Users
- 6.1. Market Analysis, Insights and Forecast - by Service
- 7. Asia Pacific Carbon Capture And Utilization Market Analysis, Insights and Forecast, 2020-2032
- 7.1. Market Analysis, Insights and Forecast - by Service
- 7.1.1. Capture
- 7.1.2. Transportation
- 7.1.3. Utilization
- 7.1.4. Storage
- 7.2. Market Analysis, Insights and Forecast - by Technology
- 7.2.1. Pre-combustion Capture
- 7.2.2. Oxy-fuel Combustion Capture
- 7.2.3. Post-combustion Capture
- 7.3. Market Analysis, Insights and Forecast - by End User
- 7.3.1. Oil and Gas
- 7.3.2. Power Generation
- 7.3.3. Iron and Steel
- 7.3.4. Chemical and Petrochemical
- 7.3.5. Cement
- 7.3.6. Other End Users
- 7.1. Market Analysis, Insights and Forecast - by Service
- 8. North America Carbon Capture And Utilization Market Analysis, Insights and Forecast, 2020-2032
- 8.1. Market Analysis, Insights and Forecast - by Service
- 8.1.1. Capture
- 8.1.2. Transportation
- 8.1.3. Utilization
- 8.1.4. Storage
- 8.2. Market Analysis, Insights and Forecast - by Technology
- 8.2.1. Pre-combustion Capture
- 8.2.2. Oxy-fuel Combustion Capture
- 8.2.3. Post-combustion Capture
- 8.3. Market Analysis, Insights and Forecast - by End User
- 8.3.1. Oil and Gas
- 8.3.2. Power Generation
- 8.3.3. Iron and Steel
- 8.3.4. Chemical and Petrochemical
- 8.3.5. Cement
- 8.3.6. Other End Users
- 8.1. Market Analysis, Insights and Forecast - by Service
- 9. Europe Carbon Capture And Utilization Market Analysis, Insights and Forecast, 2020-2032
- 9.1. Market Analysis, Insights and Forecast - by Service
- 9.1.1. Capture
- 9.1.2. Transportation
- 9.1.3. Utilization
- 9.1.4. Storage
- 9.2. Market Analysis, Insights and Forecast - by Technology
- 9.2.1. Pre-combustion Capture
- 9.2.2. Oxy-fuel Combustion Capture
- 9.2.3. Post-combustion Capture
- 9.3. Market Analysis, Insights and Forecast - by End User
- 9.3.1. Oil and Gas
- 9.3.2. Power Generation
- 9.3.3. Iron and Steel
- 9.3.4. Chemical and Petrochemical
- 9.3.5. Cement
- 9.3.6. Other End Users
- 9.1. Market Analysis, Insights and Forecast - by Service
- 10. South America Carbon Capture And Utilization Market Analysis, Insights and Forecast, 2020-2032
- 10.1. Market Analysis, Insights and Forecast - by Service
- 10.1.1. Capture
- 10.1.2. Transportation
- 10.1.3. Utilization
- 10.1.4. Storage
- 10.2. Market Analysis, Insights and Forecast - by Technology
- 10.2.1. Pre-combustion Capture
- 10.2.2. Oxy-fuel Combustion Capture
- 10.2.3. Post-combustion Capture
- 10.3. Market Analysis, Insights and Forecast - by End User
- 10.3.1. Oil and Gas
- 10.3.2. Power Generation
- 10.3.3. Iron and Steel
- 10.3.4. Chemical and Petrochemical
- 10.3.5. Cement
- 10.3.6. Other End Users
- 10.1. Market Analysis, Insights and Forecast - by Service
- 11. Middle East and Africa Carbon Capture And Utilization Market Analysis, Insights and Forecast, 2020-2032
- 11.1. Market Analysis, Insights and Forecast - by Service
- 11.1.1. Capture
- 11.1.2. Transportation
- 11.1.3. Utilization
- 11.1.4. Storage
- 11.2. Market Analysis, Insights and Forecast - by Technology
- 11.2.1. Pre-combustion Capture
- 11.2.2. Oxy-fuel Combustion Capture
- 11.2.3. Post-combustion Capture
- 11.3. Market Analysis, Insights and Forecast - by End User
- 11.3.1. Oil and Gas
- 11.3.2. Power Generation
- 11.3.3. Iron and Steel
- 11.3.4. Chemical and Petrochemical
- 11.3.5. Cement
- 11.3.6. Other End Users
- 11.1. Market Analysis, Insights and Forecast - by Service
- 12. Competitive Analysis
- 12.1. Company Profiles
- 12.1.1 ExxonMobil Corporation
- 12.1.1.1. Company Overview
- 12.1.1.2. Products
- 12.1.1.3. Company Financials
- 12.1.1.4. SWOT Analysis
- 12.1.2 Royal Dutch Shell PLC
- 12.1.2.1. Company Overview
- 12.1.2.2. Products
- 12.1.2.3. Company Financials
- 12.1.2.4. SWOT Analysis
- 12.1.3 Chevron Corporation
- 12.1.3.1. Company Overview
- 12.1.3.2. Products
- 12.1.3.3. Company Financials
- 12.1.3.4. SWOT Analysis
- 12.1.4 TotalEnergies SE
- 12.1.4.1. Company Overview
- 12.1.4.2. Products
- 12.1.4.3. Company Financials
- 12.1.4.4. SWOT Analysis
- 12.1.5 BP plc
- 12.1.5.1. Company Overview
- 12.1.5.2. Products
- 12.1.5.3. Company Financials
- 12.1.5.4. SWOT Analysis
- 12.1.6 Equinor ASA
- 12.1.6.1. Company Overview
- 12.1.6.2. Products
- 12.1.6.3. Company Financials
- 12.1.6.4. SWOT Analysis
- 12.1.7 Mitsubishi Heavy Industries Ltd
- 12.1.7.1. Company Overview
- 12.1.7.2. Products
- 12.1.7.3. Company Financials
- 12.1.7.4. SWOT Analysis
- 12.1.8 Air Products and Chemicals Inc
- 12.1.8.1. Company Overview
- 12.1.8.2. Products
- 12.1.8.3. Company Financials
- 12.1.8.4. SWOT Analysis
- 12.1.9 Aker Solutions ASA
- 12.1.9.1. Company Overview
- 12.1.9.2. Products
- 12.1.9.3. Company Financials
- 12.1.9.4. SWOT Analysis
- 12.1.10 Schlumberger Limited
- 12.1.10.1. Company Overview
- 12.1.10.2. Products
- 12.1.10.3. Company Financials
- 12.1.10.4. SWOT Analysis
- 12.1.1 ExxonMobil Corporation
- 12.2. Market Entropy
- 12.2.1 Company's Key Areas Served
- 12.2.2 Recent Developments
- 12.3. Company Market Share Analysis 2025
- 12.3.1 Top 5 Companies Market Share Analysis
- 12.3.2 Top 3 Companies Market Share Analysis
- 12.4. List of Potential Customers
- 13. Research Methodology
List of Figures
- Figure 1: Global Carbon Capture And Utilization Market Revenue Breakdown (Million, %) by Region 2025 & 2033
- Figure 2: Global Carbon Capture And Utilization Market Volume Breakdown (Billion, %) by Region 2025 & 2033
- Figure 3: Asia Pacific Carbon Capture And Utilization Market Revenue (Million), by Service 2025 & 2033
- Figure 4: Asia Pacific Carbon Capture And Utilization Market Volume (Billion), by Service 2025 & 2033
- Figure 5: Asia Pacific Carbon Capture And Utilization Market Revenue Share (%), by Service 2025 & 2033
- Figure 6: Asia Pacific Carbon Capture And Utilization Market Volume Share (%), by Service 2025 & 2033
- Figure 7: Asia Pacific Carbon Capture And Utilization Market Revenue (Million), by Technology 2025 & 2033
- Figure 8: Asia Pacific Carbon Capture And Utilization Market Volume (Billion), by Technology 2025 & 2033
- Figure 9: Asia Pacific Carbon Capture And Utilization Market Revenue Share (%), by Technology 2025 & 2033
- Figure 10: Asia Pacific Carbon Capture And Utilization Market Volume Share (%), by Technology 2025 & 2033
- Figure 11: Asia Pacific Carbon Capture And Utilization Market Revenue (Million), by End User 2025 & 2033
- Figure 12: Asia Pacific Carbon Capture And Utilization Market Volume (Billion), by End User 2025 & 2033
- Figure 13: Asia Pacific Carbon Capture And Utilization Market Revenue Share (%), by End User 2025 & 2033
- Figure 14: Asia Pacific Carbon Capture And Utilization Market Volume Share (%), by End User 2025 & 2033
- Figure 15: Asia Pacific Carbon Capture And Utilization Market Revenue (Million), by Country 2025 & 2033
- Figure 16: Asia Pacific Carbon Capture And Utilization Market Volume (Billion), by Country 2025 & 2033
- Figure 17: Asia Pacific Carbon Capture And Utilization Market Revenue Share (%), by Country 2025 & 2033
- Figure 18: Asia Pacific Carbon Capture And Utilization Market Volume Share (%), by Country 2025 & 2033
- Figure 19: North America Carbon Capture And Utilization Market Revenue (Million), by Service 2025 & 2033
- Figure 20: North America Carbon Capture And Utilization Market Volume (Billion), by Service 2025 & 2033
- Figure 21: North America Carbon Capture And Utilization Market Revenue Share (%), by Service 2025 & 2033
- Figure 22: North America Carbon Capture And Utilization Market Volume Share (%), by Service 2025 & 2033
- Figure 23: North America Carbon Capture And Utilization Market Revenue (Million), by Technology 2025 & 2033
- Figure 24: North America Carbon Capture And Utilization Market Volume (Billion), by Technology 2025 & 2033
- Figure 25: North America Carbon Capture And Utilization Market Revenue Share (%), by Technology 2025 & 2033
- Figure 26: North America Carbon Capture And Utilization Market Volume Share (%), by Technology 2025 & 2033
- Figure 27: North America Carbon Capture And Utilization Market Revenue (Million), by End User 2025 & 2033
- Figure 28: North America Carbon Capture And Utilization Market Volume (Billion), by End User 2025 & 2033
- Figure 29: North America Carbon Capture And Utilization Market Revenue Share (%), by End User 2025 & 2033
- Figure 30: North America Carbon Capture And Utilization Market Volume Share (%), by End User 2025 & 2033
- Figure 31: North America Carbon Capture And Utilization Market Revenue (Million), by Country 2025 & 2033
- Figure 32: North America Carbon Capture And Utilization Market Volume (Billion), by Country 2025 & 2033
- Figure 33: North America Carbon Capture And Utilization Market Revenue Share (%), by Country 2025 & 2033
- Figure 34: North America Carbon Capture And Utilization Market Volume Share (%), by Country 2025 & 2033
- Figure 35: Europe Carbon Capture And Utilization Market Revenue (Million), by Service 2025 & 2033
- Figure 36: Europe Carbon Capture And Utilization Market Volume (Billion), by Service 2025 & 2033
- Figure 37: Europe Carbon Capture And Utilization Market Revenue Share (%), by Service 2025 & 2033
- Figure 38: Europe Carbon Capture And Utilization Market Volume Share (%), by Service 2025 & 2033
- Figure 39: Europe Carbon Capture And Utilization Market Revenue (Million), by Technology 2025 & 2033
- Figure 40: Europe Carbon Capture And Utilization Market Volume (Billion), by Technology 2025 & 2033
- Figure 41: Europe Carbon Capture And Utilization Market Revenue Share (%), by Technology 2025 & 2033
- Figure 42: Europe Carbon Capture And Utilization Market Volume Share (%), by Technology 2025 & 2033
- Figure 43: Europe Carbon Capture And Utilization Market Revenue (Million), by End User 2025 & 2033
- Figure 44: Europe Carbon Capture And Utilization Market Volume (Billion), by End User 2025 & 2033
- Figure 45: Europe Carbon Capture And Utilization Market Revenue Share (%), by End User 2025 & 2033
- Figure 46: Europe Carbon Capture And Utilization Market Volume Share (%), by End User 2025 & 2033
- Figure 47: Europe Carbon Capture And Utilization Market Revenue (Million), by Country 2025 & 2033
- Figure 48: Europe Carbon Capture And Utilization Market Volume (Billion), by Country 2025 & 2033
- Figure 49: Europe Carbon Capture And Utilization Market Revenue Share (%), by Country 2025 & 2033
- Figure 50: Europe Carbon Capture And Utilization Market Volume Share (%), by Country 2025 & 2033
- Figure 51: South America Carbon Capture And Utilization Market Revenue (Million), by Service 2025 & 2033
- Figure 52: South America Carbon Capture And Utilization Market Volume (Billion), by Service 2025 & 2033
- Figure 53: South America Carbon Capture And Utilization Market Revenue Share (%), by Service 2025 & 2033
- Figure 54: South America Carbon Capture And Utilization Market Volume Share (%), by Service 2025 & 2033
- Figure 55: South America Carbon Capture And Utilization Market Revenue (Million), by Technology 2025 & 2033
- Figure 56: South America Carbon Capture And Utilization Market Volume (Billion), by Technology 2025 & 2033
- Figure 57: South America Carbon Capture And Utilization Market Revenue Share (%), by Technology 2025 & 2033
- Figure 58: South America Carbon Capture And Utilization Market Volume Share (%), by Technology 2025 & 2033
- Figure 59: South America Carbon Capture And Utilization Market Revenue (Million), by End User 2025 & 2033
- Figure 60: South America Carbon Capture And Utilization Market Volume (Billion), by End User 2025 & 2033
- Figure 61: South America Carbon Capture And Utilization Market Revenue Share (%), by End User 2025 & 2033
- Figure 62: South America Carbon Capture And Utilization Market Volume Share (%), by End User 2025 & 2033
- Figure 63: South America Carbon Capture And Utilization Market Revenue (Million), by Country 2025 & 2033
- Figure 64: South America Carbon Capture And Utilization Market Volume (Billion), by Country 2025 & 2033
- Figure 65: South America Carbon Capture And Utilization Market Revenue Share (%), by Country 2025 & 2033
- Figure 66: South America Carbon Capture And Utilization Market Volume Share (%), by Country 2025 & 2033
- Figure 67: Middle East and Africa Carbon Capture And Utilization Market Revenue (Million), by Service 2025 & 2033
- Figure 68: Middle East and Africa Carbon Capture And Utilization Market Volume (Billion), by Service 2025 & 2033
- Figure 69: Middle East and Africa Carbon Capture And Utilization Market Revenue Share (%), by Service 2025 & 2033
- Figure 70: Middle East and Africa Carbon Capture And Utilization Market Volume Share (%), by Service 2025 & 2033
- Figure 71: Middle East and Africa Carbon Capture And Utilization Market Revenue (Million), by Technology 2025 & 2033
- Figure 72: Middle East and Africa Carbon Capture And Utilization Market Volume (Billion), by Technology 2025 & 2033
- Figure 73: Middle East and Africa Carbon Capture And Utilization Market Revenue Share (%), by Technology 2025 & 2033
- Figure 74: Middle East and Africa Carbon Capture And Utilization Market Volume Share (%), by Technology 2025 & 2033
- Figure 75: Middle East and Africa Carbon Capture And Utilization Market Revenue (Million), by End User 2025 & 2033
- Figure 76: Middle East and Africa Carbon Capture And Utilization Market Volume (Billion), by End User 2025 & 2033
- Figure 77: Middle East and Africa Carbon Capture And Utilization Market Revenue Share (%), by End User 2025 & 2033
- Figure 78: Middle East and Africa Carbon Capture And Utilization Market Volume Share (%), by End User 2025 & 2033
- Figure 79: Middle East and Africa Carbon Capture And Utilization Market Revenue (Million), by Country 2025 & 2033
- Figure 80: Middle East and Africa Carbon Capture And Utilization Market Volume (Billion), by Country 2025 & 2033
- Figure 81: Middle East and Africa Carbon Capture And Utilization Market Revenue Share (%), by Country 2025 & 2033
- Figure 82: Middle East and Africa Carbon Capture And Utilization Market Volume Share (%), by Country 2025 & 2033
List of Tables
- Table 1: Global Carbon Capture And Utilization Market Revenue Million Forecast, by Service 2020 & 2033
- Table 2: Global Carbon Capture And Utilization Market Volume Billion Forecast, by Service 2020 & 2033
- Table 3: Global Carbon Capture And Utilization Market Revenue Million Forecast, by Technology 2020 & 2033
- Table 4: Global Carbon Capture And Utilization Market Volume Billion Forecast, by Technology 2020 & 2033
- Table 5: Global Carbon Capture And Utilization Market Revenue Million Forecast, by End User 2020 & 2033
- Table 6: Global Carbon Capture And Utilization Market Volume Billion Forecast, by End User 2020 & 2033
- Table 7: Global Carbon Capture And Utilization Market Revenue Million Forecast, by Region 2020 & 2033
- Table 8: Global Carbon Capture And Utilization Market Volume Billion Forecast, by Region 2020 & 2033
- Table 9: Global Carbon Capture And Utilization Market Revenue Million Forecast, by Service 2020 & 2033
- Table 10: Global Carbon Capture And Utilization Market Volume Billion Forecast, by Service 2020 & 2033
- Table 11: Global Carbon Capture And Utilization Market Revenue Million Forecast, by Technology 2020 & 2033
- Table 12: Global Carbon Capture And Utilization Market Volume Billion Forecast, by Technology 2020 & 2033
- Table 13: Global Carbon Capture And Utilization Market Revenue Million Forecast, by End User 2020 & 2033
- Table 14: Global Carbon Capture And Utilization Market Volume Billion Forecast, by End User 2020 & 2033
- Table 15: Global Carbon Capture And Utilization Market Revenue Million Forecast, by Country 2020 & 2033
- Table 16: Global Carbon Capture And Utilization Market Volume Billion Forecast, by Country 2020 & 2033
- Table 17: India Carbon Capture And Utilization Market Revenue (Million) Forecast, by Application 2020 & 2033
- Table 18: India Carbon Capture And Utilization Market Volume (Billion) Forecast, by Application 2020 & 2033
- Table 19: China Carbon Capture And Utilization Market Revenue (Million) Forecast, by Application 2020 & 2033
- Table 20: China Carbon Capture And Utilization Market Volume (Billion) Forecast, by Application 2020 & 2033
- Table 21: Japan Carbon Capture And Utilization Market Revenue (Million) Forecast, by Application 2020 & 2033
- Table 22: Japan Carbon Capture And Utilization Market Volume (Billion) Forecast, by Application 2020 & 2033
- Table 23: Australia Carbon Capture And Utilization Market Revenue (Million) Forecast, by Application 2020 & 2033
- Table 24: Australia Carbon Capture And Utilization Market Volume (Billion) Forecast, by Application 2020 & 2033
- Table 25: Rest of Asia Pacific Carbon Capture And Utilization Market Revenue (Million) Forecast, by Application 2020 & 2033
- Table 26: Rest of Asia Pacific Carbon Capture And Utilization Market Volume (Billion) Forecast, by Application 2020 & 2033
- Table 27: Global Carbon Capture And Utilization Market Revenue Million Forecast, by Service 2020 & 2033
- Table 28: Global Carbon Capture And Utilization Market Volume Billion Forecast, by Service 2020 & 2033
- Table 29: Global Carbon Capture And Utilization Market Revenue Million Forecast, by Technology 2020 & 2033
- Table 30: Global Carbon Capture And Utilization Market Volume Billion Forecast, by Technology 2020 & 2033
- Table 31: Global Carbon Capture And Utilization Market Revenue Million Forecast, by End User 2020 & 2033
- Table 32: Global Carbon Capture And Utilization Market Volume Billion Forecast, by End User 2020 & 2033
- Table 33: Global Carbon Capture And Utilization Market Revenue Million Forecast, by Country 2020 & 2033
- Table 34: Global Carbon Capture And Utilization Market Volume Billion Forecast, by Country 2020 & 2033
- Table 35: United States Carbon Capture And Utilization Market Revenue (Million) Forecast, by Application 2020 & 2033
- Table 36: United States Carbon Capture And Utilization Market Volume (Billion) Forecast, by Application 2020 & 2033
- Table 37: Canada Carbon Capture And Utilization Market Revenue (Million) Forecast, by Application 2020 & 2033
- Table 38: Canada Carbon Capture And Utilization Market Volume (Billion) Forecast, by Application 2020 & 2033
- Table 39: Rest of North America Carbon Capture And Utilization Market Revenue (Million) Forecast, by Application 2020 & 2033
- Table 40: Rest of North America Carbon Capture And Utilization Market Volume (Billion) Forecast, by Application 2020 & 2033
- Table 41: Global Carbon Capture And Utilization Market Revenue Million Forecast, by Service 2020 & 2033
- Table 42: Global Carbon Capture And Utilization Market Volume Billion Forecast, by Service 2020 & 2033
- Table 43: Global Carbon Capture And Utilization Market Revenue Million Forecast, by Technology 2020 & 2033
- Table 44: Global Carbon Capture And Utilization Market Volume Billion Forecast, by Technology 2020 & 2033
- Table 45: Global Carbon Capture And Utilization Market Revenue Million Forecast, by End User 2020 & 2033
- Table 46: Global Carbon Capture And Utilization Market Volume Billion Forecast, by End User 2020 & 2033
- Table 47: Global Carbon Capture And Utilization Market Revenue Million Forecast, by Country 2020 & 2033
- Table 48: Global Carbon Capture And Utilization Market Volume Billion Forecast, by Country 2020 & 2033
- Table 49: Germany Carbon Capture And Utilization Market Revenue (Million) Forecast, by Application 2020 & 2033
- Table 50: Germany Carbon Capture And Utilization Market Volume (Billion) Forecast, by Application 2020 & 2033
- Table 51: United Kingdom Carbon Capture And Utilization Market Revenue (Million) Forecast, by Application 2020 & 2033
- Table 52: United Kingdom Carbon Capture And Utilization Market Volume (Billion) Forecast, by Application 2020 & 2033
- Table 53: France Carbon Capture And Utilization Market Revenue (Million) Forecast, by Application 2020 & 2033
- Table 54: France Carbon Capture And Utilization Market Volume (Billion) Forecast, by Application 2020 & 2033
- Table 55: Russia Carbon Capture And Utilization Market Revenue (Million) Forecast, by Application 2020 & 2033
- Table 56: Russia Carbon Capture And Utilization Market Volume (Billion) Forecast, by Application 2020 & 2033
- Table 57: Rest of Europe Carbon Capture And Utilization Market Revenue (Million) Forecast, by Application 2020 & 2033
- Table 58: Rest of Europe Carbon Capture And Utilization Market Volume (Billion) Forecast, by Application 2020 & 2033
- Table 59: Global Carbon Capture And Utilization Market Revenue Million Forecast, by Service 2020 & 2033
- Table 60: Global Carbon Capture And Utilization Market Volume Billion Forecast, by Service 2020 & 2033
- Table 61: Global Carbon Capture And Utilization Market Revenue Million Forecast, by Technology 2020 & 2033
- Table 62: Global Carbon Capture And Utilization Market Volume Billion Forecast, by Technology 2020 & 2033
- Table 63: Global Carbon Capture And Utilization Market Revenue Million Forecast, by End User 2020 & 2033
- Table 64: Global Carbon Capture And Utilization Market Volume Billion Forecast, by End User 2020 & 2033
- Table 65: Global Carbon Capture And Utilization Market Revenue Million Forecast, by Country 2020 & 2033
- Table 66: Global Carbon Capture And Utilization Market Volume Billion Forecast, by Country 2020 & 2033
- Table 67: Brazil Carbon Capture And Utilization Market Revenue (Million) Forecast, by Application 2020 & 2033
- Table 68: Brazil Carbon Capture And Utilization Market Volume (Billion) Forecast, by Application 2020 & 2033
- Table 69: Argentina Carbon Capture And Utilization Market Revenue (Million) Forecast, by Application 2020 & 2033
- Table 70: Argentina Carbon Capture And Utilization Market Volume (Billion) Forecast, by Application 2020 & 2033
- Table 71: Rest of South America Carbon Capture And Utilization Market Revenue (Million) Forecast, by Application 2020 & 2033
- Table 72: Rest of South America Carbon Capture And Utilization Market Volume (Billion) Forecast, by Application 2020 & 2033
- Table 73: Global Carbon Capture And Utilization Market Revenue Million Forecast, by Service 2020 & 2033
- Table 74: Global Carbon Capture And Utilization Market Volume Billion Forecast, by Service 2020 & 2033
- Table 75: Global Carbon Capture And Utilization Market Revenue Million Forecast, by Technology 2020 & 2033
- Table 76: Global Carbon Capture And Utilization Market Volume Billion Forecast, by Technology 2020 & 2033
- Table 77: Global Carbon Capture And Utilization Market Revenue Million Forecast, by End User 2020 & 2033
- Table 78: Global Carbon Capture And Utilization Market Volume Billion Forecast, by End User 2020 & 2033
- Table 79: Global Carbon Capture And Utilization Market Revenue Million Forecast, by Country 2020 & 2033
- Table 80: Global Carbon Capture And Utilization Market Volume Billion Forecast, by Country 2020 & 2033
- Table 81: United Arab Emirates Carbon Capture And Utilization Market Revenue (Million) Forecast, by Application 2020 & 2033
- Table 82: United Arab Emirates Carbon Capture And Utilization Market Volume (Billion) Forecast, by Application 2020 & 2033
- Table 83: South Africa Carbon Capture And Utilization Market Revenue (Million) Forecast, by Application 2020 & 2033
- Table 84: South Africa Carbon Capture And Utilization Market Volume (Billion) Forecast, by Application 2020 & 2033
- Table 85: Rest of Middle East and Africa Carbon Capture And Utilization Market Revenue (Million) Forecast, by Application 2020 & 2033
- Table 86: Rest of Middle East and Africa Carbon Capture And Utilization Market Volume (Billion) Forecast, by Application 2020 & 2033
Frequently Asked Questions
1. What is the projected Compound Annual Growth Rate (CAGR) of the Carbon Capture And Utilization Market?
The projected CAGR is approximately 6.12%.
2. Which companies are prominent players in the Carbon Capture And Utilization Market?
Key companies in the market include ExxonMobil Corporation, Royal Dutch Shell PLC, Chevron Corporation, TotalEnergies SE, BP plc, Equinor ASA, Mitsubishi Heavy Industries Ltd, Air Products and Chemicals Inc, Aker Solutions ASA, Schlumberger Limited.
3. What are the main segments of the Carbon Capture And Utilization Market?
The market segments include Service, Technology, End User.
4. Can you provide details about the market size?
The market size is estimated to be USD 2.45 Million as of 2022.
5. What are some drivers contributing to market growth?
Environmental Regulations and Climate Change Goal; Growing Focuse on Reducing Co2 Emission.
6. What are the notable trends driving market growth?
Oil & Gas Industry was the Major End User in Market.
7. Are there any restraints impacting market growth?
Environmental Regulations and Climate Change Goal; Growing Focuse on Reducing Co2 Emission.
8. Can you provide examples of recent developments in the market?
April 2024: TotalEnergies, a prominent global energy firm, and Vanguard Renewables, a leading US player in converting organic farm waste into renewable natural gas (RNG), inked a deal. The agreement establishes a 50-50 joint venture, intending to develop, construct, and manage Farm Powered RNG initiatives across the United States. Vanguard Renewables, incidentally, is a portfolio company under BlackRock's Diversified Infrastructure business.February 2023: Aker Solutions confirmed signing the contract for the Draugen project with OKEA. The project is expected to reduce emissions by up to 200,000 tons of CO2 per year.
9. What pricing options are available for accessing the report?
Pricing options include single-user, multi-user, and enterprise licenses priced at USD 4750, USD 5250, and USD 8750 respectively.
10. Is the market size provided in terms of value or volume?
The market size is provided in terms of value, measured in Million and volume, measured in Billion.
11. Are there any specific market keywords associated with the report?
Yes, the market keyword associated with the report is "Carbon Capture And Utilization Market," which aids in identifying and referencing the specific market segment covered.
12. How do I determine which pricing option suits my needs best?
The pricing options vary based on user requirements and access needs. Individual users may opt for single-user licenses, while businesses requiring broader access may choose multi-user or enterprise licenses for cost-effective access to the report.
13. Are there any additional resources or data provided in the Carbon Capture And Utilization Market report?
While the report offers comprehensive insights, it's advisable to review the specific contents or supplementary materials provided to ascertain if additional resources or data are available.
14. How can I stay updated on further developments or reports in the Carbon Capture And Utilization Market?
To stay informed about further developments, trends, and reports in the Carbon Capture And Utilization Market, consider subscribing to industry newsletters, following relevant companies and organizations, or regularly checking reputable industry news sources and publications.
Methodology
Step 1 - Identification of Relevant Samples Size from Population Database


Step 2 - Approaches for Defining Global Market Size (Value, Volume* & Price*)

Note*: In applicable scenarios
Step 3 - Data Sources
Primary Research
- Web Analytics
- Survey Reports
- Research Institute
- Latest Research Reports
- Opinion Leaders
Secondary Research
- Annual Reports
- White Paper
- Latest Press Release
- Industry Association
- Paid Database
- Investor Presentations

Step 4 - Data Triangulation
Involves using different sources of information in order to increase the validity of a study
These sources are likely to be stakeholders in a program - participants, other researchers, program staff, other community members, and so on.
Then we put all data in single framework & apply various statistical tools to find out the dynamic on the market.
During the analysis stage, feedback from the stakeholder groups would be compared to determine areas of agreement as well as areas of divergence