

Key Insights
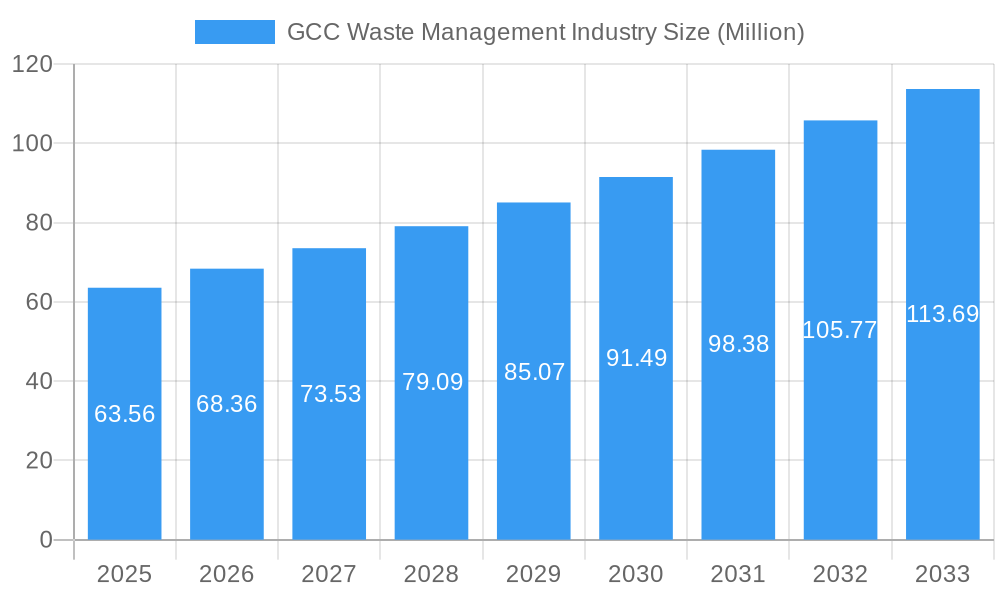
The GCC waste management market, valued at $63.56 million in 2025, is poised for robust growth, exhibiting a Compound Annual Growth Rate (CAGR) of 7.38% from 2025 to 2033. This expansion is fueled by several key drivers. Increasing urbanization across the GCC nations leads to a surge in waste generation, necessitating efficient waste management solutions. Stringent government regulations promoting sustainable waste disposal practices, coupled with growing environmental awareness among citizens, further propel market growth. The rising adoption of advanced waste-to-energy technologies and innovative recycling methods contributes to market expansion. Furthermore, lucrative public-private partnerships and increasing investments in infrastructure development play a significant role. Key players like Averda, Suez Middle East Recycling LLC, and Bee'ah are actively shaping the market landscape through strategic acquisitions, technological advancements, and expansion into new service areas.
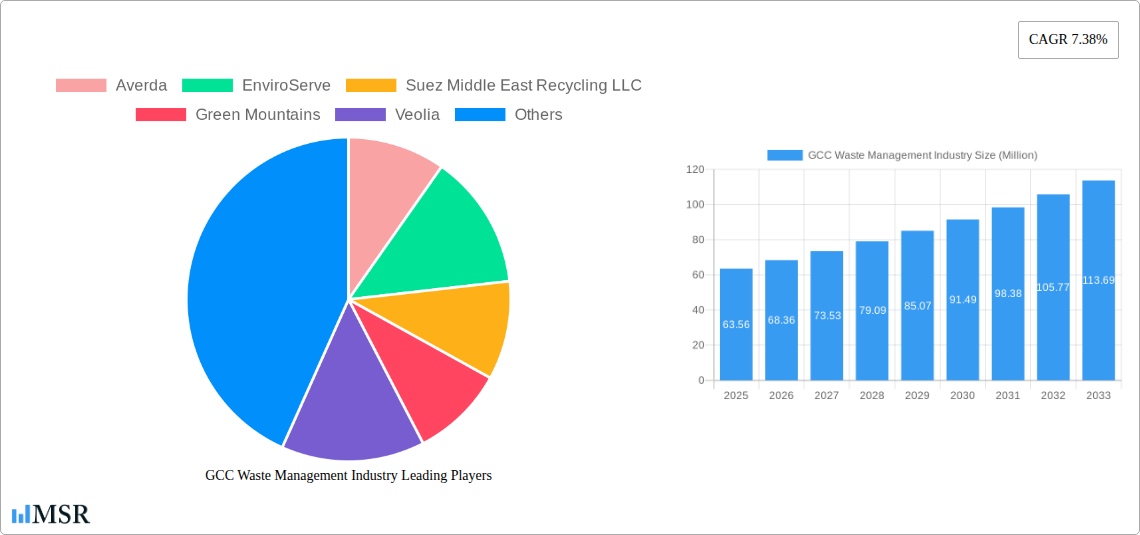
GCC Waste Management Industry Market Size (In Million)
However, the market faces certain challenges. Fluctuations in oil prices can impact investment in infrastructure projects. The lack of awareness regarding waste segregation and recycling in some areas hampers the efficient implementation of sustainable waste management strategies. Land scarcity in densely populated urban areas also poses a constraint on landfill expansion. Despite these restraints, the long-term outlook remains positive, driven by sustained economic growth, population increase, and a growing commitment to environmental sustainability within the GCC region. The market is expected to see significant diversification with increased involvement of smaller, specialized companies focusing on niche areas such as e-waste management and medical waste disposal. The projected market value for 2033 can be estimated by applying the CAGR to the 2025 value, though precise figures necessitate further detailed market research.
GCC Waste Management Industry Company Market Share
GCC Waste Management Industry: Market Analysis & Forecast 2019-2033
This comprehensive report provides a detailed analysis of the GCC waste management industry, offering invaluable insights for stakeholders, investors, and industry professionals. With a study period spanning 2019-2033, a base year of 2025, and a forecast period of 2025-2033, this report meticulously examines market dynamics, growth drivers, key players, and emerging opportunities within the $XX Billion GCC waste management sector.
GCC Waste Management Industry Market Concentration & Dynamics
The GCC waste management market exhibits a moderately concentrated landscape, with several large players holding significant market share. However, the presence of numerous smaller, specialized firms contributes to a dynamic competitive environment. The market share of the top five players is estimated at approximately XX%, reflecting both consolidation and fragmentation.
Market Concentration Metrics:
- Top 5 players market share: XX% (2025 Estimate)
- Number of M&A deals (2019-2024): XX
- Average deal size (USD Million): XX
Market Dynamics:
- Innovation Ecosystem: The industry witnesses steady innovation in waste collection technologies, recycling processes, and waste-to-energy solutions. This innovation is driven by both established players and emerging technology firms.
- Regulatory Frameworks: Stringent government regulations focused on sustainability and environmental protection are shaping market growth and investment strategies. These regulations vary across GCC countries.
- Substitute Products: Limited substitute products directly compete with waste management services. However, advancements in waste reduction and recycling technologies create indirect competition.
- End-User Trends: Growing environmental awareness among consumers and businesses is driving demand for sustainable waste management practices.
- M&A Activities: Consolidation through mergers and acquisitions is anticipated to continue, driven by the pursuit of economies of scale and enhanced service offerings.
GCC Waste Management Industry Industry Insights & Trends
The GCC waste management market is experiencing robust growth, driven by factors like rising urbanization, increasing waste generation, and government initiatives promoting sustainable waste management practices. The market size was estimated at $XX Billion in 2025 and is projected to reach $XX Billion by 2033, exhibiting a CAGR of XX%.
Several factors contribute to this growth:
- Government Regulations and Investments: Significant investments in infrastructure projects like sewage treatment plants and waste management facilities are boosting market growth.
- Technological Disruptions: Adoption of advanced technologies such as AI-powered waste sorting systems, smart bins, and waste-to-energy plants is revolutionizing the industry, improving efficiency and sustainability.
- Evolving Consumer Behaviors: Growing environmental awareness among consumers is leading to increased demand for recycling and sustainable waste disposal options.
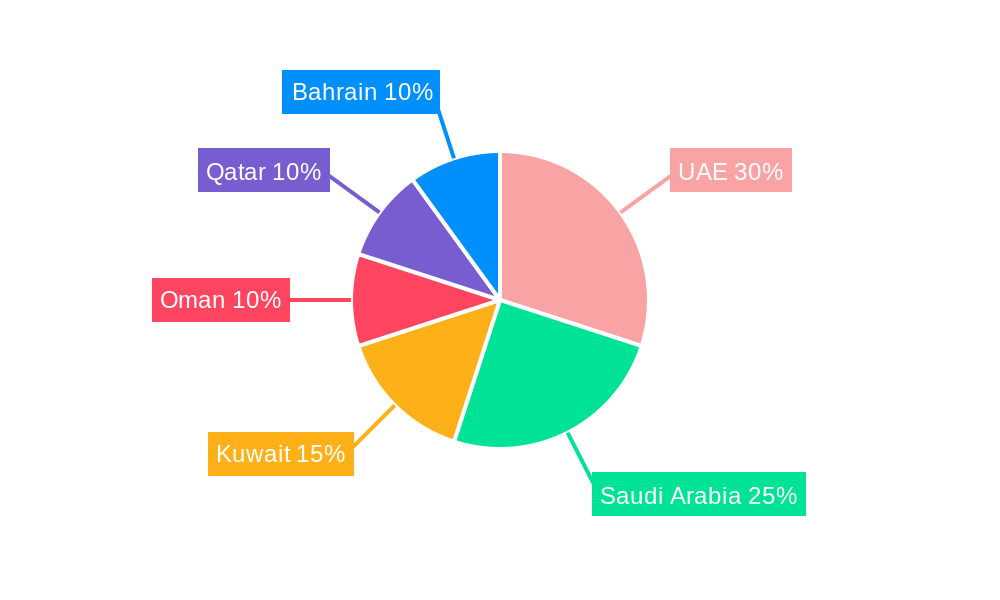
Key Markets & Segments Leading GCC Waste Management Industry
The UAE and Saudi Arabia represent the largest markets within the GCC region. The municipal waste segment holds the largest share due to high population density and urbanization.
Drivers of Market Dominance:
- Economic Growth: Strong economic growth in the UAE and Saudi Arabia fuels infrastructure development and investment in waste management solutions.
- Urbanization: Rapid urbanization in major cities increases waste generation, driving demand for efficient waste management services.
- Tourism: The thriving tourism sector in several GCC countries contributes to the generation of significant waste volumes.
- Government Initiatives: Government support and investments in sustainable waste management initiatives fuel market expansion.
Dominance Analysis:
The UAE and Saudi Arabia dominate due to their larger populations, higher per capita income, and robust government initiatives promoting sustainable practices. Their advanced infrastructure and higher investment capabilities further strengthen their leading positions.
GCC Waste Management Industry Product Developments
Recent innovations are revolutionizing the GCC waste management landscape. These include the deployment of highly sophisticated automated waste sorting technologies powered by AI and robotics, enabling greater precision and recovery of valuable recyclables. Smart waste management systems, leveraging IoT sensors and data analytics, are optimizing collection routes, predicting bin fill levels, and enhancing operational efficiency. Furthermore, the development and expansion of advanced waste-to-energy (WtE) plants are transforming waste from a disposal problem into a valuable energy source. These advancements collectively not only boost operational efficiency and significantly reduce reliance on landfills but also spearhead the critical movement towards comprehensive resource recovery, granting businesses a distinct competitive advantage and aligning with sustainability goals.
Challenges in the GCC Waste Management Industry Market
Sustaining and accelerating long-term growth in the GCC waste management sector is contingent upon several key strategic initiatives. Paramount among these is the successful and widespread implementation of ambitious waste-to-energy projects, which are crucial for diverting waste from landfills and generating clean energy. Fostering robust and collaborative strategic partnerships between public sector entities and private enterprises is essential for leveraging expertise, capital, and operational capabilities. Furthermore, the strategic expansion into newer, often less developed waste management markets within the GCC region holds significant untapped potential. Embracing and investing in innovative recycling technologies and championing the principles of the circular economy will be pivotal in transforming waste management from a linear process to a regenerative system.
Forces Driving GCC Waste Management Industry Growth
The GCC waste management industry is experiencing robust expansion fueled by several interconnected forces. A primary driver is the escalating government commitment and substantial investments in developing state-of-the-art waste management infrastructure. Coupled with this is a pronounced surge in public environmental awareness and a growing demand for sustainable solutions. The proactive adoption of advanced technologies, as previously mentioned, is enhancing efficiency and effectiveness. Moreover, the implementation of increasingly stringent waste management regulations and policies by governments across the region is creating a compelling market imperative for improved practices. These combined factors are collectively propelling market growth and are attracting significant interest and investment from both domestic and international stakeholders.
Challenges in the GCC Waste Management Industry Market
Sustaining and accelerating long-term growth in the GCC waste management sector is contingent upon several key strategic initiatives. Paramount among these is the successful and widespread implementation of ambitious waste-to-energy projects, which are crucial for diverting waste from landfills and generating clean energy. Fostering robust and collaborative strategic partnerships between public sector entities and private enterprises is essential for leveraging expertise, capital, and operational capabilities. Furthermore, the strategic expansion into newer, often less developed waste management markets within the GCC region holds significant untapped potential. Embracing and investing in innovative recycling technologies and championing the principles of the circular economy will be pivotal in transforming waste management from a linear process to a regenerative system.
Emerging Opportunities in GCC Waste Management Industry
Emerging opportunities include increased focus on recycling and waste-to-energy solutions, expansion into specialized waste streams (medical, hazardous), and the growing adoption of digital technologies for waste management optimization. These opportunities offer significant potential for market expansion and innovation.
Leading Players in the GCC Waste Management Industry Sector
- Averda
- EnviroServe
- Suez Middle East Recycling LLC
- Green Mountains
- Veolia
- Blue LLC
- Envac
- SEPCO Environment
- Wasco
- Saudi Investment Recycling Company
- Dulsco Waste Management Services
- Bee'ah
- Power Waste Management and Transport LLC
- Al Haya Enviro
- Bin-Ovation
- United Waste Management Company
- Kuwait Waste Collection and Recycling Company (List Not Exhaustive)
Key Milestones in GCC Waste Management Industry Industry
- December 2023: Wardwizard Innovations and Mobility partnered with BEEAH Group to promote electric vehicles in the GCC and Africa, signifying a shift towards sustainable transportation within the waste management sector.
- October 2022: Marafiq started construction of a new sewage treatment plant at Jeddah Airport II, expanding wastewater treatment capacity and contributing to improved sanitation.
- September 2022: Ashghal awarded a USD 1.48 Billion contract for a new sewage treatment facility in Qatar, highlighting significant public-private investment in the sector.
Strategic Outlook for GCC Waste Management Industry Market
The GCC waste management market is poised for considerable and sustained long-term growth, underpinned by several powerful trends. These include ongoing rapid urbanization, leading to increased waste generation, and a palpable rise in environmental consciousness among both consumers and businesses. Crucially, the unwavering support and proactive initiatives from governments across the region are creating a conducive environment for development. To fully capitalize on this immense potential and cultivate truly sustainable waste management practices, strategic imperatives will include significant investments in next-generation technologies, targeted expansion into emerging market segments and underserved areas, and the active cultivation of strong, synergistic public-private partnerships. By focusing on these areas, the GCC can solidify its position as a leader in advanced and environmentally responsible waste management.
GCC Waste Management Industry Segmentation
-
1. Waste Type
- 1.1. Industrial Waste
- 1.2. Municipal Solid Waste
- 1.3. Hazardous Waste
- 1.4. E-Waste
- 1.5. Plastic Waste
- 1.6. Bio-Medical Waste
-
2. Disposal Method
- 2.1. Collection
- 2.2. Landfills
- 2.3. Incineration
- 2.4. Recycling
GCC Waste Management Industry Segmentation By Geography
-
1. North America
- 1.1. United States
- 1.2. Canada
- 1.3. Mexico
-
2. South America
- 2.1. Brazil
- 2.2. Argentina
- 2.3. Rest of South America
-
3. Europe
- 3.1. United Kingdom
- 3.2. Germany
- 3.3. France
- 3.4. Italy
- 3.5. Spain
- 3.6. Russia
- 3.7. Benelux
- 3.8. Nordics
- 3.9. Rest of Europe
-
4. Middle East & Africa
- 4.1. Turkey
- 4.2. Israel
- 4.3. GCC
- 4.4. North Africa
- 4.5. South Africa
- 4.6. Rest of Middle East & Africa
-
5. Asia Pacific
- 5.1. China
- 5.2. India
- 5.3. Japan
- 5.4. South Korea
- 5.5. ASEAN
- 5.6. Oceania
- 5.7. Rest of Asia Pacific
GCC Waste Management Industry Regional Market Share
Geographic Coverage of GCC Waste Management Industry
GCC Waste Management Industry REPORT HIGHLIGHTS
| Aspects | Details |
|---|---|
| Study Period | 2020-2034 |
| Base Year | 2025 |
| Estimated Year | 2026 |
| Forecast Period | 2026-2034 |
| Historical Period | 2020-2025 |
| Growth Rate | CAGR of 7.38% from 2020-2034 |
| Segmentation |
|
Table of Contents
- 1. Introduction
- 1.1. Research Scope
- 1.2. Market Segmentation
- 1.3. Research Objective
- 1.4. Definitions and Assumptions
- 2. Executive Summary
- 2.1. Market Snapshot
- 3. Market Dynamics
- 3.1. Market Drivers
- 3.2. Market Restrains
- 3.3. Market Trends
- 3.4. Market Opportunities
- 4. Market Factor Analysis
- 4.1. Porters Five Forces
- 4.1.1. Bargaining Power of Suppliers
- 4.1.2. Bargaining Power of Buyers
- 4.1.3. Threat of New Entrants
- 4.1.4. Threat of Substitutes
- 4.1.5. Competitive Rivalry
- 4.2. PESTEL analysis
- 4.3. BCG Analysis
- 4.3.1. Stars (High Growth, High Market Share)
- 4.3.2. Cash Cows (Low Growth, High Market Share)
- 4.3.3. Question Mark (High Growth, Low Market Share)
- 4.3.4. Dogs (Low Growth, Low Market Share)
- 4.4. Ansoff Matrix Analysis
- 4.5. Supply Chain Analysis
- 4.6. Regulatory Landscape
- 4.7. Current Market Potential and Opportunity Assessment (TAM–SAM–SOM Framework)
- 4.8. MSR Analyst Note
- 4.1. Porters Five Forces
- 5. Market Analysis, Insights and Forecast 2021-2033
- 5.1. Market Analysis, Insights and Forecast - by Waste Type
- 5.1.1. Industrial Waste
- 5.1.2. Municipal Solid Waste
- 5.1.3. Hazardous Waste
- 5.1.4. E-Waste
- 5.1.5. Plastic Waste
- 5.1.6. Bio-Medical Waste
- 5.2. Market Analysis, Insights and Forecast - by Disposal Method
- 5.2.1. Collection
- 5.2.2. Landfills
- 5.2.3. Incineration
- 5.2.4. Recycling
- 5.3. Market Analysis, Insights and Forecast - by Region
- 5.3.1. North America
- 5.3.2. South America
- 5.3.3. Europe
- 5.3.4. Middle East & Africa
- 5.3.5. Asia Pacific
- 5.1. Market Analysis, Insights and Forecast - by Waste Type
- 6. Global GCC Waste Management Industry Analysis, Insights and Forecast, 2021-2033
- 6.1. Market Analysis, Insights and Forecast - by Waste Type
- 6.1.1. Industrial Waste
- 6.1.2. Municipal Solid Waste
- 6.1.3. Hazardous Waste
- 6.1.4. E-Waste
- 6.1.5. Plastic Waste
- 6.1.6. Bio-Medical Waste
- 6.2. Market Analysis, Insights and Forecast - by Disposal Method
- 6.2.1. Collection
- 6.2.2. Landfills
- 6.2.3. Incineration
- 6.2.4. Recycling
- 6.1. Market Analysis, Insights and Forecast - by Waste Type
- 7. North America GCC Waste Management Industry Analysis, Insights and Forecast, 2020-2032
- 7.1. Market Analysis, Insights and Forecast - by Waste Type
- 7.1.1. Industrial Waste
- 7.1.2. Municipal Solid Waste
- 7.1.3. Hazardous Waste
- 7.1.4. E-Waste
- 7.1.5. Plastic Waste
- 7.1.6. Bio-Medical Waste
- 7.2. Market Analysis, Insights and Forecast - by Disposal Method
- 7.2.1. Collection
- 7.2.2. Landfills
- 7.2.3. Incineration
- 7.2.4. Recycling
- 7.1. Market Analysis, Insights and Forecast - by Waste Type
- 8. South America GCC Waste Management Industry Analysis, Insights and Forecast, 2020-2032
- 8.1. Market Analysis, Insights and Forecast - by Waste Type
- 8.1.1. Industrial Waste
- 8.1.2. Municipal Solid Waste
- 8.1.3. Hazardous Waste
- 8.1.4. E-Waste
- 8.1.5. Plastic Waste
- 8.1.6. Bio-Medical Waste
- 8.2. Market Analysis, Insights and Forecast - by Disposal Method
- 8.2.1. Collection
- 8.2.2. Landfills
- 8.2.3. Incineration
- 8.2.4. Recycling
- 8.1. Market Analysis, Insights and Forecast - by Waste Type
- 9. Europe GCC Waste Management Industry Analysis, Insights and Forecast, 2020-2032
- 9.1. Market Analysis, Insights and Forecast - by Waste Type
- 9.1.1. Industrial Waste
- 9.1.2. Municipal Solid Waste
- 9.1.3. Hazardous Waste
- 9.1.4. E-Waste
- 9.1.5. Plastic Waste
- 9.1.6. Bio-Medical Waste
- 9.2. Market Analysis, Insights and Forecast - by Disposal Method
- 9.2.1. Collection
- 9.2.2. Landfills
- 9.2.3. Incineration
- 9.2.4. Recycling
- 9.1. Market Analysis, Insights and Forecast - by Waste Type
- 10. Middle East & Africa GCC Waste Management Industry Analysis, Insights and Forecast, 2020-2032
- 10.1. Market Analysis, Insights and Forecast - by Waste Type
- 10.1.1. Industrial Waste
- 10.1.2. Municipal Solid Waste
- 10.1.3. Hazardous Waste
- 10.1.4. E-Waste
- 10.1.5. Plastic Waste
- 10.1.6. Bio-Medical Waste
- 10.2. Market Analysis, Insights and Forecast - by Disposal Method
- 10.2.1. Collection
- 10.2.2. Landfills
- 10.2.3. Incineration
- 10.2.4. Recycling
- 10.1. Market Analysis, Insights and Forecast - by Waste Type
- 11. Asia Pacific GCC Waste Management Industry Analysis, Insights and Forecast, 2020-2032
- 11.1. Market Analysis, Insights and Forecast - by Waste Type
- 11.1.1. Industrial Waste
- 11.1.2. Municipal Solid Waste
- 11.1.3. Hazardous Waste
- 11.1.4. E-Waste
- 11.1.5. Plastic Waste
- 11.1.6. Bio-Medical Waste
- 11.2. Market Analysis, Insights and Forecast - by Disposal Method
- 11.2.1. Collection
- 11.2.2. Landfills
- 11.2.3. Incineration
- 11.2.4. Recycling
- 11.1. Market Analysis, Insights and Forecast - by Waste Type
- 12. Competitive Analysis
- 12.1. Company Profiles
- 12.1.1 Averda
- 12.1.1.1. Company Overview
- 12.1.1.2. Products
- 12.1.1.3. Company Financials
- 12.1.1.4. SWOT Analysis
- 12.1.2 EnviroServe
- 12.1.2.1. Company Overview
- 12.1.2.2. Products
- 12.1.2.3. Company Financials
- 12.1.2.4. SWOT Analysis
- 12.1.3 Suez Middle East Recycling LLC
- 12.1.3.1. Company Overview
- 12.1.3.2. Products
- 12.1.3.3. Company Financials
- 12.1.3.4. SWOT Analysis
- 12.1.4 Green Mountains
- 12.1.4.1. Company Overview
- 12.1.4.2. Products
- 12.1.4.3. Company Financials
- 12.1.4.4. SWOT Analysis
- 12.1.5 Veolia
- 12.1.5.1. Company Overview
- 12.1.5.2. Products
- 12.1.5.3. Company Financials
- 12.1.5.4. SWOT Analysis
- 12.1.6 Blue LLC
- 12.1.6.1. Company Overview
- 12.1.6.2. Products
- 12.1.6.3. Company Financials
- 12.1.6.4. SWOT Analysis
- 12.1.7 Envac
- 12.1.7.1. Company Overview
- 12.1.7.2. Products
- 12.1.7.3. Company Financials
- 12.1.7.4. SWOT Analysis
- 12.1.8 SEPCO Environment
- 12.1.8.1. Company Overview
- 12.1.8.2. Products
- 12.1.8.3. Company Financials
- 12.1.8.4. SWOT Analysis
- 12.1.9 Wasco
- 12.1.9.1. Company Overview
- 12.1.9.2. Products
- 12.1.9.3. Company Financials
- 12.1.9.4. SWOT Analysis
- 12.1.10 Saudi Investment Recycling Company
- 12.1.10.1. Company Overview
- 12.1.10.2. Products
- 12.1.10.3. Company Financials
- 12.1.10.4. SWOT Analysis
- 12.1.11 Dulsco Waste Management Services
- 12.1.11.1. Company Overview
- 12.1.11.2. Products
- 12.1.11.3. Company Financials
- 12.1.11.4. SWOT Analysis
- 12.1.12 Bee'ah
- 12.1.12.1. Company Overview
- 12.1.12.2. Products
- 12.1.12.3. Company Financials
- 12.1.12.4. SWOT Analysis
- 12.1.13 Power Waste Management and Transport LLC
- 12.1.13.1. Company Overview
- 12.1.13.2. Products
- 12.1.13.3. Company Financials
- 12.1.13.4. SWOT Analysis
- 12.1.14 Al Haya Enviro
- 12.1.14.1. Company Overview
- 12.1.14.2. Products
- 12.1.14.3. Company Financials
- 12.1.14.4. SWOT Analysis
- 12.1.15 Bin-Ovation
- 12.1.15.1. Company Overview
- 12.1.15.2. Products
- 12.1.15.3. Company Financials
- 12.1.15.4. SWOT Analysis
- 12.1.16 United Waste Management Company
- 12.1.16.1. Company Overview
- 12.1.16.2. Products
- 12.1.16.3. Company Financials
- 12.1.16.4. SWOT Analysis
- 12.1.17 Kuwait Waste Collection and Recycling Company**List Not Exhaustive
- 12.1.17.1. Company Overview
- 12.1.17.2. Products
- 12.1.17.3. Company Financials
- 12.1.17.4. SWOT Analysis
- 12.1.1 Averda
- 12.2. Market Entropy
- 12.2.1 Company's Key Areas Served
- 12.2.2 Recent Developments
- 12.3. Company Market Share Analysis 2025
- 12.3.1 Top 5 Companies Market Share Analysis
- 12.3.2 Top 3 Companies Market Share Analysis
- 12.4. List of Potential Customers
- 13. Research Methodology
List of Figures
- Figure 1: Global GCC Waste Management Industry Revenue Breakdown (Million, %) by Region 2025 & 2033
- Figure 2: Global GCC Waste Management Industry Volume Breakdown (Billion, %) by Region 2025 & 2033
- Figure 3: North America GCC Waste Management Industry Revenue (Million), by Waste Type 2025 & 2033
- Figure 4: North America GCC Waste Management Industry Volume (Billion), by Waste Type 2025 & 2033
- Figure 5: North America GCC Waste Management Industry Revenue Share (%), by Waste Type 2025 & 2033
- Figure 6: North America GCC Waste Management Industry Volume Share (%), by Waste Type 2025 & 2033
- Figure 7: North America GCC Waste Management Industry Revenue (Million), by Disposal Method 2025 & 2033
- Figure 8: North America GCC Waste Management Industry Volume (Billion), by Disposal Method 2025 & 2033
- Figure 9: North America GCC Waste Management Industry Revenue Share (%), by Disposal Method 2025 & 2033
- Figure 10: North America GCC Waste Management Industry Volume Share (%), by Disposal Method 2025 & 2033
- Figure 11: North America GCC Waste Management Industry Revenue (Million), by Country 2025 & 2033
- Figure 12: North America GCC Waste Management Industry Volume (Billion), by Country 2025 & 2033
- Figure 13: North America GCC Waste Management Industry Revenue Share (%), by Country 2025 & 2033
- Figure 14: North America GCC Waste Management Industry Volume Share (%), by Country 2025 & 2033
- Figure 15: South America GCC Waste Management Industry Revenue (Million), by Waste Type 2025 & 2033
- Figure 16: South America GCC Waste Management Industry Volume (Billion), by Waste Type 2025 & 2033
- Figure 17: South America GCC Waste Management Industry Revenue Share (%), by Waste Type 2025 & 2033
- Figure 18: South America GCC Waste Management Industry Volume Share (%), by Waste Type 2025 & 2033
- Figure 19: South America GCC Waste Management Industry Revenue (Million), by Disposal Method 2025 & 2033
- Figure 20: South America GCC Waste Management Industry Volume (Billion), by Disposal Method 2025 & 2033
- Figure 21: South America GCC Waste Management Industry Revenue Share (%), by Disposal Method 2025 & 2033
- Figure 22: South America GCC Waste Management Industry Volume Share (%), by Disposal Method 2025 & 2033
- Figure 23: South America GCC Waste Management Industry Revenue (Million), by Country 2025 & 2033
- Figure 24: South America GCC Waste Management Industry Volume (Billion), by Country 2025 & 2033
- Figure 25: South America GCC Waste Management Industry Revenue Share (%), by Country 2025 & 2033
- Figure 26: South America GCC Waste Management Industry Volume Share (%), by Country 2025 & 2033
- Figure 27: Europe GCC Waste Management Industry Revenue (Million), by Waste Type 2025 & 2033
- Figure 28: Europe GCC Waste Management Industry Volume (Billion), by Waste Type 2025 & 2033
- Figure 29: Europe GCC Waste Management Industry Revenue Share (%), by Waste Type 2025 & 2033
- Figure 30: Europe GCC Waste Management Industry Volume Share (%), by Waste Type 2025 & 2033
- Figure 31: Europe GCC Waste Management Industry Revenue (Million), by Disposal Method 2025 & 2033
- Figure 32: Europe GCC Waste Management Industry Volume (Billion), by Disposal Method 2025 & 2033
- Figure 33: Europe GCC Waste Management Industry Revenue Share (%), by Disposal Method 2025 & 2033
- Figure 34: Europe GCC Waste Management Industry Volume Share (%), by Disposal Method 2025 & 2033
- Figure 35: Europe GCC Waste Management Industry Revenue (Million), by Country 2025 & 2033
- Figure 36: Europe GCC Waste Management Industry Volume (Billion), by Country 2025 & 2033
- Figure 37: Europe GCC Waste Management Industry Revenue Share (%), by Country 2025 & 2033
- Figure 38: Europe GCC Waste Management Industry Volume Share (%), by Country 2025 & 2033
- Figure 39: Middle East & Africa GCC Waste Management Industry Revenue (Million), by Waste Type 2025 & 2033
- Figure 40: Middle East & Africa GCC Waste Management Industry Volume (Billion), by Waste Type 2025 & 2033
- Figure 41: Middle East & Africa GCC Waste Management Industry Revenue Share (%), by Waste Type 2025 & 2033
- Figure 42: Middle East & Africa GCC Waste Management Industry Volume Share (%), by Waste Type 2025 & 2033
- Figure 43: Middle East & Africa GCC Waste Management Industry Revenue (Million), by Disposal Method 2025 & 2033
- Figure 44: Middle East & Africa GCC Waste Management Industry Volume (Billion), by Disposal Method 2025 & 2033
- Figure 45: Middle East & Africa GCC Waste Management Industry Revenue Share (%), by Disposal Method 2025 & 2033
- Figure 46: Middle East & Africa GCC Waste Management Industry Volume Share (%), by Disposal Method 2025 & 2033
- Figure 47: Middle East & Africa GCC Waste Management Industry Revenue (Million), by Country 2025 & 2033
- Figure 48: Middle East & Africa GCC Waste Management Industry Volume (Billion), by Country 2025 & 2033
- Figure 49: Middle East & Africa GCC Waste Management Industry Revenue Share (%), by Country 2025 & 2033
- Figure 50: Middle East & Africa GCC Waste Management Industry Volume Share (%), by Country 2025 & 2033
- Figure 51: Asia Pacific GCC Waste Management Industry Revenue (Million), by Waste Type 2025 & 2033
- Figure 52: Asia Pacific GCC Waste Management Industry Volume (Billion), by Waste Type 2025 & 2033
- Figure 53: Asia Pacific GCC Waste Management Industry Revenue Share (%), by Waste Type 2025 & 2033
- Figure 54: Asia Pacific GCC Waste Management Industry Volume Share (%), by Waste Type 2025 & 2033
- Figure 55: Asia Pacific GCC Waste Management Industry Revenue (Million), by Disposal Method 2025 & 2033
- Figure 56: Asia Pacific GCC Waste Management Industry Volume (Billion), by Disposal Method 2025 & 2033
- Figure 57: Asia Pacific GCC Waste Management Industry Revenue Share (%), by Disposal Method 2025 & 2033
- Figure 58: Asia Pacific GCC Waste Management Industry Volume Share (%), by Disposal Method 2025 & 2033
- Figure 59: Asia Pacific GCC Waste Management Industry Revenue (Million), by Country 2025 & 2033
- Figure 60: Asia Pacific GCC Waste Management Industry Volume (Billion), by Country 2025 & 2033
- Figure 61: Asia Pacific GCC Waste Management Industry Revenue Share (%), by Country 2025 & 2033
- Figure 62: Asia Pacific GCC Waste Management Industry Volume Share (%), by Country 2025 & 2033
List of Tables
- Table 1: Global GCC Waste Management Industry Revenue Million Forecast, by Waste Type 2020 & 2033
- Table 2: Global GCC Waste Management Industry Volume Billion Forecast, by Waste Type 2020 & 2033
- Table 3: Global GCC Waste Management Industry Revenue Million Forecast, by Disposal Method 2020 & 2033
- Table 4: Global GCC Waste Management Industry Volume Billion Forecast, by Disposal Method 2020 & 2033
- Table 5: Global GCC Waste Management Industry Revenue Million Forecast, by Region 2020 & 2033
- Table 6: Global GCC Waste Management Industry Volume Billion Forecast, by Region 2020 & 2033
- Table 7: Global GCC Waste Management Industry Revenue Million Forecast, by Waste Type 2020 & 2033
- Table 8: Global GCC Waste Management Industry Volume Billion Forecast, by Waste Type 2020 & 2033
- Table 9: Global GCC Waste Management Industry Revenue Million Forecast, by Disposal Method 2020 & 2033
- Table 10: Global GCC Waste Management Industry Volume Billion Forecast, by Disposal Method 2020 & 2033
- Table 11: Global GCC Waste Management Industry Revenue Million Forecast, by Country 2020 & 2033
- Table 12: Global GCC Waste Management Industry Volume Billion Forecast, by Country 2020 & 2033
- Table 13: United States GCC Waste Management Industry Revenue (Million) Forecast, by Application 2020 & 2033
- Table 14: United States GCC Waste Management Industry Volume (Billion) Forecast, by Application 2020 & 2033
- Table 15: Canada GCC Waste Management Industry Revenue (Million) Forecast, by Application 2020 & 2033
- Table 16: Canada GCC Waste Management Industry Volume (Billion) Forecast, by Application 2020 & 2033
- Table 17: Mexico GCC Waste Management Industry Revenue (Million) Forecast, by Application 2020 & 2033
- Table 18: Mexico GCC Waste Management Industry Volume (Billion) Forecast, by Application 2020 & 2033
- Table 19: Global GCC Waste Management Industry Revenue Million Forecast, by Waste Type 2020 & 2033
- Table 20: Global GCC Waste Management Industry Volume Billion Forecast, by Waste Type 2020 & 2033
- Table 21: Global GCC Waste Management Industry Revenue Million Forecast, by Disposal Method 2020 & 2033
- Table 22: Global GCC Waste Management Industry Volume Billion Forecast, by Disposal Method 2020 & 2033
- Table 23: Global GCC Waste Management Industry Revenue Million Forecast, by Country 2020 & 2033
- Table 24: Global GCC Waste Management Industry Volume Billion Forecast, by Country 2020 & 2033
- Table 25: Brazil GCC Waste Management Industry Revenue (Million) Forecast, by Application 2020 & 2033
- Table 26: Brazil GCC Waste Management Industry Volume (Billion) Forecast, by Application 2020 & 2033
- Table 27: Argentina GCC Waste Management Industry Revenue (Million) Forecast, by Application 2020 & 2033
- Table 28: Argentina GCC Waste Management Industry Volume (Billion) Forecast, by Application 2020 & 2033
- Table 29: Rest of South America GCC Waste Management Industry Revenue (Million) Forecast, by Application 2020 & 2033
- Table 30: Rest of South America GCC Waste Management Industry Volume (Billion) Forecast, by Application 2020 & 2033
- Table 31: Global GCC Waste Management Industry Revenue Million Forecast, by Waste Type 2020 & 2033
- Table 32: Global GCC Waste Management Industry Volume Billion Forecast, by Waste Type 2020 & 2033
- Table 33: Global GCC Waste Management Industry Revenue Million Forecast, by Disposal Method 2020 & 2033
- Table 34: Global GCC Waste Management Industry Volume Billion Forecast, by Disposal Method 2020 & 2033
- Table 35: Global GCC Waste Management Industry Revenue Million Forecast, by Country 2020 & 2033
- Table 36: Global GCC Waste Management Industry Volume Billion Forecast, by Country 2020 & 2033
- Table 37: United Kingdom GCC Waste Management Industry Revenue (Million) Forecast, by Application 2020 & 2033
- Table 38: United Kingdom GCC Waste Management Industry Volume (Billion) Forecast, by Application 2020 & 2033
- Table 39: Germany GCC Waste Management Industry Revenue (Million) Forecast, by Application 2020 & 2033
- Table 40: Germany GCC Waste Management Industry Volume (Billion) Forecast, by Application 2020 & 2033
- Table 41: France GCC Waste Management Industry Revenue (Million) Forecast, by Application 2020 & 2033
- Table 42: France GCC Waste Management Industry Volume (Billion) Forecast, by Application 2020 & 2033
- Table 43: Italy GCC Waste Management Industry Revenue (Million) Forecast, by Application 2020 & 2033
- Table 44: Italy GCC Waste Management Industry Volume (Billion) Forecast, by Application 2020 & 2033
- Table 45: Spain GCC Waste Management Industry Revenue (Million) Forecast, by Application 2020 & 2033
- Table 46: Spain GCC Waste Management Industry Volume (Billion) Forecast, by Application 2020 & 2033
- Table 47: Russia GCC Waste Management Industry Revenue (Million) Forecast, by Application 2020 & 2033
- Table 48: Russia GCC Waste Management Industry Volume (Billion) Forecast, by Application 2020 & 2033
- Table 49: Benelux GCC Waste Management Industry Revenue (Million) Forecast, by Application 2020 & 2033
- Table 50: Benelux GCC Waste Management Industry Volume (Billion) Forecast, by Application 2020 & 2033
- Table 51: Nordics GCC Waste Management Industry Revenue (Million) Forecast, by Application 2020 & 2033
- Table 52: Nordics GCC Waste Management Industry Volume (Billion) Forecast, by Application 2020 & 2033
- Table 53: Rest of Europe GCC Waste Management Industry Revenue (Million) Forecast, by Application 2020 & 2033
- Table 54: Rest of Europe GCC Waste Management Industry Volume (Billion) Forecast, by Application 2020 & 2033
- Table 55: Global GCC Waste Management Industry Revenue Million Forecast, by Waste Type 2020 & 2033
- Table 56: Global GCC Waste Management Industry Volume Billion Forecast, by Waste Type 2020 & 2033
- Table 57: Global GCC Waste Management Industry Revenue Million Forecast, by Disposal Method 2020 & 2033
- Table 58: Global GCC Waste Management Industry Volume Billion Forecast, by Disposal Method 2020 & 2033
- Table 59: Global GCC Waste Management Industry Revenue Million Forecast, by Country 2020 & 2033
- Table 60: Global GCC Waste Management Industry Volume Billion Forecast, by Country 2020 & 2033
- Table 61: Turkey GCC Waste Management Industry Revenue (Million) Forecast, by Application 2020 & 2033
- Table 62: Turkey GCC Waste Management Industry Volume (Billion) Forecast, by Application 2020 & 2033
- Table 63: Israel GCC Waste Management Industry Revenue (Million) Forecast, by Application 2020 & 2033
- Table 64: Israel GCC Waste Management Industry Volume (Billion) Forecast, by Application 2020 & 2033
- Table 65: GCC GCC Waste Management Industry Revenue (Million) Forecast, by Application 2020 & 2033
- Table 66: GCC GCC Waste Management Industry Volume (Billion) Forecast, by Application 2020 & 2033
- Table 67: North Africa GCC Waste Management Industry Revenue (Million) Forecast, by Application 2020 & 2033
- Table 68: North Africa GCC Waste Management Industry Volume (Billion) Forecast, by Application 2020 & 2033
- Table 69: South Africa GCC Waste Management Industry Revenue (Million) Forecast, by Application 2020 & 2033
- Table 70: South Africa GCC Waste Management Industry Volume (Billion) Forecast, by Application 2020 & 2033
- Table 71: Rest of Middle East & Africa GCC Waste Management Industry Revenue (Million) Forecast, by Application 2020 & 2033
- Table 72: Rest of Middle East & Africa GCC Waste Management Industry Volume (Billion) Forecast, by Application 2020 & 2033
- Table 73: Global GCC Waste Management Industry Revenue Million Forecast, by Waste Type 2020 & 2033
- Table 74: Global GCC Waste Management Industry Volume Billion Forecast, by Waste Type 2020 & 2033
- Table 75: Global GCC Waste Management Industry Revenue Million Forecast, by Disposal Method 2020 & 2033
- Table 76: Global GCC Waste Management Industry Volume Billion Forecast, by Disposal Method 2020 & 2033
- Table 77: Global GCC Waste Management Industry Revenue Million Forecast, by Country 2020 & 2033
- Table 78: Global GCC Waste Management Industry Volume Billion Forecast, by Country 2020 & 2033
- Table 79: China GCC Waste Management Industry Revenue (Million) Forecast, by Application 2020 & 2033
- Table 80: China GCC Waste Management Industry Volume (Billion) Forecast, by Application 2020 & 2033
- Table 81: India GCC Waste Management Industry Revenue (Million) Forecast, by Application 2020 & 2033
- Table 82: India GCC Waste Management Industry Volume (Billion) Forecast, by Application 2020 & 2033
- Table 83: Japan GCC Waste Management Industry Revenue (Million) Forecast, by Application 2020 & 2033
- Table 84: Japan GCC Waste Management Industry Volume (Billion) Forecast, by Application 2020 & 2033
- Table 85: South Korea GCC Waste Management Industry Revenue (Million) Forecast, by Application 2020 & 2033
- Table 86: South Korea GCC Waste Management Industry Volume (Billion) Forecast, by Application 2020 & 2033
- Table 87: ASEAN GCC Waste Management Industry Revenue (Million) Forecast, by Application 2020 & 2033
- Table 88: ASEAN GCC Waste Management Industry Volume (Billion) Forecast, by Application 2020 & 2033
- Table 89: Oceania GCC Waste Management Industry Revenue (Million) Forecast, by Application 2020 & 2033
- Table 90: Oceania GCC Waste Management Industry Volume (Billion) Forecast, by Application 2020 & 2033
- Table 91: Rest of Asia Pacific GCC Waste Management Industry Revenue (Million) Forecast, by Application 2020 & 2033
- Table 92: Rest of Asia Pacific GCC Waste Management Industry Volume (Billion) Forecast, by Application 2020 & 2033
Frequently Asked Questions
1. What is the projected Compound Annual Growth Rate (CAGR) of the GCC Waste Management Industry?
The projected CAGR is approximately 7.38%.
2. Which companies are prominent players in the GCC Waste Management Industry?
Key companies in the market include Averda, EnviroServe, Suez Middle East Recycling LLC, Green Mountains, Veolia, Blue LLC, Envac, SEPCO Environment, Wasco, Saudi Investment Recycling Company, Dulsco Waste Management Services, Bee'ah, Power Waste Management and Transport LLC, Al Haya Enviro, Bin-Ovation, United Waste Management Company, Kuwait Waste Collection and Recycling Company**List Not Exhaustive.
3. What are the main segments of the GCC Waste Management Industry?
The market segments include Waste Type, Disposal Method.
4. Can you provide details about the market size?
The market size is estimated to be USD 63.56 Million as of 2022.
5. What are some drivers contributing to market growth?
4.; Increasing demand for mining waste co-disposable.
6. What are the notable trends driving market growth?
Increasing E-waste Generation in Gulf Cooperation Council Region.
7. Are there any restraints impacting market growth?
4.; Increasing demand for mining waste co-disposable.
8. Can you provide examples of recent developments in the market?
December 2023: Electric mobility firm Wardwizard Innovations and Mobility entered into an agreement with the Sharjah Government co-owned sustainable waste management company BEEAH Group (BG) for the manufacturing of electric vehicles. Under this collaboration, Wardwizard Innovations and Mobility, along with BEEAH Group, will jointly promote electric vehicles in GCC nations and the African region.
9. What pricing options are available for accessing the report?
Pricing options include single-user, multi-user, and enterprise licenses priced at USD 3800, USD 4500, and USD 5800 respectively.
10. Is the market size provided in terms of value or volume?
The market size is provided in terms of value, measured in Million and volume, measured in Billion.
11. Are there any specific market keywords associated with the report?
Yes, the market keyword associated with the report is "GCC Waste Management Industry," which aids in identifying and referencing the specific market segment covered.
12. How do I determine which pricing option suits my needs best?
The pricing options vary based on user requirements and access needs. Individual users may opt for single-user licenses, while businesses requiring broader access may choose multi-user or enterprise licenses for cost-effective access to the report.
13. Are there any additional resources or data provided in the GCC Waste Management Industry report?
While the report offers comprehensive insights, it's advisable to review the specific contents or supplementary materials provided to ascertain if additional resources or data are available.
14. How can I stay updated on further developments or reports in the GCC Waste Management Industry?
To stay informed about further developments, trends, and reports in the GCC Waste Management Industry, consider subscribing to industry newsletters, following relevant companies and organizations, or regularly checking reputable industry news sources and publications.
Methodology
Step 1 - Identification of Relevant Samples Size from Population Database


Step 2 - Approaches for Defining Global Market Size (Value, Volume* & Price*)

Note*: In applicable scenarios
Step 3 - Data Sources
Primary Research
- Web Analytics
- Survey Reports
- Research Institute
- Latest Research Reports
- Opinion Leaders
Secondary Research
- Annual Reports
- White Paper
- Latest Press Release
- Industry Association
- Paid Database
- Investor Presentations

Step 4 - Data Triangulation
Involves using different sources of information in order to increase the validity of a study
These sources are likely to be stakeholders in a program - participants, other researchers, program staff, other community members, and so on.
Then we put all data in single framework & apply various statistical tools to find out the dynamic on the market.
During the analysis stage, feedback from the stakeholder groups would be compared to determine areas of agreement as well as areas of divergence