

Key Insights
The global automotive dashboard market is experiencing robust growth, driven by the increasing demand for advanced driver-assistance systems (ADAS), enhanced infotainment features, and the rising adoption of electric vehicles (EVs). The market's compound annual growth rate (CAGR) exceeding 7% indicates a significant expansion projected through 2033. Key drivers include the integration of larger, higher-resolution displays, the shift towards connected car technologies offering features like navigation, internet connectivity, and over-the-air updates, and a growing preference for customizable and personalized dashboard interfaces. The market is segmented by vehicle type (passenger cars and commercial vehicles), sales channel (OEM and aftermarket), and dashboard type (LCD and conventional). Passenger cars currently dominate the market due to higher production volumes, but the commercial vehicle segment is expected to witness substantial growth fueled by increasing fleet management and safety requirements. The LCD dashboard segment is experiencing rapid expansion due to its superior functionality and visual appeal compared to conventional dashboards. Leading players like ABB, Johnson Controls, Visteon, and Toyoda Gosei are investing heavily in research and development to innovate dashboard designs and integrate advanced technologies. While the market faces restraints like high initial investment costs and the need for skilled labor for installation, the long-term growth prospects remain highly positive, particularly in rapidly developing economies in Asia-Pacific and other emerging regions.
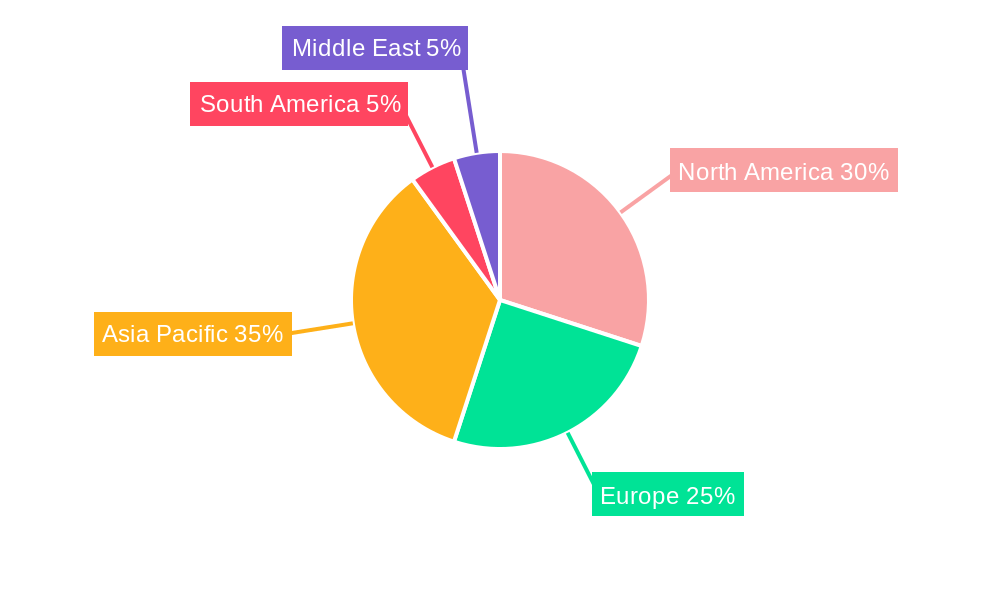
The regional distribution of the automotive dashboard market reflects varying levels of automotive production and technological adoption. North America and Europe, being established automotive markets, currently hold a significant share. However, the Asia-Pacific region, especially China and India, is witnessing the fastest growth due to rising vehicle sales and increasing government support for technological advancements within the automotive sector. This rapid growth in Asia-Pacific is expected to continue, gradually increasing its market share over the forecast period. Competition in the market is intense, with both established players and emerging companies striving for market share through technological innovation, strategic partnerships, and mergers and acquisitions. The future of the automotive dashboard market is characterized by the integration of artificial intelligence (AI), augmented reality (AR), and more sophisticated user interfaces to provide a safer and more engaging driving experience.

Automotive Dashboard Market: A Comprehensive Report (2019-2033)
This in-depth report provides a comprehensive analysis of the global Automotive Dashboard Market, offering invaluable insights for stakeholders across the automotive value chain. From market dynamics and leading players to future growth opportunities, this report unveils the key trends shaping this dynamic sector. The study period covers 2019-2033, with 2025 serving as the base and estimated year. The forecast period spans 2025-2033, while the historical period encompasses 2019-2024. This report is crucial for automotive manufacturers, component suppliers, technology providers, and investors seeking to navigate the complexities of this rapidly evolving market.
Automotive Dashboard Market Concentration & Dynamics
The automotive dashboard market exhibits a moderately concentrated landscape, with a few major players holding significant market share. ABB Ltd, Johnson Controls International PLC, Visteon Corporation, and Faurecia SE are among the key players driving innovation and market expansion. However, the presence of several regional players like Hainan Drinda Automotive Trim Co Ltd, Dongfeng Electronic, and Huayu Automotive Systems Co Ltd signifies a competitive dynamic. Market share analysis indicates that the top five players collectively account for approximately xx% of the global market in 2025.
Innovation is heavily driven by the integration of advanced driver-assistance systems (ADAS) and infotainment technologies. Regulatory frameworks focused on safety and emissions are significantly impacting dashboard design and functionality. The increasing adoption of LCD dashboards is replacing conventional dashboards, presenting opportunities for technological innovation. Substitute products, such as augmented reality (AR) heads-up displays, are posing challenges. End-user trends, specifically the demand for personalized and connected in-vehicle experiences, are fueling market growth. M&A activity within the automotive dashboard sector has been moderate in recent years, with approximately xx deals recorded between 2019 and 2024.
- Market Share: Top 5 players: xx% (2025)
- M&A Deals (2019-2024): xx
- Key Technological Trends: ADAS integration, LCD adoption, AR HUDs.
- Regulatory Impacts: Safety standards, emission regulations.
Automotive Dashboard Market Industry Insights & Trends
The global automotive dashboard market is experiencing robust growth, driven by the increasing demand for advanced vehicle features and enhanced safety. The market size was valued at approximately $xx Million in 2025 and is projected to reach $xx Million by 2033, exhibiting a CAGR of xx% during the forecast period. Technological disruptions, particularly the rise of connected cars and autonomous driving technology, are reshaping the landscape. Consumer behavior is shifting towards personalized dashboards with intuitive interfaces and seamless integration with smartphones and other smart devices. This demand is further fueled by the growing adoption of electric vehicles (EVs), which require specialized dashboards to accommodate their unique requirements.
Increased penetration of advanced driver-assistance systems (ADAS) into mass-market vehicles significantly impacts the market. Moreover, the demand for infotainment systems and connected services are major drivers of market growth. The preference for premium features is driving the adoption of high-quality, feature-rich dashboards, which is boosting the market size and driving revenue growth. However, challenges like high production costs and stringent regulatory requirements continue to impact the sector. The rising adoption of sophisticated technology is continuously upgrading the functionality and feature integration of dashboards.

Key Markets & Segments Leading Automotive Dashboard Market
The passenger car segment dominates the automotive dashboard market, accounting for the largest share due to higher vehicle production volumes. However, the commercial vehicle segment is also demonstrating considerable growth potential, driven by the rising demand for advanced driver-assistance systems and improved driver comfort in commercial fleets.
By Vehicle Type:
- Passenger Cars: Dominates market share due to high production volume and increasing consumer demand for advanced features.
- Commercial Vehicles: Experiencing strong growth due to increasing demand for driver safety and fleet management solutions.
By Sales Channel:
- OEM: Remains the primary sales channel, representing a significant share of the market.
- Aftermarket: Shows moderate growth, driven by the increasing preference for upgrading existing dashboards with newer technology.
By Type:
- LCD Dashboards: Experience rapid growth due to superior display quality, flexibility and connectivity capabilities.
- Conventional Dashboards: Still holds a significant share, but is gradually declining due to LCD's increasing dominance.
The Asia-Pacific region is currently the leading market, driven by robust automotive production, rising disposable incomes, and increasing vehicle ownership rates. North America and Europe are other key markets with significant growth potential. Factors contributing to regional dominance include economic growth, government support for automotive industry development, and readily available skilled labor.
Automotive Dashboard Market Product Developments
Recent product innovations focus on enhancing user experience, safety, and connectivity. Technological advancements include the integration of artificial intelligence (AI) for personalized driver assistance, improved display resolution and graphics, and seamless integration with cloud-based services. These advancements provide competitive advantages, attracting customers seeking advanced features and superior functionality. The introduction of flexible displays, organic LED (OLED) dashboards, and head-up displays significantly impact the market.
Challenges in the Automotive Dashboard Market
The automotive dashboard market faces several challenges, including stringent regulatory requirements impacting production costs and timelines. Supply chain disruptions and material shortages have resulted in production delays and price increases. Intense competition among established players and new entrants exerts downward pressure on prices. These factors collectively pose significant obstacles to sustained market growth. The increasing complexity of dashboard systems and related software add to the cost. Furthermore, rising material costs are significantly impacting the market.
Forces Driving Automotive Dashboard Market Growth
Technological advancements, such as AI integration, augmented reality, and improved connectivity solutions are key growth drivers. The increasing demand for enhanced in-car safety features and driver assistance technologies is also fueling the market expansion. Government regulations promoting vehicle safety and emissions standards further boost market demand. Economic factors like rising disposable incomes in emerging markets also contribute to the overall market growth.
Long-Term Growth Catalysts in the Automotive Dashboard Market
The automotive dashboard market's long-term growth will be propelled by continued technological innovations, strategic partnerships between automotive manufacturers and technology providers, and expansions into new markets. The emergence of innovative materials and the use of sustainable materials will have a long-term impact on the market. The growth of the electric vehicle market and the development of advanced driving assistance systems (ADAS) will continue to drive demand for sophisticated dashboards.
Emerging Opportunities in Automotive Dashboard Market
Emerging markets in developing countries present significant growth opportunities. The integration of advanced features like haptic feedback, gesture control, and biometrics offers potential for differentiation. New technologies such as holographic displays and projected dashboards represent future growth areas. Changing consumer preferences, particularly toward personalized and connected in-vehicle experiences, are creating new market niches.
Leading Players in the Automotive Dashboard Market Sector
- ABB Ltd
- Johnson Controls International PLC
- Hainan Drinda Automotive Trim Co Ltd
- Visteon Corporation
- Fusioncharts
- Dongfeng Electronic
- Huayu Automotive Systems Co Ltd
- Toyoda Gosei Co Ltd
- IA
- Faurecia SE
Key Milestones in Automotive Dashboard Market Industry
- 2020: Introduction of the first mass-produced vehicle with a fully integrated AI-powered dashboard.
- 2022: Major automotive OEM announces strategic partnership with a leading technology provider to develop next-generation dashboards.
- 2023: Several automotive component suppliers begin mass production of organic LED (OLED) dashboards.
- 2024: New safety regulations are introduced, impacting dashboard design and functionality.
Strategic Outlook for Automotive Dashboard Market
The automotive dashboard market holds substantial future potential, driven by technological innovation, increasing consumer demand for advanced features, and the expansion of the electric vehicle market. Strategic partnerships and investments in research and development will be crucial for success. Companies that prioritize innovation, focus on enhancing user experience, and adapt to changing regulatory landscapes are poised for significant growth. The adoption of sustainable manufacturing practices will also play a significant role in the long-term success of the market.
Automotive Dashboard Market Segmentation
-
1. Type
- 1.1. LCD Dashboard
- 1.2. Conventional Dashboard
-
2. Vehicle Type
- 2.1. Passenger Cars
- 2.2. Commercial Vehicles
-
3. Sales Channel
- 3.1. OEM
- 3.2. Aftermarket
Automotive Dashboard Market Segmentation By Geography
-
1. North America
- 1.1. United Sates
- 1.2. Canada
- 1.3. Rest of North America
-
2. Europe
- 2.1. Germany
- 2.2. United Kingdom
- 2.3. France
- 2.4. Russia
- 2.5. Rest of Europe
-
3. Asia Pacific
- 3.1. India
- 3.2. China
- 3.3. Japan
- 3.4. Rest of Asia Pacific
-
4. South America
- 4.1. Brazil
- 4.2. Argentina
- 4.3. Rest of South America
- 5. Middle East
-
6. United Arab Emirates
- 6.1. Saudi Arabia
- 6.2. Rest of Middle East
Automotive Dashboard Market REPORT HIGHLIGHTS
| Aspects | Details |
|---|---|
| Study Period | 2019-2033 |
| Base Year | 2024 |
| Estimated Year | 2025 |
| Forecast Period | 2025-2033 |
| Historical Period | 2019-2024 |
| Growth Rate | CAGR of > 7.00% from 2019-2033 |
| Segmentation |
|
Table of Contents
- 1. Introduction
- 1.1. Research Scope
- 1.2. Market Segmentation
- 1.3. Research Methodology
- 1.4. Definitions and Assumptions
- 2. Executive Summary
- 2.1. Introduction
- 3. Market Dynamics
- 3.1. Introduction
- 3.2. Market Drivers
- 3.2.1. Ease of Steering
- 3.3. Market Restrains
- 3.3.1. Cost and Price Sensitivity
- 3.4. Market Trends
- 3.4.1. Technological Developments Creating Demand for LCD Dashboards
- 4. Market Factor Analysis
- 4.1. Porters Five Forces
- 4.2. Supply/Value Chain
- 4.3. PESTEL analysis
- 4.4. Market Entropy
- 4.5. Patent/Trademark Analysis
- 5. Global Automotive Dashboard Market Analysis, Insights and Forecast, 2019-2031
- 5.1. Market Analysis, Insights and Forecast - by Type
- 5.1.1. LCD Dashboard
- 5.1.2. Conventional Dashboard
- 5.2. Market Analysis, Insights and Forecast - by Vehicle Type
- 5.2.1. Passenger Cars
- 5.2.2. Commercial Vehicles
- 5.3. Market Analysis, Insights and Forecast - by Sales Channel
- 5.3.1. OEM
- 5.3.2. Aftermarket
- 5.4. Market Analysis, Insights and Forecast - by Region
- 5.4.1. North America
- 5.4.2. Europe
- 5.4.3. Asia Pacific
- 5.4.4. South America
- 5.4.5. Middle East
- 5.4.6. United Arab Emirates
- 5.1. Market Analysis, Insights and Forecast - by Type
- 6. North America Automotive Dashboard Market Analysis, Insights and Forecast, 2019-2031
- 6.1. Market Analysis, Insights and Forecast - by Type
- 6.1.1. LCD Dashboard
- 6.1.2. Conventional Dashboard
- 6.2. Market Analysis, Insights and Forecast - by Vehicle Type
- 6.2.1. Passenger Cars
- 6.2.2. Commercial Vehicles
- 6.3. Market Analysis, Insights and Forecast - by Sales Channel
- 6.3.1. OEM
- 6.3.2. Aftermarket
- 6.1. Market Analysis, Insights and Forecast - by Type
- 7. Europe Automotive Dashboard Market Analysis, Insights and Forecast, 2019-2031
- 7.1. Market Analysis, Insights and Forecast - by Type
- 7.1.1. LCD Dashboard
- 7.1.2. Conventional Dashboard
- 7.2. Market Analysis, Insights and Forecast - by Vehicle Type
- 7.2.1. Passenger Cars
- 7.2.2. Commercial Vehicles
- 7.3. Market Analysis, Insights and Forecast - by Sales Channel
- 7.3.1. OEM
- 7.3.2. Aftermarket
- 7.1. Market Analysis, Insights and Forecast - by Type
- 8. Asia Pacific Automotive Dashboard Market Analysis, Insights and Forecast, 2019-2031
- 8.1. Market Analysis, Insights and Forecast - by Type
- 8.1.1. LCD Dashboard
- 8.1.2. Conventional Dashboard
- 8.2. Market Analysis, Insights and Forecast - by Vehicle Type
- 8.2.1. Passenger Cars
- 8.2.2. Commercial Vehicles
- 8.3. Market Analysis, Insights and Forecast - by Sales Channel
- 8.3.1. OEM
- 8.3.2. Aftermarket
- 8.1. Market Analysis, Insights and Forecast - by Type
- 9. South America Automotive Dashboard Market Analysis, Insights and Forecast, 2019-2031
- 9.1. Market Analysis, Insights and Forecast - by Type
- 9.1.1. LCD Dashboard
- 9.1.2. Conventional Dashboard
- 9.2. Market Analysis, Insights and Forecast - by Vehicle Type
- 9.2.1. Passenger Cars
- 9.2.2. Commercial Vehicles
- 9.3. Market Analysis, Insights and Forecast - by Sales Channel
- 9.3.1. OEM
- 9.3.2. Aftermarket
- 9.1. Market Analysis, Insights and Forecast - by Type
- 10. Middle East Automotive Dashboard Market Analysis, Insights and Forecast, 2019-2031
- 10.1. Market Analysis, Insights and Forecast - by Type
- 10.1.1. LCD Dashboard
- 10.1.2. Conventional Dashboard
- 10.2. Market Analysis, Insights and Forecast - by Vehicle Type
- 10.2.1. Passenger Cars
- 10.2.2. Commercial Vehicles
- 10.3. Market Analysis, Insights and Forecast - by Sales Channel
- 10.3.1. OEM
- 10.3.2. Aftermarket
- 10.1. Market Analysis, Insights and Forecast - by Type
- 11. United Arab Emirates Automotive Dashboard Market Analysis, Insights and Forecast, 2019-2031
- 11.1. Market Analysis, Insights and Forecast - by Type
- 11.1.1. LCD Dashboard
- 11.1.2. Conventional Dashboard
- 11.2. Market Analysis, Insights and Forecast - by Vehicle Type
- 11.2.1. Passenger Cars
- 11.2.2. Commercial Vehicles
- 11.3. Market Analysis, Insights and Forecast - by Sales Channel
- 11.3.1. OEM
- 11.3.2. Aftermarket
- 11.1. Market Analysis, Insights and Forecast - by Type
- 12. North America Automotive Dashboard Market Analysis, Insights and Forecast, 2019-2031
- 12.1. Market Analysis, Insights and Forecast - By Country/Sub-region
- 12.1.1 United Sates
- 12.1.2 Canada
- 12.1.3 Rest of North America
- 13. Europe Automotive Dashboard Market Analysis, Insights and Forecast, 2019-2031
- 13.1. Market Analysis, Insights and Forecast - By Country/Sub-region
- 13.1.1 Germany
- 13.1.2 United Kingdom
- 13.1.3 France
- 13.1.4 Russia
- 13.1.5 Rest of Europe
- 14. Asia Pacific Automotive Dashboard Market Analysis, Insights and Forecast, 2019-2031
- 14.1. Market Analysis, Insights and Forecast - By Country/Sub-region
- 14.1.1 India
- 14.1.2 China
- 14.1.3 Japan
- 14.1.4 Rest of Asia Pacific
- 15. South America Automotive Dashboard Market Analysis, Insights and Forecast, 2019-2031
- 15.1. Market Analysis, Insights and Forecast - By Country/Sub-region
- 15.1.1 Brazil
- 15.1.2 Argentina
- 15.1.3 Rest of South America
- 16. Middle East Automotive Dashboard Market Analysis, Insights and Forecast, 2019-2031
- 16.1. Market Analysis, Insights and Forecast - By Country/Sub-region
- 16.1.1.
- 17. United Arab Emirates Automotive Dashboard Market Analysis, Insights and Forecast, 2019-2031
- 17.1. Market Analysis, Insights and Forecast - By Country/Sub-region
- 17.1.1 Saudi Arabia
- 17.1.2 Rest of Middle East
- 18. Competitive Analysis
- 18.1. Global Market Share Analysis 2024
- 18.2. Company Profiles
- 18.2.1 ABB Ltd
- 18.2.1.1. Overview
- 18.2.1.2. Products
- 18.2.1.3. SWOT Analysis
- 18.2.1.4. Recent Developments
- 18.2.1.5. Financials (Based on Availability)
- 18.2.2 Johnson Controls International PLC
- 18.2.2.1. Overview
- 18.2.2.2. Products
- 18.2.2.3. SWOT Analysis
- 18.2.2.4. Recent Developments
- 18.2.2.5. Financials (Based on Availability)
- 18.2.3 Hainan Drinda Automotive Trim Co Ltd
- 18.2.3.1. Overview
- 18.2.3.2. Products
- 18.2.3.3. SWOT Analysis
- 18.2.3.4. Recent Developments
- 18.2.3.5. Financials (Based on Availability)
- 18.2.4 Visteon Corporation
- 18.2.4.1. Overview
- 18.2.4.2. Products
- 18.2.4.3. SWOT Analysis
- 18.2.4.4. Recent Developments
- 18.2.4.5. Financials (Based on Availability)
- 18.2.5 Fusioncharts
- 18.2.5.1. Overview
- 18.2.5.2. Products
- 18.2.5.3. SWOT Analysis
- 18.2.5.4. Recent Developments
- 18.2.5.5. Financials (Based on Availability)
- 18.2.6 Dongfeng Electronic
- 18.2.6.1. Overview
- 18.2.6.2. Products
- 18.2.6.3. SWOT Analysis
- 18.2.6.4. Recent Developments
- 18.2.6.5. Financials (Based on Availability)
- 18.2.7 Huayu Automotive Systems Co Ltd
- 18.2.7.1. Overview
- 18.2.7.2. Products
- 18.2.7.3. SWOT Analysis
- 18.2.7.4. Recent Developments
- 18.2.7.5. Financials (Based on Availability)
- 18.2.8 Toyoda Gosei Co Ltd
- 18.2.8.1. Overview
- 18.2.8.2. Products
- 18.2.8.3. SWOT Analysis
- 18.2.8.4. Recent Developments
- 18.2.8.5. Financials (Based on Availability)
- 18.2.9 IA
- 18.2.9.1. Overview
- 18.2.9.2. Products
- 18.2.9.3. SWOT Analysis
- 18.2.9.4. Recent Developments
- 18.2.9.5. Financials (Based on Availability)
- 18.2.10 Faurecia SE
- 18.2.10.1. Overview
- 18.2.10.2. Products
- 18.2.10.3. SWOT Analysis
- 18.2.10.4. Recent Developments
- 18.2.10.5. Financials (Based on Availability)
- 18.2.1 ABB Ltd
List of Figures
- Figure 1: Global Automotive Dashboard Market Revenue Breakdown (Million, %) by Region 2024 & 2032
- Figure 2: North America Automotive Dashboard Market Revenue (Million), by Country 2024 & 2032
- Figure 3: North America Automotive Dashboard Market Revenue Share (%), by Country 2024 & 2032
- Figure 4: Europe Automotive Dashboard Market Revenue (Million), by Country 2024 & 2032
- Figure 5: Europe Automotive Dashboard Market Revenue Share (%), by Country 2024 & 2032
- Figure 6: Asia Pacific Automotive Dashboard Market Revenue (Million), by Country 2024 & 2032
- Figure 7: Asia Pacific Automotive Dashboard Market Revenue Share (%), by Country 2024 & 2032
- Figure 8: South America Automotive Dashboard Market Revenue (Million), by Country 2024 & 2032
- Figure 9: South America Automotive Dashboard Market Revenue Share (%), by Country 2024 & 2032
- Figure 10: Middle East Automotive Dashboard Market Revenue (Million), by Country 2024 & 2032
- Figure 11: Middle East Automotive Dashboard Market Revenue Share (%), by Country 2024 & 2032
- Figure 12: United Arab Emirates Automotive Dashboard Market Revenue (Million), by Country 2024 & 2032
- Figure 13: United Arab Emirates Automotive Dashboard Market Revenue Share (%), by Country 2024 & 2032
- Figure 14: North America Automotive Dashboard Market Revenue (Million), by Type 2024 & 2032
- Figure 15: North America Automotive Dashboard Market Revenue Share (%), by Type 2024 & 2032
- Figure 16: North America Automotive Dashboard Market Revenue (Million), by Vehicle Type 2024 & 2032
- Figure 17: North America Automotive Dashboard Market Revenue Share (%), by Vehicle Type 2024 & 2032
- Figure 18: North America Automotive Dashboard Market Revenue (Million), by Sales Channel 2024 & 2032
- Figure 19: North America Automotive Dashboard Market Revenue Share (%), by Sales Channel 2024 & 2032
- Figure 20: North America Automotive Dashboard Market Revenue (Million), by Country 2024 & 2032
- Figure 21: North America Automotive Dashboard Market Revenue Share (%), by Country 2024 & 2032
- Figure 22: Europe Automotive Dashboard Market Revenue (Million), by Type 2024 & 2032
- Figure 23: Europe Automotive Dashboard Market Revenue Share (%), by Type 2024 & 2032
- Figure 24: Europe Automotive Dashboard Market Revenue (Million), by Vehicle Type 2024 & 2032
- Figure 25: Europe Automotive Dashboard Market Revenue Share (%), by Vehicle Type 2024 & 2032
- Figure 26: Europe Automotive Dashboard Market Revenue (Million), by Sales Channel 2024 & 2032
- Figure 27: Europe Automotive Dashboard Market Revenue Share (%), by Sales Channel 2024 & 2032
- Figure 28: Europe Automotive Dashboard Market Revenue (Million), by Country 2024 & 2032
- Figure 29: Europe Automotive Dashboard Market Revenue Share (%), by Country 2024 & 2032
- Figure 30: Asia Pacific Automotive Dashboard Market Revenue (Million), by Type 2024 & 2032
- Figure 31: Asia Pacific Automotive Dashboard Market Revenue Share (%), by Type 2024 & 2032
- Figure 32: Asia Pacific Automotive Dashboard Market Revenue (Million), by Vehicle Type 2024 & 2032
- Figure 33: Asia Pacific Automotive Dashboard Market Revenue Share (%), by Vehicle Type 2024 & 2032
- Figure 34: Asia Pacific Automotive Dashboard Market Revenue (Million), by Sales Channel 2024 & 2032
- Figure 35: Asia Pacific Automotive Dashboard Market Revenue Share (%), by Sales Channel 2024 & 2032
- Figure 36: Asia Pacific Automotive Dashboard Market Revenue (Million), by Country 2024 & 2032
- Figure 37: Asia Pacific Automotive Dashboard Market Revenue Share (%), by Country 2024 & 2032
- Figure 38: South America Automotive Dashboard Market Revenue (Million), by Type 2024 & 2032
- Figure 39: South America Automotive Dashboard Market Revenue Share (%), by Type 2024 & 2032
- Figure 40: South America Automotive Dashboard Market Revenue (Million), by Vehicle Type 2024 & 2032
- Figure 41: South America Automotive Dashboard Market Revenue Share (%), by Vehicle Type 2024 & 2032
- Figure 42: South America Automotive Dashboard Market Revenue (Million), by Sales Channel 2024 & 2032
- Figure 43: South America Automotive Dashboard Market Revenue Share (%), by Sales Channel 2024 & 2032
- Figure 44: South America Automotive Dashboard Market Revenue (Million), by Country 2024 & 2032
- Figure 45: South America Automotive Dashboard Market Revenue Share (%), by Country 2024 & 2032
- Figure 46: Middle East Automotive Dashboard Market Revenue (Million), by Type 2024 & 2032
- Figure 47: Middle East Automotive Dashboard Market Revenue Share (%), by Type 2024 & 2032
- Figure 48: Middle East Automotive Dashboard Market Revenue (Million), by Vehicle Type 2024 & 2032
- Figure 49: Middle East Automotive Dashboard Market Revenue Share (%), by Vehicle Type 2024 & 2032
- Figure 50: Middle East Automotive Dashboard Market Revenue (Million), by Sales Channel 2024 & 2032
- Figure 51: Middle East Automotive Dashboard Market Revenue Share (%), by Sales Channel 2024 & 2032
- Figure 52: Middle East Automotive Dashboard Market Revenue (Million), by Country 2024 & 2032
- Figure 53: Middle East Automotive Dashboard Market Revenue Share (%), by Country 2024 & 2032
- Figure 54: United Arab Emirates Automotive Dashboard Market Revenue (Million), by Type 2024 & 2032
- Figure 55: United Arab Emirates Automotive Dashboard Market Revenue Share (%), by Type 2024 & 2032
- Figure 56: United Arab Emirates Automotive Dashboard Market Revenue (Million), by Vehicle Type 2024 & 2032
- Figure 57: United Arab Emirates Automotive Dashboard Market Revenue Share (%), by Vehicle Type 2024 & 2032
- Figure 58: United Arab Emirates Automotive Dashboard Market Revenue (Million), by Sales Channel 2024 & 2032
- Figure 59: United Arab Emirates Automotive Dashboard Market Revenue Share (%), by Sales Channel 2024 & 2032
- Figure 60: United Arab Emirates Automotive Dashboard Market Revenue (Million), by Country 2024 & 2032
- Figure 61: United Arab Emirates Automotive Dashboard Market Revenue Share (%), by Country 2024 & 2032
List of Tables
- Table 1: Global Automotive Dashboard Market Revenue Million Forecast, by Region 2019 & 2032
- Table 2: Global Automotive Dashboard Market Revenue Million Forecast, by Type 2019 & 2032
- Table 3: Global Automotive Dashboard Market Revenue Million Forecast, by Vehicle Type 2019 & 2032
- Table 4: Global Automotive Dashboard Market Revenue Million Forecast, by Sales Channel 2019 & 2032
- Table 5: Global Automotive Dashboard Market Revenue Million Forecast, by Region 2019 & 2032
- Table 6: Global Automotive Dashboard Market Revenue Million Forecast, by Country 2019 & 2032
- Table 7: United Sates Automotive Dashboard Market Revenue (Million) Forecast, by Application 2019 & 2032
- Table 8: Canada Automotive Dashboard Market Revenue (Million) Forecast, by Application 2019 & 2032
- Table 9: Rest of North America Automotive Dashboard Market Revenue (Million) Forecast, by Application 2019 & 2032
- Table 10: Global Automotive Dashboard Market Revenue Million Forecast, by Country 2019 & 2032
- Table 11: Germany Automotive Dashboard Market Revenue (Million) Forecast, by Application 2019 & 2032
- Table 12: United Kingdom Automotive Dashboard Market Revenue (Million) Forecast, by Application 2019 & 2032
- Table 13: France Automotive Dashboard Market Revenue (Million) Forecast, by Application 2019 & 2032
- Table 14: Russia Automotive Dashboard Market Revenue (Million) Forecast, by Application 2019 & 2032
- Table 15: Rest of Europe Automotive Dashboard Market Revenue (Million) Forecast, by Application 2019 & 2032
- Table 16: Global Automotive Dashboard Market Revenue Million Forecast, by Country 2019 & 2032
- Table 17: India Automotive Dashboard Market Revenue (Million) Forecast, by Application 2019 & 2032
- Table 18: China Automotive Dashboard Market Revenue (Million) Forecast, by Application 2019 & 2032
- Table 19: Japan Automotive Dashboard Market Revenue (Million) Forecast, by Application 2019 & 2032
- Table 20: Rest of Asia Pacific Automotive Dashboard Market Revenue (Million) Forecast, by Application 2019 & 2032
- Table 21: Global Automotive Dashboard Market Revenue Million Forecast, by Country 2019 & 2032
- Table 22: Brazil Automotive Dashboard Market Revenue (Million) Forecast, by Application 2019 & 2032
- Table 23: Argentina Automotive Dashboard Market Revenue (Million) Forecast, by Application 2019 & 2032
- Table 24: Rest of South America Automotive Dashboard Market Revenue (Million) Forecast, by Application 2019 & 2032
- Table 25: Global Automotive Dashboard Market Revenue Million Forecast, by Country 2019 & 2032
- Table 26: Automotive Dashboard Market Revenue (Million) Forecast, by Application 2019 & 2032
- Table 27: Global Automotive Dashboard Market Revenue Million Forecast, by Country 2019 & 2032
- Table 28: Saudi Arabia Automotive Dashboard Market Revenue (Million) Forecast, by Application 2019 & 2032
- Table 29: Rest of Middle East Automotive Dashboard Market Revenue (Million) Forecast, by Application 2019 & 2032
- Table 30: Global Automotive Dashboard Market Revenue Million Forecast, by Type 2019 & 2032
- Table 31: Global Automotive Dashboard Market Revenue Million Forecast, by Vehicle Type 2019 & 2032
- Table 32: Global Automotive Dashboard Market Revenue Million Forecast, by Sales Channel 2019 & 2032
- Table 33: Global Automotive Dashboard Market Revenue Million Forecast, by Country 2019 & 2032
- Table 34: United Sates Automotive Dashboard Market Revenue (Million) Forecast, by Application 2019 & 2032
- Table 35: Canada Automotive Dashboard Market Revenue (Million) Forecast, by Application 2019 & 2032
- Table 36: Rest of North America Automotive Dashboard Market Revenue (Million) Forecast, by Application 2019 & 2032
- Table 37: Global Automotive Dashboard Market Revenue Million Forecast, by Type 2019 & 2032
- Table 38: Global Automotive Dashboard Market Revenue Million Forecast, by Vehicle Type 2019 & 2032
- Table 39: Global Automotive Dashboard Market Revenue Million Forecast, by Sales Channel 2019 & 2032
- Table 40: Global Automotive Dashboard Market Revenue Million Forecast, by Country 2019 & 2032
- Table 41: Germany Automotive Dashboard Market Revenue (Million) Forecast, by Application 2019 & 2032
- Table 42: United Kingdom Automotive Dashboard Market Revenue (Million) Forecast, by Application 2019 & 2032
- Table 43: France Automotive Dashboard Market Revenue (Million) Forecast, by Application 2019 & 2032
- Table 44: Russia Automotive Dashboard Market Revenue (Million) Forecast, by Application 2019 & 2032
- Table 45: Rest of Europe Automotive Dashboard Market Revenue (Million) Forecast, by Application 2019 & 2032
- Table 46: Global Automotive Dashboard Market Revenue Million Forecast, by Type 2019 & 2032
- Table 47: Global Automotive Dashboard Market Revenue Million Forecast, by Vehicle Type 2019 & 2032
- Table 48: Global Automotive Dashboard Market Revenue Million Forecast, by Sales Channel 2019 & 2032
- Table 49: Global Automotive Dashboard Market Revenue Million Forecast, by Country 2019 & 2032
- Table 50: India Automotive Dashboard Market Revenue (Million) Forecast, by Application 2019 & 2032
- Table 51: China Automotive Dashboard Market Revenue (Million) Forecast, by Application 2019 & 2032
- Table 52: Japan Automotive Dashboard Market Revenue (Million) Forecast, by Application 2019 & 2032
- Table 53: Rest of Asia Pacific Automotive Dashboard Market Revenue (Million) Forecast, by Application 2019 & 2032
- Table 54: Global Automotive Dashboard Market Revenue Million Forecast, by Type 2019 & 2032
- Table 55: Global Automotive Dashboard Market Revenue Million Forecast, by Vehicle Type 2019 & 2032
- Table 56: Global Automotive Dashboard Market Revenue Million Forecast, by Sales Channel 2019 & 2032
- Table 57: Global Automotive Dashboard Market Revenue Million Forecast, by Country 2019 & 2032
- Table 58: Brazil Automotive Dashboard Market Revenue (Million) Forecast, by Application 2019 & 2032
- Table 59: Argentina Automotive Dashboard Market Revenue (Million) Forecast, by Application 2019 & 2032
- Table 60: Rest of South America Automotive Dashboard Market Revenue (Million) Forecast, by Application 2019 & 2032
- Table 61: Global Automotive Dashboard Market Revenue Million Forecast, by Type 2019 & 2032
- Table 62: Global Automotive Dashboard Market Revenue Million Forecast, by Vehicle Type 2019 & 2032
- Table 63: Global Automotive Dashboard Market Revenue Million Forecast, by Sales Channel 2019 & 2032
- Table 64: Global Automotive Dashboard Market Revenue Million Forecast, by Country 2019 & 2032
- Table 65: Global Automotive Dashboard Market Revenue Million Forecast, by Type 2019 & 2032
- Table 66: Global Automotive Dashboard Market Revenue Million Forecast, by Vehicle Type 2019 & 2032
- Table 67: Global Automotive Dashboard Market Revenue Million Forecast, by Sales Channel 2019 & 2032
- Table 68: Global Automotive Dashboard Market Revenue Million Forecast, by Country 2019 & 2032
- Table 69: Saudi Arabia Automotive Dashboard Market Revenue (Million) Forecast, by Application 2019 & 2032
- Table 70: Rest of Middle East Automotive Dashboard Market Revenue (Million) Forecast, by Application 2019 & 2032
Frequently Asked Questions
1. What is the projected Compound Annual Growth Rate (CAGR) of the Automotive Dashboard Market?
The projected CAGR is approximately > 7.00%.
2. Which companies are prominent players in the Automotive Dashboard Market?
Key companies in the market include ABB Ltd, Johnson Controls International PLC, Hainan Drinda Automotive Trim Co Ltd, Visteon Corporation, Fusioncharts, Dongfeng Electronic, Huayu Automotive Systems Co Ltd, Toyoda Gosei Co Ltd, IA, Faurecia SE.
3. What are the main segments of the Automotive Dashboard Market?
The market segments include Type, Vehicle Type, Sales Channel.
4. Can you provide details about the market size?
The market size is estimated to be USD XX Million as of 2022.
5. What are some drivers contributing to market growth?
Ease of Steering.
6. What are the notable trends driving market growth?
Technological Developments Creating Demand for LCD Dashboards.
7. Are there any restraints impacting market growth?
Cost and Price Sensitivity.
8. Can you provide examples of recent developments in the market?
N/A
9. What pricing options are available for accessing the report?
Pricing options include single-user, multi-user, and enterprise licenses priced at USD 4750, USD 5250, and USD 8750 respectively.
10. Is the market size provided in terms of value or volume?
The market size is provided in terms of value, measured in Million.
11. Are there any specific market keywords associated with the report?
Yes, the market keyword associated with the report is "Automotive Dashboard Market," which aids in identifying and referencing the specific market segment covered.
12. How do I determine which pricing option suits my needs best?
The pricing options vary based on user requirements and access needs. Individual users may opt for single-user licenses, while businesses requiring broader access may choose multi-user or enterprise licenses for cost-effective access to the report.
13. Are there any additional resources or data provided in the Automotive Dashboard Market report?
While the report offers comprehensive insights, it's advisable to review the specific contents or supplementary materials provided to ascertain if additional resources or data are available.
14. How can I stay updated on further developments or reports in the Automotive Dashboard Market?
To stay informed about further developments, trends, and reports in the Automotive Dashboard Market, consider subscribing to industry newsletters, following relevant companies and organizations, or regularly checking reputable industry news sources and publications.
Methodology
Step 1 - Identification of Relevant Samples Size from Population Database


Step 2 - Approaches for Defining Global Market Size (Value, Volume* & Price*)

Note*: In applicable scenarios
Step 3 - Data Sources
Primary Research
- Web Analytics
- Survey Reports
- Research Institute
- Latest Research Reports
- Opinion Leaders
Secondary Research
- Annual Reports
- White Paper
- Latest Press Release
- Industry Association
- Paid Database
- Investor Presentations

Step 4 - Data Triangulation
Involves using different sources of information in order to increase the validity of a study
These sources are likely to be stakeholders in a program - participants, other researchers, program staff, other community members, and so on.
Then we put all data in single framework & apply various statistical tools to find out the dynamic on the market.
During the analysis stage, feedback from the stakeholder groups would be compared to determine areas of agreement as well as areas of divergence
