

Key Insights
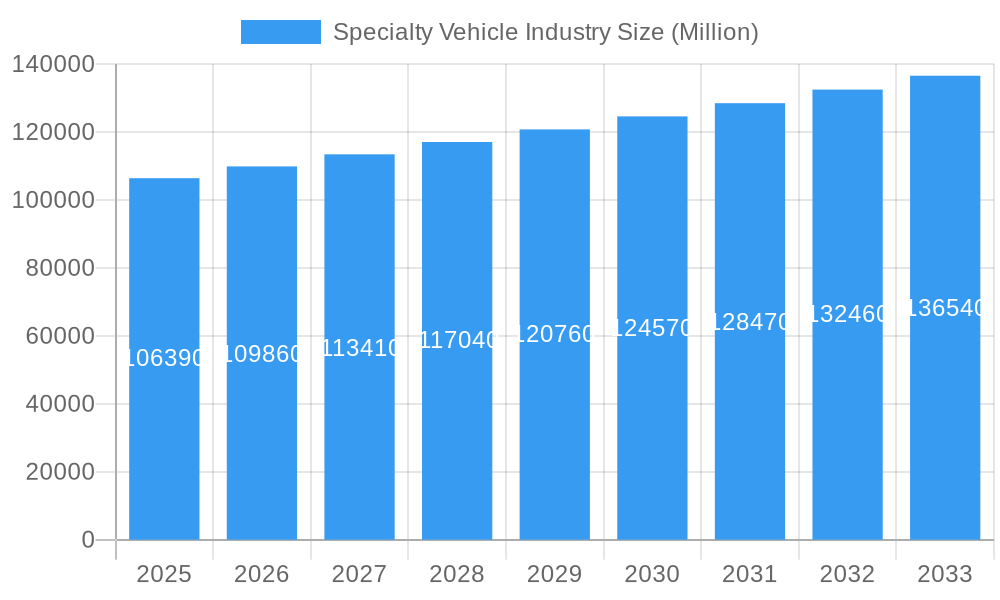
The global specialty vehicle market, valued at $106.39 billion in 2025, is projected to experience steady growth, driven by increasing demand for specialized transportation solutions across various sectors. This growth is expected to continue at a Compound Annual Growth Rate (CAGR) of 3.16% from 2025 to 2033. Key drivers include rising government investments in public safety infrastructure, particularly in North America and Europe, leading to increased demand for ambulances and fire extinguishing trucks. The burgeoning medical and healthcare sector, coupled with the expansion of emergency medical services (EMS), further fuels the growth of the ambulance segment. Moreover, the rising popularity of recreational vehicles (RVs) and the increasing need for efficient logistics in the transportation of fuel contributes significantly to market expansion. While regulatory hurdles and the fluctuating prices of raw materials pose some challenges, the overall outlook remains positive, particularly in rapidly developing economies in Asia-Pacific, where infrastructure development and economic growth create substantial opportunities for specialty vehicle manufacturers.
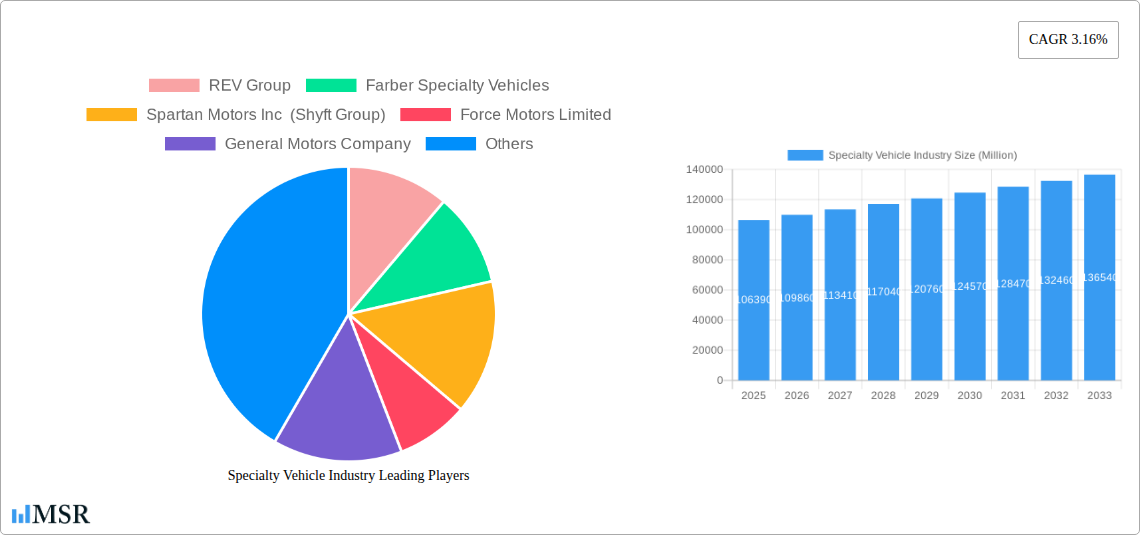
Specialty Vehicle Industry Market Size (In Billion)
The market segmentation reveals significant opportunities across different vehicle types and applications. Ambulances and fire extinguishing trucks dominate the "By Type" segment, reflecting the critical role of emergency services. The "By Application Type" segment showcases strong growth in law enforcement and public safety, driven by government spending and increasing urbanization. The medical and healthcare application type segment is also showing robust growth due to an aging global population. Competitive landscape analysis reveals key players such as REV Group, Oshkosh Corporation, and Daimler AG, all vying for market share through innovation, strategic partnerships, and expansion into emerging markets. Continuous technological advancements, focusing on enhanced safety features, fuel efficiency, and advanced telematics, are reshaping the industry landscape, creating new avenues for growth and innovation in the coming years. Regional analysis suggests that North America and Europe currently hold the largest market share, but the Asia-Pacific region is poised for significant growth in the coming decade due to its expanding economy and infrastructure development initiatives.
Specialty Vehicle Industry Company Market Share
Specialty Vehicle Industry Market Report: 2019-2033 Forecast
This comprehensive report provides a detailed analysis of the global specialty vehicle industry, projecting a market valued at $XX Million by 2033. The report covers key market segments, leading players like REV Group, Spartan Motors Inc (Shyft Group), and Daimler AG, and emerging trends shaping the future of this dynamic sector. Benefit from actionable insights to inform your strategic decisions and gain a competitive edge.
Specialty Vehicle Industry Market Concentration & Dynamics
The specialty vehicle market is characterized by a moderately concentrated landscape, with a few major players holding significant market share. However, the presence of numerous smaller niche players creates a dynamic competitive environment. Market concentration is further influenced by regional variations, with some regions exhibiting higher levels of consolidation than others.
- Market Share: Top 5 players hold an estimated xx% market share in 2025, while the remaining share is distributed across numerous smaller companies.
- Innovation Ecosystems: The industry witnesses continuous innovation driven by technological advancements in areas such as electrification, automation, and connectivity. Collaborative partnerships between OEMs and technology providers are common.
- Regulatory Frameworks: Stringent safety and emission regulations significantly impact product development and market access. Compliance with these regulations is a major cost factor for manufacturers.
- Substitute Products: Limited direct substitutes exist, but alternative transportation solutions and service models could potentially impact market growth in specific segments.
- End-User Trends: Growing demand for specialized vehicles driven by factors like increasing urbanization, improving healthcare infrastructure, and enhanced public safety initiatives is a key market driver.
- M&A Activities: The industry has seen a moderate number of mergers and acquisitions (M&A) in recent years (xx deals between 2019-2024), mainly focused on expanding product portfolios and geographic reach.
Specialty Vehicle Industry Industry Insights & Trends
The global specialty vehicle market is experiencing robust growth, projected to reach $XX Million by 2033, exhibiting a CAGR of xx% during the forecast period (2025-2033). This growth is fueled by several key factors:
The market size in 2025 is estimated at $XX Million. Several factors contribute to this growth trajectory. Firstly, the increasing demand for specialized vehicles across diverse applications, like ambulances, fire trucks, and recreational vehicles, significantly impacts market expansion. Secondly, technological advancements in areas such as electric powertrains and autonomous driving systems are creating new opportunities and driving innovation within the sector. Thirdly, evolving consumer preferences toward enhanced safety, comfort, and sustainability are shaping product development and market trends. Government initiatives promoting infrastructure development and public safety further contribute to the overall market growth.
Key Markets & Segments Leading Specialty Vehicle Industry
The North American market holds a dominant position in the global specialty vehicle industry, followed by Europe and Asia-Pacific. Within segments:
- By Type: Ambulances represent a significant portion of the market, driven by the growing healthcare sector and rising demand for advanced emergency medical services. Fire extinguishing trucks are another major segment, fueled by increasing urbanization and the need for efficient firefighting capabilities. Mobile fuel carrying tankers also contribute substantially, driven by the energy sector's needs.
- By Application Type: Law enforcement and public safety are major application areas, requiring specialized vehicles for various operations. The medical and healthcare segment shows high growth potential due to expanding healthcare infrastructure and increasing demand for advanced medical transportation. Recreational vehicles represent a substantial consumer-driven market segment.
Drivers for Dominant Regions/Segments:
- North America: Strong economic growth, robust infrastructure, and high adoption of advanced technologies.
- Ambulances: Growing geriatric population, improved healthcare infrastructure, and increasing demand for efficient emergency medical services.
- Law Enforcement & Public Safety: Rising crime rates and the need for advanced security solutions in various regions.
Specialty Vehicle Industry Product Developments
Recent years have witnessed significant advancements in specialty vehicle technology. Electric and hybrid powertrains are gaining traction, driven by environmental concerns and fuel efficiency. Autonomous driving features are being integrated into certain models, enhancing safety and operational efficiency. Advanced safety systems, improved ergonomics, and enhanced connectivity features are also becoming increasingly prevalent, improving the overall user experience and operational capabilities. These technological advancements are creating a competitive advantage for manufacturers who can offer innovative and superior products.
Challenges in the Specialty Vehicle Industry Market
Several challenges hinder market growth. Stringent regulatory compliance requirements pose a significant hurdle for manufacturers, increasing production costs and complexity. Supply chain disruptions, particularly regarding specialized components, can impact production timelines and profitability. Intense competition among established players and emerging entrants creates pricing pressures and necessitates continuous innovation. Furthermore, economic downturns can dampen demand, especially in segments like recreational vehicles.
Forces Driving Specialty Vehicle Industry Growth
Several factors contribute to long-term growth. Technological advancements, such as electrification and automation, are transforming the industry, offering opportunities for increased efficiency and sustainability. Economic growth in developing nations fuels demand for specialized vehicles across various sectors. Favorable government policies and initiatives supporting public safety and infrastructure development create favorable market conditions.
Challenges in the Specialty Vehicle Industry Market
Long-term growth relies on continued technological innovation, strategic partnerships to access new markets and technologies, and expansion into emerging economies. The development of sustainable and environmentally friendly vehicles will be crucial for long-term success. Focus on providing customized solutions to meet specific user needs will ensure market competitiveness.
Emerging Opportunities in Specialty Vehicle Industry
Several opportunities exist. The growing demand for electric and autonomous specialty vehicles presents a significant market opportunity. Expansion into emerging markets with growing infrastructure needs offers substantial potential. Developing specialized vehicles for niche applications, such as disaster relief or specialized transportation, can unlock new revenue streams. The incorporation of advanced technologies, such as telematics and IoT connectivity, adds value and improves vehicle utilization.
Leading Players in the Specialty Vehicle Industry Sector
- REV Group
- Farber Specialty Vehicles
- Spartan Motors Inc (Shyft Group)
- Force Motors Limited
- General Motors Company
- Specialty Vehicles Inc
- Daimler AG
- Volvo Group
- Emergency One Group
- Matthews Specialty Vehicles Inc
- LDV Inc
- Oshkosh Corporation
Key Milestones in Specialty Vehicle Industry Industry
- June 2022: Minsk Automobile Plant (MAZ) launched the MAZ minibus line, including the MAZ-365022, adaptable for ambulance use. This expands options for ambulance providers.
- March 2021: Mercedes-Benz Vans electrified its ambulance vehicles using the eSprinter, showcasing a move towards sustainable solutions in the healthcare sector.
- March 2021: Falck and MAN Truck & Bus signed a master agreement for ambulances and patient transport, signifying significant partnerships driving market growth.
Strategic Outlook for Specialty Vehicle Industry Market
The specialty vehicle market presents a strong outlook, driven by technological advancements, evolving consumer preferences, and increasing government investments in infrastructure. Strategic focus should be on innovation, sustainability, and strategic partnerships to capitalize on the growth opportunities across various segments and regions. Expansion into emerging markets and development of customized solutions for specialized needs will be critical for long-term success.
Specialty Vehicle Industry Segmentation
-
1. Type
- 1.1. Ambulances
- 1.2. Fire Extinguishing Trucks
- 1.3. Mobile Fuel Carrying Tankers
- 1.4. Other Types
-
2. Application Type
- 2.1. Law Enforcement And Public Safety
- 2.2. Medical And Healthcare
- 2.3. Recreational Vehicles
- 2.4. Other Services
Specialty Vehicle Industry Segmentation By Geography
-
1. North America
- 1.1. United States
- 1.2. Canada
- 1.3. Rest of North America
-
2. Europe
- 2.1. Germany
- 2.2. United Kingdom
- 2.3. France
- 2.4. Rest of Europe
-
3. Asia Pacific
- 3.1. China
- 3.2. India
- 3.3. Japan
- 3.4. South Korea
- 3.5. Rest of Asia Pacific
-
4. Rest of the World
- 4.1. South America
- 4.2. Middle East and Africa
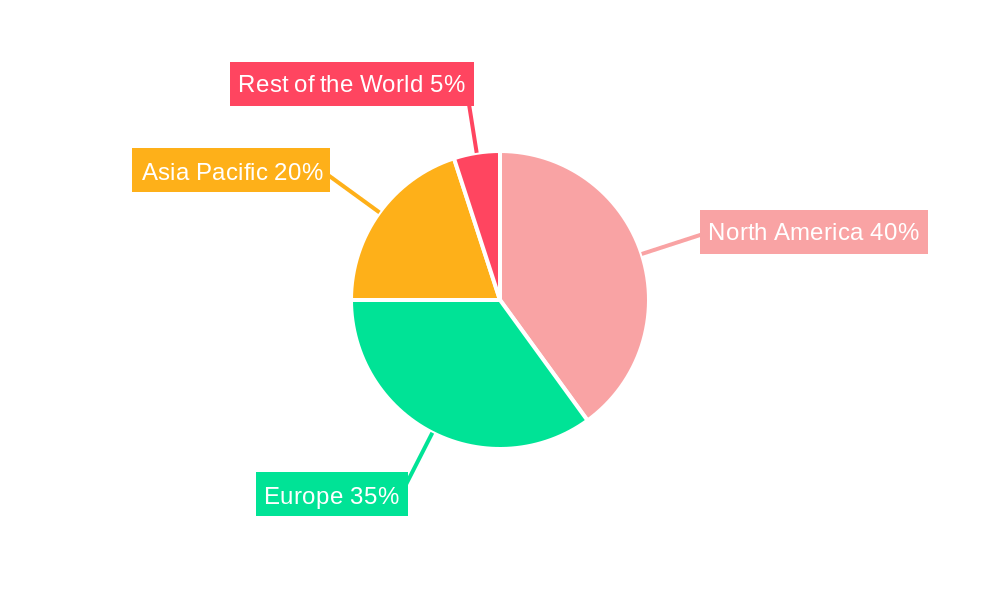
Specialty Vehicle Industry Regional Market Share
Geographic Coverage of Specialty Vehicle Industry
Specialty Vehicle Industry REPORT HIGHLIGHTS
| Aspects | Details |
|---|---|
| Study Period | 2020-2034 |
| Base Year | 2025 |
| Estimated Year | 2026 |
| Forecast Period | 2026-2034 |
| Historical Period | 2020-2025 |
| Growth Rate | CAGR of 3.16% from 2020-2034 |
| Segmentation |
|
Table of Contents
- 1. Introduction
- 1.1. Research Scope
- 1.2. Market Segmentation
- 1.3. Research Objective
- 1.4. Definitions and Assumptions
- 2. Executive Summary
- 2.1. Market Snapshot
- 3. Market Dynamics
- 3.1. Market Drivers
- 3.2. Market Restrains
- 3.3. Market Trends
- 3.4. Market Opportunities
- 4. Market Factor Analysis
- 4.1. Porters Five Forces
- 4.1.1. Bargaining Power of Suppliers
- 4.1.2. Bargaining Power of Buyers
- 4.1.3. Threat of New Entrants
- 4.1.4. Threat of Substitutes
- 4.1.5. Competitive Rivalry
- 4.2. PESTEL analysis
- 4.3. BCG Analysis
- 4.3.1. Stars (High Growth, High Market Share)
- 4.3.2. Cash Cows (Low Growth, High Market Share)
- 4.3.3. Question Mark (High Growth, Low Market Share)
- 4.3.4. Dogs (Low Growth, Low Market Share)
- 4.4. Ansoff Matrix Analysis
- 4.5. Supply Chain Analysis
- 4.6. Regulatory Landscape
- 4.7. Current Market Potential and Opportunity Assessment (TAM–SAM–SOM Framework)
- 4.8. MSR Analyst Note
- 4.1. Porters Five Forces
- 5. Market Analysis, Insights and Forecast 2021-2033
- 5.1. Market Analysis, Insights and Forecast - by Type
- 5.1.1. Ambulances
- 5.1.2. Fire Extinguishing Trucks
- 5.1.3. Mobile Fuel Carrying Tankers
- 5.1.4. Other Types
- 5.2. Market Analysis, Insights and Forecast - by Application Type
- 5.2.1. Law Enforcement And Public Safety
- 5.2.2. Medical And Healthcare
- 5.2.3. Recreational Vehicles
- 5.2.4. Other Services
- 5.3. Market Analysis, Insights and Forecast - by Region
- 5.3.1. North America
- 5.3.2. Europe
- 5.3.3. Asia Pacific
- 5.3.4. Rest of the World
- 5.1. Market Analysis, Insights and Forecast - by Type
- 6. Global Specialty Vehicle Industry Analysis, Insights and Forecast, 2021-2033
- 6.1. Market Analysis, Insights and Forecast - by Type
- 6.1.1. Ambulances
- 6.1.2. Fire Extinguishing Trucks
- 6.1.3. Mobile Fuel Carrying Tankers
- 6.1.4. Other Types
- 6.2. Market Analysis, Insights and Forecast - by Application Type
- 6.2.1. Law Enforcement And Public Safety
- 6.2.2. Medical And Healthcare
- 6.2.3. Recreational Vehicles
- 6.2.4. Other Services
- 6.1. Market Analysis, Insights and Forecast - by Type
- 7. North America Specialty Vehicle Industry Analysis, Insights and Forecast, 2020-2032
- 7.1. Market Analysis, Insights and Forecast - by Type
- 7.1.1. Ambulances
- 7.1.2. Fire Extinguishing Trucks
- 7.1.3. Mobile Fuel Carrying Tankers
- 7.1.4. Other Types
- 7.2. Market Analysis, Insights and Forecast - by Application Type
- 7.2.1. Law Enforcement And Public Safety
- 7.2.2. Medical And Healthcare
- 7.2.3. Recreational Vehicles
- 7.2.4. Other Services
- 7.1. Market Analysis, Insights and Forecast - by Type
- 8. Europe Specialty Vehicle Industry Analysis, Insights and Forecast, 2020-2032
- 8.1. Market Analysis, Insights and Forecast - by Type
- 8.1.1. Ambulances
- 8.1.2. Fire Extinguishing Trucks
- 8.1.3. Mobile Fuel Carrying Tankers
- 8.1.4. Other Types
- 8.2. Market Analysis, Insights and Forecast - by Application Type
- 8.2.1. Law Enforcement And Public Safety
- 8.2.2. Medical And Healthcare
- 8.2.3. Recreational Vehicles
- 8.2.4. Other Services
- 8.1. Market Analysis, Insights and Forecast - by Type
- 9. Asia Pacific Specialty Vehicle Industry Analysis, Insights and Forecast, 2020-2032
- 9.1. Market Analysis, Insights and Forecast - by Type
- 9.1.1. Ambulances
- 9.1.2. Fire Extinguishing Trucks
- 9.1.3. Mobile Fuel Carrying Tankers
- 9.1.4. Other Types
- 9.2. Market Analysis, Insights and Forecast - by Application Type
- 9.2.1. Law Enforcement And Public Safety
- 9.2.2. Medical And Healthcare
- 9.2.3. Recreational Vehicles
- 9.2.4. Other Services
- 9.1. Market Analysis, Insights and Forecast - by Type
- 10. Rest of the World Specialty Vehicle Industry Analysis, Insights and Forecast, 2020-2032
- 10.1. Market Analysis, Insights and Forecast - by Type
- 10.1.1. Ambulances
- 10.1.2. Fire Extinguishing Trucks
- 10.1.3. Mobile Fuel Carrying Tankers
- 10.1.4. Other Types
- 10.2. Market Analysis, Insights and Forecast - by Application Type
- 10.2.1. Law Enforcement And Public Safety
- 10.2.2. Medical And Healthcare
- 10.2.3. Recreational Vehicles
- 10.2.4. Other Services
- 10.1. Market Analysis, Insights and Forecast - by Type
- 11. Competitive Analysis
- 11.1. Company Profiles
- 11.1.1 REV Group
- 11.1.1.1. Company Overview
- 11.1.1.2. Products
- 11.1.1.3. Company Financials
- 11.1.1.4. SWOT Analysis
- 11.1.2 Farber Specialty Vehicles
- 11.1.2.1. Company Overview
- 11.1.2.2. Products
- 11.1.2.3. Company Financials
- 11.1.2.4. SWOT Analysis
- 11.1.3 Spartan Motors Inc (Shyft Group)
- 11.1.3.1. Company Overview
- 11.1.3.2. Products
- 11.1.3.3. Company Financials
- 11.1.3.4. SWOT Analysis
- 11.1.4 Force Motors Limited
- 11.1.4.1. Company Overview
- 11.1.4.2. Products
- 11.1.4.3. Company Financials
- 11.1.4.4. SWOT Analysis
- 11.1.5 General Motors Company
- 11.1.5.1. Company Overview
- 11.1.5.2. Products
- 11.1.5.3. Company Financials
- 11.1.5.4. SWOT Analysis
- 11.1.6 Specialty Vehicles Inc
- 11.1.6.1. Company Overview
- 11.1.6.2. Products
- 11.1.6.3. Company Financials
- 11.1.6.4. SWOT Analysis
- 11.1.7 Daimler AG
- 11.1.7.1. Company Overview
- 11.1.7.2. Products
- 11.1.7.3. Company Financials
- 11.1.7.4. SWOT Analysis
- 11.1.8 Volvo Group
- 11.1.8.1. Company Overview
- 11.1.8.2. Products
- 11.1.8.3. Company Financials
- 11.1.8.4. SWOT Analysis
- 11.1.9 Emergency One Group
- 11.1.9.1. Company Overview
- 11.1.9.2. Products
- 11.1.9.3. Company Financials
- 11.1.9.4. SWOT Analysis
- 11.1.10 Matthews Specialty Vehicles Inc
- 11.1.10.1. Company Overview
- 11.1.10.2. Products
- 11.1.10.3. Company Financials
- 11.1.10.4. SWOT Analysis
- 11.1.11 LDV Inc
- 11.1.11.1. Company Overview
- 11.1.11.2. Products
- 11.1.11.3. Company Financials
- 11.1.11.4. SWOT Analysis
- 11.1.12 Oshkosh Corporatio
- 11.1.12.1. Company Overview
- 11.1.12.2. Products
- 11.1.12.3. Company Financials
- 11.1.12.4. SWOT Analysis
- 11.1.1 REV Group
- 11.2. Market Entropy
- 11.2.1 Company's Key Areas Served
- 11.2.2 Recent Developments
- 11.3. Company Market Share Analysis 2025
- 11.3.1 Top 5 Companies Market Share Analysis
- 11.3.2 Top 3 Companies Market Share Analysis
- 11.4. List of Potential Customers
- 12. Research Methodology
List of Figures
- Figure 1: Global Specialty Vehicle Industry Revenue Breakdown (Million, %) by Region 2025 & 2033
- Figure 2: North America Specialty Vehicle Industry Revenue (Million), by Type 2025 & 2033
- Figure 3: North America Specialty Vehicle Industry Revenue Share (%), by Type 2025 & 2033
- Figure 4: North America Specialty Vehicle Industry Revenue (Million), by Application Type 2025 & 2033
- Figure 5: North America Specialty Vehicle Industry Revenue Share (%), by Application Type 2025 & 2033
- Figure 6: North America Specialty Vehicle Industry Revenue (Million), by Country 2025 & 2033
- Figure 7: North America Specialty Vehicle Industry Revenue Share (%), by Country 2025 & 2033
- Figure 8: Europe Specialty Vehicle Industry Revenue (Million), by Type 2025 & 2033
- Figure 9: Europe Specialty Vehicle Industry Revenue Share (%), by Type 2025 & 2033
- Figure 10: Europe Specialty Vehicle Industry Revenue (Million), by Application Type 2025 & 2033
- Figure 11: Europe Specialty Vehicle Industry Revenue Share (%), by Application Type 2025 & 2033
- Figure 12: Europe Specialty Vehicle Industry Revenue (Million), by Country 2025 & 2033
- Figure 13: Europe Specialty Vehicle Industry Revenue Share (%), by Country 2025 & 2033
- Figure 14: Asia Pacific Specialty Vehicle Industry Revenue (Million), by Type 2025 & 2033
- Figure 15: Asia Pacific Specialty Vehicle Industry Revenue Share (%), by Type 2025 & 2033
- Figure 16: Asia Pacific Specialty Vehicle Industry Revenue (Million), by Application Type 2025 & 2033
- Figure 17: Asia Pacific Specialty Vehicle Industry Revenue Share (%), by Application Type 2025 & 2033
- Figure 18: Asia Pacific Specialty Vehicle Industry Revenue (Million), by Country 2025 & 2033
- Figure 19: Asia Pacific Specialty Vehicle Industry Revenue Share (%), by Country 2025 & 2033
- Figure 20: Rest of the World Specialty Vehicle Industry Revenue (Million), by Type 2025 & 2033
- Figure 21: Rest of the World Specialty Vehicle Industry Revenue Share (%), by Type 2025 & 2033
- Figure 22: Rest of the World Specialty Vehicle Industry Revenue (Million), by Application Type 2025 & 2033
- Figure 23: Rest of the World Specialty Vehicle Industry Revenue Share (%), by Application Type 2025 & 2033
- Figure 24: Rest of the World Specialty Vehicle Industry Revenue (Million), by Country 2025 & 2033
- Figure 25: Rest of the World Specialty Vehicle Industry Revenue Share (%), by Country 2025 & 2033
List of Tables
- Table 1: Global Specialty Vehicle Industry Revenue Million Forecast, by Type 2020 & 2033
- Table 2: Global Specialty Vehicle Industry Revenue Million Forecast, by Application Type 2020 & 2033
- Table 3: Global Specialty Vehicle Industry Revenue Million Forecast, by Region 2020 & 2033
- Table 4: Global Specialty Vehicle Industry Revenue Million Forecast, by Type 2020 & 2033
- Table 5: Global Specialty Vehicle Industry Revenue Million Forecast, by Application Type 2020 & 2033
- Table 6: Global Specialty Vehicle Industry Revenue Million Forecast, by Country 2020 & 2033
- Table 7: United States Specialty Vehicle Industry Revenue (Million) Forecast, by Application 2020 & 2033
- Table 8: Canada Specialty Vehicle Industry Revenue (Million) Forecast, by Application 2020 & 2033
- Table 9: Rest of North America Specialty Vehicle Industry Revenue (Million) Forecast, by Application 2020 & 2033
- Table 10: Global Specialty Vehicle Industry Revenue Million Forecast, by Type 2020 & 2033
- Table 11: Global Specialty Vehicle Industry Revenue Million Forecast, by Application Type 2020 & 2033
- Table 12: Global Specialty Vehicle Industry Revenue Million Forecast, by Country 2020 & 2033
- Table 13: Germany Specialty Vehicle Industry Revenue (Million) Forecast, by Application 2020 & 2033
- Table 14: United Kingdom Specialty Vehicle Industry Revenue (Million) Forecast, by Application 2020 & 2033
- Table 15: France Specialty Vehicle Industry Revenue (Million) Forecast, by Application 2020 & 2033
- Table 16: Rest of Europe Specialty Vehicle Industry Revenue (Million) Forecast, by Application 2020 & 2033
- Table 17: Global Specialty Vehicle Industry Revenue Million Forecast, by Type 2020 & 2033
- Table 18: Global Specialty Vehicle Industry Revenue Million Forecast, by Application Type 2020 & 2033
- Table 19: Global Specialty Vehicle Industry Revenue Million Forecast, by Country 2020 & 2033
- Table 20: China Specialty Vehicle Industry Revenue (Million) Forecast, by Application 2020 & 2033
- Table 21: India Specialty Vehicle Industry Revenue (Million) Forecast, by Application 2020 & 2033
- Table 22: Japan Specialty Vehicle Industry Revenue (Million) Forecast, by Application 2020 & 2033
- Table 23: South Korea Specialty Vehicle Industry Revenue (Million) Forecast, by Application 2020 & 2033
- Table 24: Rest of Asia Pacific Specialty Vehicle Industry Revenue (Million) Forecast, by Application 2020 & 2033
- Table 25: Global Specialty Vehicle Industry Revenue Million Forecast, by Type 2020 & 2033
- Table 26: Global Specialty Vehicle Industry Revenue Million Forecast, by Application Type 2020 & 2033
- Table 27: Global Specialty Vehicle Industry Revenue Million Forecast, by Country 2020 & 2033
- Table 28: South America Specialty Vehicle Industry Revenue (Million) Forecast, by Application 2020 & 2033
- Table 29: Middle East and Africa Specialty Vehicle Industry Revenue (Million) Forecast, by Application 2020 & 2033
Frequently Asked Questions
1. What is the projected Compound Annual Growth Rate (CAGR) of the Specialty Vehicle Industry?
The projected CAGR is approximately 3.16%.
2. Which companies are prominent players in the Specialty Vehicle Industry?
Key companies in the market include REV Group, Farber Specialty Vehicles, Spartan Motors Inc (Shyft Group), Force Motors Limited, General Motors Company, Specialty Vehicles Inc, Daimler AG, Volvo Group, Emergency One Group, Matthews Specialty Vehicles Inc, LDV Inc, Oshkosh Corporatio.
3. What are the main segments of the Specialty Vehicle Industry?
The market segments include Type, Application Type.
4. Can you provide details about the market size?
The market size is estimated to be USD 106.39 Million as of 2022.
5. What are some drivers contributing to market growth?
Rise in demand for Advanced Comfort Systems In Vehicles.
6. What are the notable trends driving market growth?
Increase in Spending on Law Enforcement and Healthcare Facilities.
7. Are there any restraints impacting market growth?
High Cost Assoicated with Advanced Features.
8. Can you provide examples of recent developments in the market?
Jun 2022: Minsk Automobile Plant (MAZ) announced the launch of the MAZ minibus line. New products MAZ-281040 and MAZ-365022 were introduced at the event. MAZ-365022 is a light-duty commercial vehicle. This vehicle can be used to transport anything from a manufactured goods van to an ambulance.
9. What pricing options are available for accessing the report?
Pricing options include single-user, multi-user, and enterprise licenses priced at USD 4750, USD 5250, and USD 8750 respectively.
10. Is the market size provided in terms of value or volume?
The market size is provided in terms of value, measured in Million.
11. Are there any specific market keywords associated with the report?
Yes, the market keyword associated with the report is "Specialty Vehicle Industry," which aids in identifying and referencing the specific market segment covered.
12. How do I determine which pricing option suits my needs best?
The pricing options vary based on user requirements and access needs. Individual users may opt for single-user licenses, while businesses requiring broader access may choose multi-user or enterprise licenses for cost-effective access to the report.
13. Are there any additional resources or data provided in the Specialty Vehicle Industry report?
While the report offers comprehensive insights, it's advisable to review the specific contents or supplementary materials provided to ascertain if additional resources or data are available.
14. How can I stay updated on further developments or reports in the Specialty Vehicle Industry?
To stay informed about further developments, trends, and reports in the Specialty Vehicle Industry, consider subscribing to industry newsletters, following relevant companies and organizations, or regularly checking reputable industry news sources and publications.
Methodology
Step 1 - Identification of Relevant Samples Size from Population Database


Step 2 - Approaches for Defining Global Market Size (Value, Volume* & Price*)

Note*: In applicable scenarios
Step 3 - Data Sources
Primary Research
- Web Analytics
- Survey Reports
- Research Institute
- Latest Research Reports
- Opinion Leaders
Secondary Research
- Annual Reports
- White Paper
- Latest Press Release
- Industry Association
- Paid Database
- Investor Presentations

Step 4 - Data Triangulation
Involves using different sources of information in order to increase the validity of a study
These sources are likely to be stakeholders in a program - participants, other researchers, program staff, other community members, and so on.
Then we put all data in single framework & apply various statistical tools to find out the dynamic on the market.
During the analysis stage, feedback from the stakeholder groups would be compared to determine areas of agreement as well as areas of divergence