

Key Insights
The Asia Pacific (APAC) electric bus market is poised for remarkable expansion, driven by a confluence of governmental initiatives, increasing environmental consciousness, and the pursuit of sustainable urban transportation solutions. With a current market size estimated at 44.74 million (representing the value in millions for the base year of 2025), the region is experiencing a significant shift towards electrified public transport. This transition is underpinned by aggressive policy frameworks and substantial investments from governments across key markets like China and India, which are actively promoting the adoption of zero-emission vehicles. Fleet operators are also increasingly recognizing the long-term operational cost benefits, including reduced fuel expenses and lower maintenance requirements, further accelerating the demand for electric buses. The market's trajectory is further bolstered by advancements in battery technology, leading to improved range and faster charging times, thus addressing previous concerns about the practicality of electric buses for extensive routes.
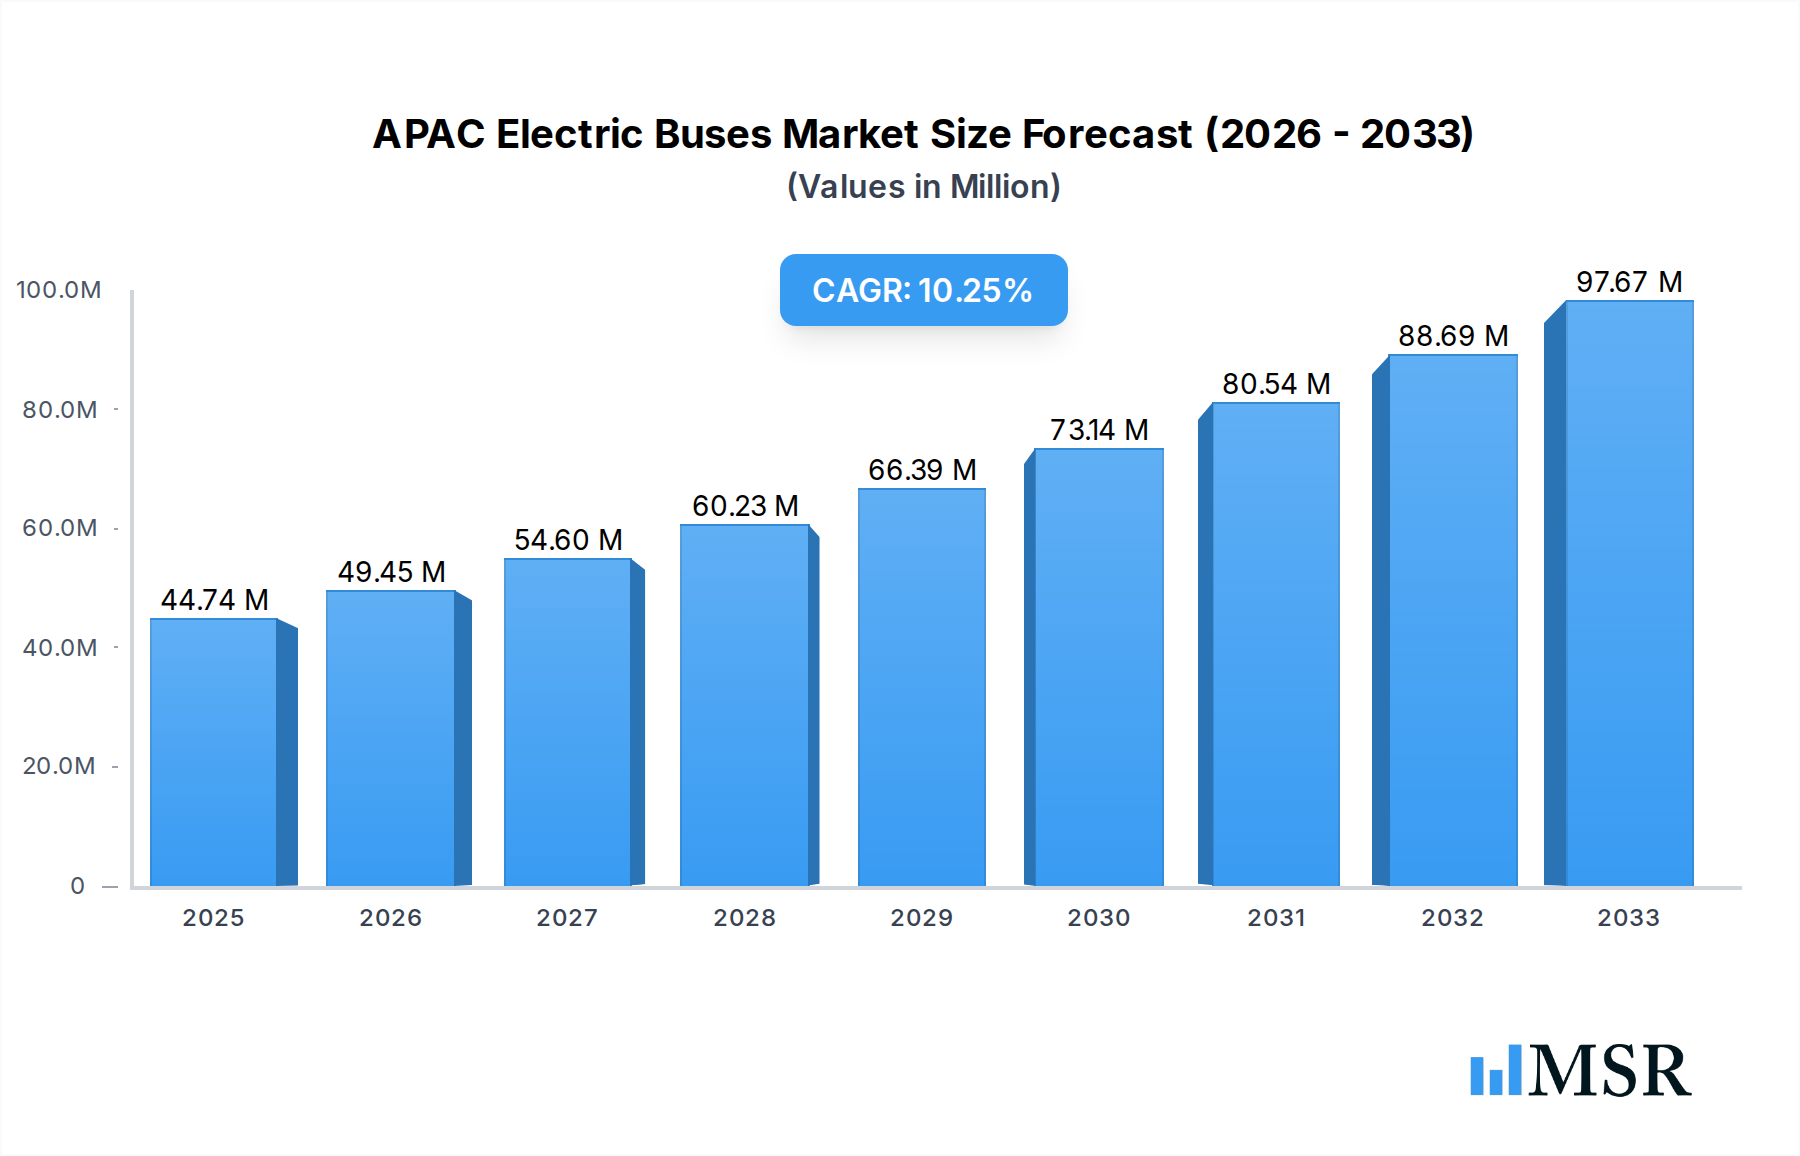
APAC Electric Buses Market Market Size (In Million)
The APAC electric bus market is projected to witness a robust Compound Annual Growth Rate (CAGR) of 10.55% over the forecast period of 2025-2033. This impressive growth is anticipated to be fueled by several key drivers, including stringent emission regulations, supportive government subsidies and incentives for electric bus procurement, and a growing emphasis on improving air quality in urban centers. The rising adoption of Battery Electric Buses (BEBs) and Plug-in Hybrid Electric Buses (PHEBs) across major economies within the APAC region, such as China, India, and increasingly Southeast Asian nations, highlights this trend. Major players like BYD, Tata Motors, and Anhui Ankai are at the forefront of this transformation, introducing innovative solutions and expanding their manufacturing capabilities to meet the burgeoning demand. While challenges such as high initial investment costs and the need for robust charging infrastructure development persist, the overarching commitment to sustainability and technological advancements within the region strongly positions the APAC electric bus market for sustained and significant growth.

APAC Electric Buses Market Company Market Share
APAC Electric Buses Market: Comprehensive Growth Analysis & Future Outlook (2019–2033)
Report Description: Dive deep into the burgeoning APAC Electric Buses Market with this comprehensive report. Uncover critical market insights, industry trends, and growth drivers shaping the future of electric mobility across the Asia-Pacific region. This analysis covers the Study Period of 2019–2033, with Base Year and Estimated Year at 2025, and a detailed Forecast Period from 2025–2033, building upon the Historical Period of 2019–2024. Essential for Government bodies, Fleet Operators, and industry stakeholders, this report provides actionable intelligence on Battery Electric Buses, Plug-in Hybrid Electric Buses, key Power Source components like DC/AC Inverter and E-Motor, and the competitive landscape. Discover market concentration, key player strategies, emerging opportunities, and the technological innovations driving the APAC electric buses market.
APAC Electric Buses Market Market Concentration & Dynamics
The APAC Electric Buses Market is characterized by moderate to high concentration, with leading global and regional players vying for significant market share. Innovation ecosystems are rapidly evolving, fueled by substantial government investments and stringent emission regulations. The regulatory frameworks across countries like China, India, and South Korea are increasingly supportive of electric bus adoption, offering subsidies and mandates. Substitute products, primarily traditional internal combustion engine (ICE) buses, are gradually losing ground as the TCO (Total Cost of Ownership) for electric buses becomes more competitive due to lower operating and maintenance costs. End-user trends indicate a strong preference for zero-emission public transportation solutions, driven by environmental consciousness and the need to combat urban air pollution. Mergers and Acquisitions (M&A) activities are on the rise as companies seek to consolidate their market position and expand their technological capabilities. For instance, recent M&A activities and strategic partnerships underscore a trend towards consolidation and vertical integration within the APAC electric buses market.
- Market Share Dynamics: Dominant players like BYD Auto Co. Limited and Yutong Bus Co., Ltd. hold significant market shares, particularly in China and other parts of Asia.
- Innovation Ecosystems: Growing R&D investments in battery technology, charging infrastructure, and vehicle performance are creating vibrant innovation hubs.
- Regulatory Frameworks: Favorable policies such as tax incentives, subsidies, and preferential procurement programs are accelerating market growth.
- Substitute Products: The increasing cost-effectiveness of electric buses over their ICE counterparts is leading to a decline in the demand for traditional buses.
- End-User Trends: Growing demand for sustainable urban mobility solutions from public transport authorities and private fleet operators.
- M&A Activities: Strategic alliances and acquisitions are observed as companies aim to enhance their product portfolios and expand their geographical reach within the APAC electric buses market.
APAC Electric Buses Market Industry Insights & Trends
The APAC Electric Buses Market is poised for exponential growth, projected to reach a market size of USD 35,500 Million by 2033, expanding at a Compound Annual Growth Rate (CAGR) of 18.50% during the Forecast Period (2025-2033). This robust growth is propelled by a confluence of factors including ambitious government targets for electric vehicle (EV) adoption, rising environmental concerns, and advancements in battery technology. China continues to dominate the market, driven by its early adoption and significant manufacturing capabilities. However, India is emerging as a high-potential market, with substantial government initiatives like the Faster Adoption and Manufacturing of Electric Vehicles (FAME) scheme, and significant orders being placed by city transport authorities. The demand for Battery Electric Buses (BEBs) is significantly higher than Plug-in Hybrid Electric Buses (PHEBs) due to their zero-emission capabilities and increasing battery range.
Technological disruptions are primarily focused on improving battery energy density, reducing charging times, and enhancing vehicle efficiency. The development of advanced Power Source components such as high-efficiency E-Motors, reliable DC/AC Inverters, and optimized DC/DC Converters are crucial for the performance and adoption of electric buses. The market is also witnessing innovation in charging infrastructure, with a growing emphasis on smart charging solutions and battery swapping technologies to address range anxiety and operational efficiency for Fleet Operators. Evolving consumer behaviors, driven by greater environmental awareness and a desire for cleaner urban environments, are compelling transport authorities to accelerate their transition to electric fleets. The APAC electric buses market is also experiencing a trend towards larger capacity buses and specialized vehicles catering to specific urban transport needs.
- Market Size & Growth: The APAC electric buses market is projected to reach USD 35,500 Million by 2033.
- CAGR: A significant CAGR of 18.50% is anticipated during the forecast period (2025-2033).
- Dominant Segments: Battery Electric Buses (BEBs) are the primary focus, driven by zero-emission mandates and improving battery performance.
- Key Drivers: Government support, environmental consciousness, TCO advantages, and technological advancements are key growth catalysts.
- Technological Advancements: Innovations in battery technology, charging infrastructure, and power electronics are reshaping the market.
- Consumer Behavior: Increasing demand for sustainable and efficient public transportation solutions.
- Regional Dominance: China leads the market, while India shows substantial growth potential.
Key Markets & Segments Leading APAC Electric Buses Market
The APAC Electric Buses Market is significantly led by the Battery Electric Bus (BEB) segment, which accounts for the majority of market share due to its zero-emission credentials and the increasing focus on sustainable public transportation. Within the Consumer segment, the Government is the predominant buyer, driving large-scale adoption through policy mandates, subsidies, and public procurement programs. Regions like China and India are spearheading the market's growth. China's extensive manufacturing capabilities and early government incentives have cemented its leadership position, with a vast installed base of electric buses. India, on the other hand, is experiencing rapid growth driven by ambitious targets and significant orders from state transport undertakings, making it a key market to watch in the APAC electric buses market.
The dominance of BEBs is attributed to the increasing feasibility of their operational range and decreasing battery costs. Governments worldwide are prioritizing the decarbonization of public transport fleets to combat air pollution and meet climate goals, making BEBs the preferred choice. Key drivers for the dominance of BEBs include:
- Environmental Regulations: Stringent emission standards and carbon neutrality targets are pushing governments towards zero-emission vehicles.
- Total Cost of Ownership (TCO): Lower running costs (electricity vs. fuel) and reduced maintenance expenses make BEBs economically attractive over their lifecycle.
- Technological Advancements: Improvements in battery technology, leading to longer ranges and faster charging times, have addressed earlier concerns.
- Government Subsidies and Incentives: Favorable policies, including direct subsidies, tax exemptions, and preferential tariffs, significantly reduce the upfront cost of BEBs.
In terms of Power Source components, the E-Motor is a critical element driving performance and efficiency. The development of advanced electric motors with higher power density and torque is crucial for the smooth operation of heavy-duty buses. Other components like DC/AC Inverters, DC/DC Converters, and AC/DC Chargers are also vital for the efficient conversion and management of electrical power, ensuring reliable operation and effective charging of the bus fleet. The Fleet Operators segment is also gaining prominence as they recognize the long-term economic and environmental benefits of transitioning to electric buses, investing in charging infrastructure and optimizing fleet management for electric vehicles.
APAC Electric Buses Market Product Developments
Product development in the APAC Electric Buses Market is characterized by a strong emphasis on enhancing battery technology for increased range and faster charging, alongside improvements in motor efficiency and overall vehicle performance. Innovations are also focused on reducing the weight of buses and optimizing energy consumption to extend operational capabilities. Leading manufacturers are introducing advanced thermal management systems for batteries to ensure optimal performance in varying climatic conditions across the APAC region. The integration of smart technologies, such as real-time monitoring and diagnostics, is also a key trend, enabling better fleet management and predictive maintenance for Fleet Operators. The development of specialized electric buses, including double-decker and articulated models, is catering to the diverse needs of urban public transportation systems, as seen with the EiV22 family from Switch Mobility.
Challenges in the APAC Electric Buses Market Market
Despite the robust growth trajectory, the APAC Electric Buses Market faces several challenges. High upfront costs of electric buses compared to traditional diesel buses remain a significant barrier, although TCO advantages are gradually offsetting this. The availability and reliability of charging infrastructure, especially in less developed urban or remote areas, pose a constraint. Battery production and supply chain disruptions, coupled with the sourcing of critical raw materials like lithium and cobalt, can impact production timelines and costs. Furthermore, the availability of skilled technicians for maintenance and repair of electric buses is also a growing concern. Regulatory inconsistencies across different countries within the APAC region can also create complexities for manufacturers and operators looking to scale their operations in the APAC electric buses market.
Forces Driving APAC Electric Buses Market Growth
Several forces are driving the rapid expansion of the APAC Electric Buses Market. Foremost among these are stringent government regulations and ambitious targets for emissions reduction and climate change mitigation. Growing environmental consciousness among the public and a desire for improved urban air quality are creating strong demand for cleaner transportation solutions. Technological advancements in battery energy density, charging speeds, and motor efficiency are making electric buses more viable and cost-effective. Furthermore, the declining cost of battery packs and the increasing availability of government subsidies and financial incentives are significantly reducing the total cost of ownership, making electric buses an attractive investment for Fleet Operators and public transport authorities.
Challenges in the APAC Electric Buses Market Market
Long-term growth catalysts for the APAC Electric Buses Market include ongoing advancements in battery technology, such as solid-state batteries, which promise higher energy density, faster charging, and enhanced safety. Strategic partnerships and collaborations between vehicle manufacturers, battery suppliers, and charging infrastructure providers are crucial for building a robust ecosystem. Market expansions into emerging economies within the APAC region, where urbanization is rapid and the need for sustainable transport is growing, present significant opportunities. The development of innovative business models, such as battery-as-a-service and integrated mobility solutions, will also play a vital role in accelerating the adoption of electric buses and ensuring sustained growth in the APAC electric buses market.
Emerging Opportunities in APAC Electric Buses Market
Emerging opportunities in the APAC Electric Buses Market are diverse and promising. The increasing adoption of electric buses in emerging markets like Southeast Asia and parts of South Asia presents significant untapped potential. The development of specialized electric bus applications, such as school buses, intercity coaches, and last-mile delivery vehicles, is creating new market niches. Furthermore, the integration of renewable energy sources with electric bus charging infrastructure offers a pathway to achieve truly zero-emission public transportation. The growth of smart city initiatives across the APAC region is also expected to drive demand for connected and autonomous electric buses, further enhancing the efficiency and sustainability of urban mobility. The focus on circular economy principles, including battery recycling and second-life applications, is also emerging as a key opportunity for the APAC electric buses market.
Leading Players in the APAC Electric Buses Market Sector
- Ashok Leyland Limited
- Scania AB
- Tata Motors Limited
- Volvo Group
- Nanjing Jiayuan EV
- King Long United Automotive Co Limited
- Zhongtong Bus Holding Co Limited
- BYD Auto Co Limited
- Anhui Ankai Automobile Industries Co Limited
- Olectra Greentech Ltd.
- CRRC Electric
Key Milestones in APAC Electric Buses Market Industry
- August 2022: Ashok Leyland's subsidiary Switch Mobility Ltd. secured an order to supply 200 air-conditioned electric double-decker buses from BEST in Mumbai, featuring the EiV22 family powered by a 231 kWh battery, replacing existing fossil fuel buses.
- August 2022: CAUSIS E-Mobility opened its office in Pune, India, following an October 2021 MoU with the Government of Maharashtra to establish a second electric bus manufacturing facility in Pune, and securing an order for 700 electric buses for BEST.
- May 2022: Olectra Greentech Ltd. secured an order to supply 2100 electric buses to BEST in Mumbai, valued at INR 3675 Million.
- August 2022: Switch Mobility Ltd. (Ashok Leyland Ltd.) won an order to supply 5000 electric buses to integrated Indian transport company Chalo, for deployment of Switch EiV12 electric buses.
- July 2022: Tata Motors Ltd. secured an order to supply 1500 electric buses to Delhi Transport Corporation (DTC), including operation and maintenance for 12 years.
- August 2022: Volvo Eicher joint venture VE Commercial Vehicles Ltd. established VE Electro Mobility, a subsidiary focused on electric buses for capital raising and expansion in electromobility.
- January 2022: CRRC Electric delivered 30 units of C11 electric buses (11 meters in length) to Seoul, South Korea.
- February 2022: Toyota, Isuzu, and Hino announced plans to launch their first jointly developed electric bus in Japan by 2024.
Strategic Outlook for APAC Electric Buses Market Market
The strategic outlook for the APAC Electric Buses Market is highly positive, with continued strong growth anticipated. Key growth accelerators include the ongoing advancements in battery technology, leading to greater range and faster charging capabilities, which directly address core adoption barriers. Strategic partnerships between global and regional players are expected to foster innovation and expand manufacturing capacities. The increasing commitment from governments across the APAC region to achieve net-zero emissions targets will continue to drive policy support and demand for electric buses. Furthermore, the expansion into newer, rapidly urbanizing markets within the APAC region presents significant untapped potential. The report forecasts a robust market expansion, driven by technological innovation, supportive regulatory environments, and evolving consumer preferences towards sustainable mobility solutions in the APAC electric buses market.
APAC Electric Buses Market Segmentation
-
1. Vehicle Type
- 1.1. Battery Electric Bus
- 1.2. Plug-in Hybrid Electric Bus
-
2. Power Source
- 2.1. DC/AC Inverter
- 2.2. DC/DC Converter
- 2.3. DC/DC Boost Converter
- 2.4. E-Motor
- 2.5. AC/DC Charger
- 2.6. Motor Controller
-
3. Consumer
- 3.1. Government
- 3.2. Fleet Operators
APAC Electric Buses Market Segmentation By Geography
-
1. North America
- 1.1. United States
- 1.2. Canada
- 1.3. Mexico
-
2. South America
- 2.1. Brazil
- 2.2. Argentina
- 2.3. Rest of South America
-
3. Europe
- 3.1. United Kingdom
- 3.2. Germany
- 3.3. France
- 3.4. Italy
- 3.5. Spain
- 3.6. Russia
- 3.7. Benelux
- 3.8. Nordics
- 3.9. Rest of Europe
-
4. Middle East & Africa
- 4.1. Turkey
- 4.2. Israel
- 4.3. GCC
- 4.4. North Africa
- 4.5. South Africa
- 4.6. Rest of Middle East & Africa
-
5. Asia Pacific
- 5.1. China
- 5.2. India
- 5.3. Japan
- 5.4. South Korea
- 5.5. ASEAN
- 5.6. Oceania
- 5.7. Rest of Asia Pacific
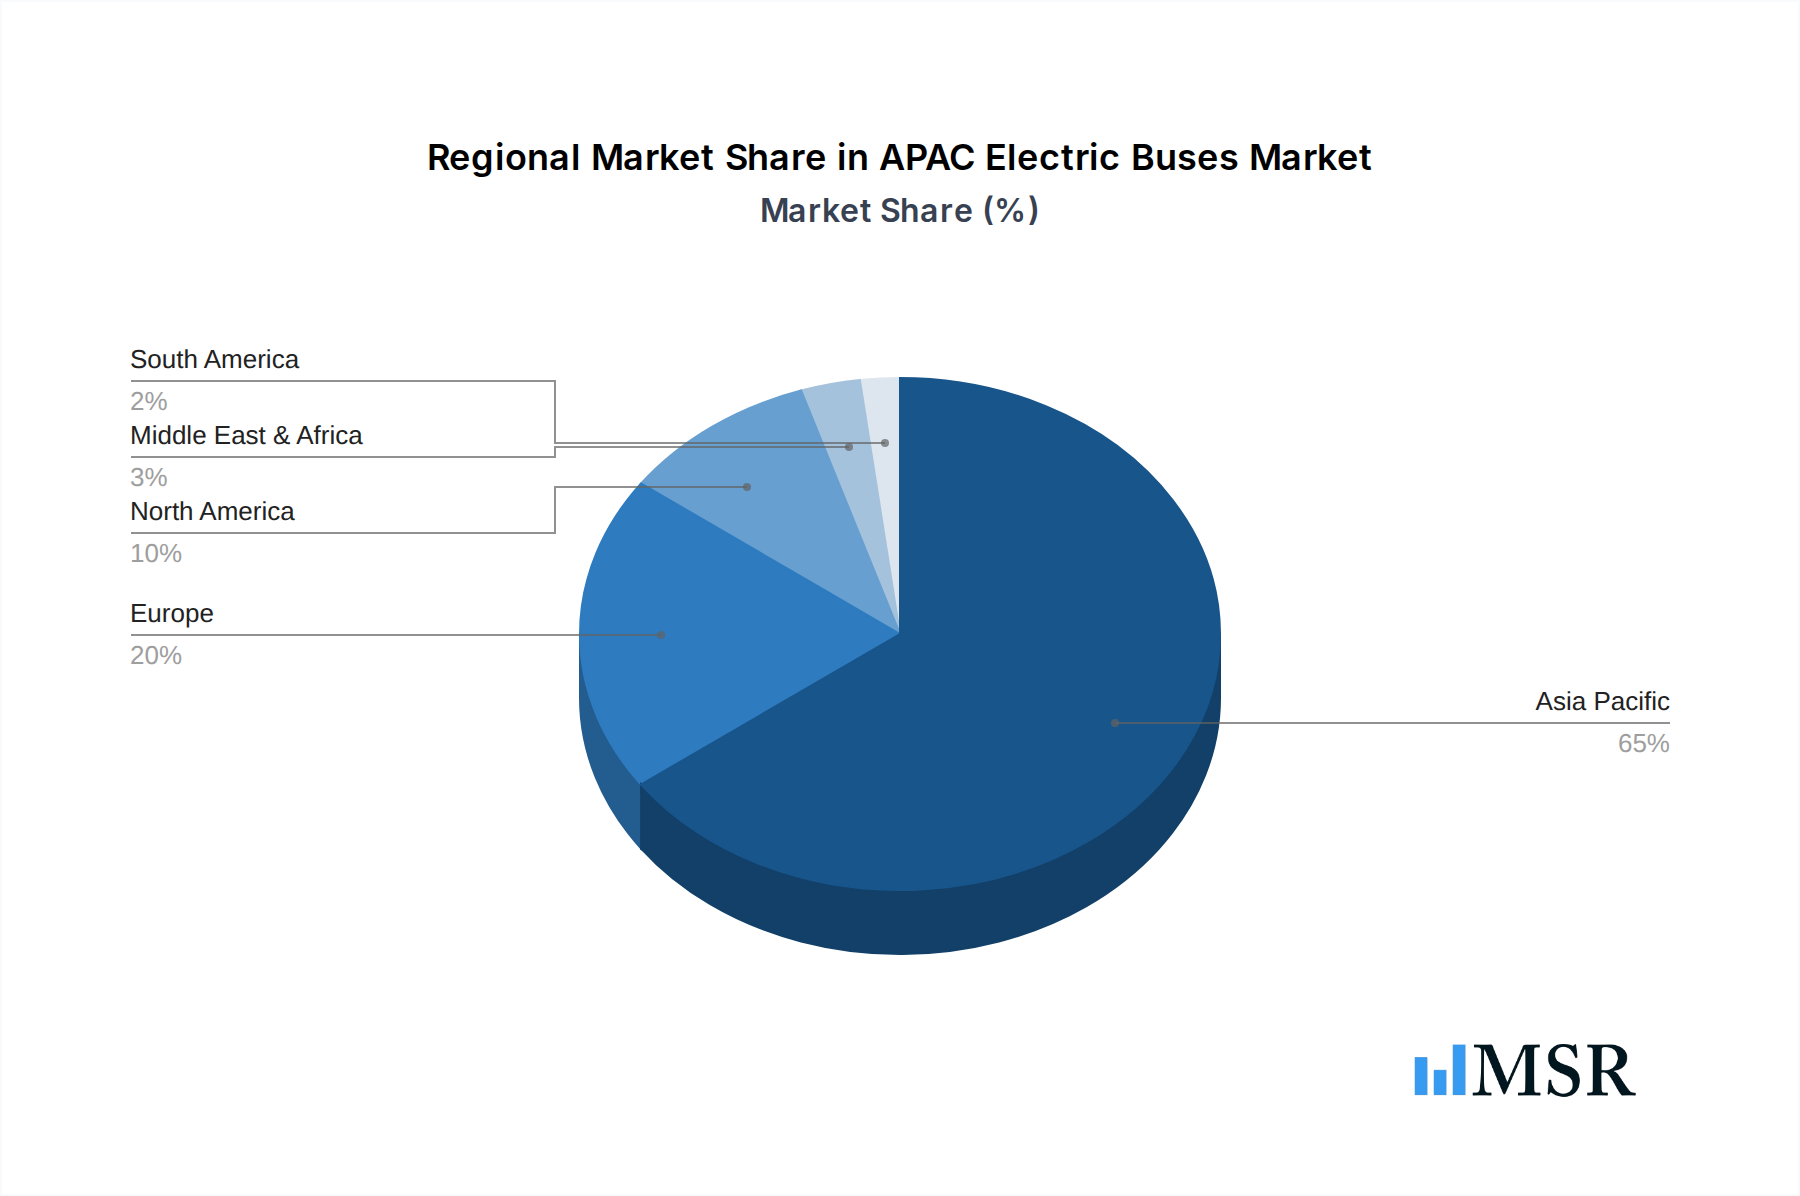
APAC Electric Buses Market Regional Market Share
Geographic Coverage of APAC Electric Buses Market
APAC Electric Buses Market REPORT HIGHLIGHTS
| Aspects | Details |
|---|---|
| Study Period | 2020-2034 |
| Base Year | 2025 |
| Estimated Year | 2026 |
| Forecast Period | 2026-2034 |
| Historical Period | 2020-2025 |
| Growth Rate | CAGR of 10.55% from 2020-2034 |
| Segmentation |
|
Table of Contents
- 1. Introduction
- 1.1. Research Scope
- 1.2. Market Segmentation
- 1.3. Research Objective
- 1.4. Definitions and Assumptions
- 2. Executive Summary
- 2.1. Market Snapshot
- 3. Market Dynamics
- 3.1. Market Drivers
- 3.2. Market Restrains
- 3.3. Market Trends
- 3.4. Market Opportunities
- 4. Market Factor Analysis
- 4.1. Porters Five Forces
- 4.1.1. Bargaining Power of Suppliers
- 4.1.2. Bargaining Power of Buyers
- 4.1.3. Threat of New Entrants
- 4.1.4. Threat of Substitutes
- 4.1.5. Competitive Rivalry
- 4.2. PESTEL analysis
- 4.3. BCG Analysis
- 4.3.1. Stars (High Growth, High Market Share)
- 4.3.2. Cash Cows (Low Growth, High Market Share)
- 4.3.3. Question Mark (High Growth, Low Market Share)
- 4.3.4. Dogs (Low Growth, Low Market Share)
- 4.4. Ansoff Matrix Analysis
- 4.5. Supply Chain Analysis
- 4.6. Regulatory Landscape
- 4.7. Current Market Potential and Opportunity Assessment (TAM–SAM–SOM Framework)
- 4.8. MSR Analyst Note
- 4.1. Porters Five Forces
- 5. Market Analysis, Insights and Forecast 2021-2033
- 5.1. Market Analysis, Insights and Forecast - by Vehicle Type
- 5.1.1. Battery Electric Bus
- 5.1.2. Plug-in Hybrid Electric Bus
- 5.2. Market Analysis, Insights and Forecast - by Power Source
- 5.2.1. DC/AC Inverter
- 5.2.2. DC/DC Converter
- 5.2.3. DC/DC Boost Converter
- 5.2.4. E-Motor
- 5.2.5. AC/DC Charger
- 5.2.6. Motor Controller
- 5.3. Market Analysis, Insights and Forecast - by Consumer
- 5.3.1. Government
- 5.3.2. Fleet Operators
- 5.4. Market Analysis, Insights and Forecast - by Region
- 5.4.1. North America
- 5.4.2. South America
- 5.4.3. Europe
- 5.4.4. Middle East & Africa
- 5.4.5. Asia Pacific
- 5.1. Market Analysis, Insights and Forecast - by Vehicle Type
- 6. Global APAC Electric Buses Market Analysis, Insights and Forecast, 2021-2033
- 6.1. Market Analysis, Insights and Forecast - by Vehicle Type
- 6.1.1. Battery Electric Bus
- 6.1.2. Plug-in Hybrid Electric Bus
- 6.2. Market Analysis, Insights and Forecast - by Power Source
- 6.2.1. DC/AC Inverter
- 6.2.2. DC/DC Converter
- 6.2.3. DC/DC Boost Converter
- 6.2.4. E-Motor
- 6.2.5. AC/DC Charger
- 6.2.6. Motor Controller
- 6.3. Market Analysis, Insights and Forecast - by Consumer
- 6.3.1. Government
- 6.3.2. Fleet Operators
- 6.1. Market Analysis, Insights and Forecast - by Vehicle Type
- 7. North America APAC Electric Buses Market Analysis, Insights and Forecast, 2020-2032
- 7.1. Market Analysis, Insights and Forecast - by Vehicle Type
- 7.1.1. Battery Electric Bus
- 7.1.2. Plug-in Hybrid Electric Bus
- 7.2. Market Analysis, Insights and Forecast - by Power Source
- 7.2.1. DC/AC Inverter
- 7.2.2. DC/DC Converter
- 7.2.3. DC/DC Boost Converter
- 7.2.4. E-Motor
- 7.2.5. AC/DC Charger
- 7.2.6. Motor Controller
- 7.3. Market Analysis, Insights and Forecast - by Consumer
- 7.3.1. Government
- 7.3.2. Fleet Operators
- 7.1. Market Analysis, Insights and Forecast - by Vehicle Type
- 8. South America APAC Electric Buses Market Analysis, Insights and Forecast, 2020-2032
- 8.1. Market Analysis, Insights and Forecast - by Vehicle Type
- 8.1.1. Battery Electric Bus
- 8.1.2. Plug-in Hybrid Electric Bus
- 8.2. Market Analysis, Insights and Forecast - by Power Source
- 8.2.1. DC/AC Inverter
- 8.2.2. DC/DC Converter
- 8.2.3. DC/DC Boost Converter
- 8.2.4. E-Motor
- 8.2.5. AC/DC Charger
- 8.2.6. Motor Controller
- 8.3. Market Analysis, Insights and Forecast - by Consumer
- 8.3.1. Government
- 8.3.2. Fleet Operators
- 8.1. Market Analysis, Insights and Forecast - by Vehicle Type
- 9. Europe APAC Electric Buses Market Analysis, Insights and Forecast, 2020-2032
- 9.1. Market Analysis, Insights and Forecast - by Vehicle Type
- 9.1.1. Battery Electric Bus
- 9.1.2. Plug-in Hybrid Electric Bus
- 9.2. Market Analysis, Insights and Forecast - by Power Source
- 9.2.1. DC/AC Inverter
- 9.2.2. DC/DC Converter
- 9.2.3. DC/DC Boost Converter
- 9.2.4. E-Motor
- 9.2.5. AC/DC Charger
- 9.2.6. Motor Controller
- 9.3. Market Analysis, Insights and Forecast - by Consumer
- 9.3.1. Government
- 9.3.2. Fleet Operators
- 9.1. Market Analysis, Insights and Forecast - by Vehicle Type
- 10. Middle East & Africa APAC Electric Buses Market Analysis, Insights and Forecast, 2020-2032
- 10.1. Market Analysis, Insights and Forecast - by Vehicle Type
- 10.1.1. Battery Electric Bus
- 10.1.2. Plug-in Hybrid Electric Bus
- 10.2. Market Analysis, Insights and Forecast - by Power Source
- 10.2.1. DC/AC Inverter
- 10.2.2. DC/DC Converter
- 10.2.3. DC/DC Boost Converter
- 10.2.4. E-Motor
- 10.2.5. AC/DC Charger
- 10.2.6. Motor Controller
- 10.3. Market Analysis, Insights and Forecast - by Consumer
- 10.3.1. Government
- 10.3.2. Fleet Operators
- 10.1. Market Analysis, Insights and Forecast - by Vehicle Type
- 11. Asia Pacific APAC Electric Buses Market Analysis, Insights and Forecast, 2020-2032
- 11.1. Market Analysis, Insights and Forecast - by Vehicle Type
- 11.1.1. Battery Electric Bus
- 11.1.2. Plug-in Hybrid Electric Bus
- 11.2. Market Analysis, Insights and Forecast - by Power Source
- 11.2.1. DC/AC Inverter
- 11.2.2. DC/DC Converter
- 11.2.3. DC/DC Boost Converter
- 11.2.4. E-Motor
- 11.2.5. AC/DC Charger
- 11.2.6. Motor Controller
- 11.3. Market Analysis, Insights and Forecast - by Consumer
- 11.3.1. Government
- 11.3.2. Fleet Operators
- 11.1. Market Analysis, Insights and Forecast - by Vehicle Type
- 12. Competitive Analysis
- 12.1. Company Profiles
- 12.1.1 Ashok Leyland Limited
- 12.1.1.1. Company Overview
- 12.1.1.2. Products
- 12.1.1.3. Company Financials
- 12.1.1.4. SWOT Analysis
- 12.1.2 Scania AB*List Not Exhaustive
- 12.1.2.1. Company Overview
- 12.1.2.2. Products
- 12.1.2.3. Company Financials
- 12.1.2.4. SWOT Analysis
- 12.1.3 Tata Motors Limited
- 12.1.3.1. Company Overview
- 12.1.3.2. Products
- 12.1.3.3. Company Financials
- 12.1.3.4. SWOT Analysis
- 12.1.4 Volvo Group
- 12.1.4.1. Company Overview
- 12.1.4.2. Products
- 12.1.4.3. Company Financials
- 12.1.4.4. SWOT Analysis
- 12.1.5 Nanjing Jiayuan EV
- 12.1.5.1. Company Overview
- 12.1.5.2. Products
- 12.1.5.3. Company Financials
- 12.1.5.4. SWOT Analysis
- 12.1.6 King Long United Automotive Co Limited
- 12.1.6.1. Company Overview
- 12.1.6.2. Products
- 12.1.6.3. Company Financials
- 12.1.6.4. SWOT Analysis
- 12.1.7 Zhongtong Bus Holding Co Limited
- 12.1.7.1. Company Overview
- 12.1.7.2. Products
- 12.1.7.3. Company Financials
- 12.1.7.4. SWOT Analysis
- 12.1.8 BYD Auto Co Limited
- 12.1.8.1. Company Overview
- 12.1.8.2. Products
- 12.1.8.3. Company Financials
- 12.1.8.4. SWOT Analysis
- 12.1.9 Anhui Ankai Automobile Industries Co Limited
- 12.1.9.1. Company Overview
- 12.1.9.2. Products
- 12.1.9.3. Company Financials
- 12.1.9.4. SWOT Analysis
- 12.1.1 Ashok Leyland Limited
- 12.2. Market Entropy
- 12.2.1 Company's Key Areas Served
- 12.2.2 Recent Developments
- 12.3. Company Market Share Analysis 2025
- 12.3.1 Top 5 Companies Market Share Analysis
- 12.3.2 Top 3 Companies Market Share Analysis
- 12.4. List of Potential Customers
- 13. Research Methodology
List of Figures
- Figure 1: Global APAC Electric Buses Market Revenue Breakdown (Million, %) by Region 2025 & 2033
- Figure 2: North America APAC Electric Buses Market Revenue (Million), by Vehicle Type 2025 & 2033
- Figure 3: North America APAC Electric Buses Market Revenue Share (%), by Vehicle Type 2025 & 2033
- Figure 4: North America APAC Electric Buses Market Revenue (Million), by Power Source 2025 & 2033
- Figure 5: North America APAC Electric Buses Market Revenue Share (%), by Power Source 2025 & 2033
- Figure 6: North America APAC Electric Buses Market Revenue (Million), by Consumer 2025 & 2033
- Figure 7: North America APAC Electric Buses Market Revenue Share (%), by Consumer 2025 & 2033
- Figure 8: North America APAC Electric Buses Market Revenue (Million), by Country 2025 & 2033
- Figure 9: North America APAC Electric Buses Market Revenue Share (%), by Country 2025 & 2033
- Figure 10: South America APAC Electric Buses Market Revenue (Million), by Vehicle Type 2025 & 2033
- Figure 11: South America APAC Electric Buses Market Revenue Share (%), by Vehicle Type 2025 & 2033
- Figure 12: South America APAC Electric Buses Market Revenue (Million), by Power Source 2025 & 2033
- Figure 13: South America APAC Electric Buses Market Revenue Share (%), by Power Source 2025 & 2033
- Figure 14: South America APAC Electric Buses Market Revenue (Million), by Consumer 2025 & 2033
- Figure 15: South America APAC Electric Buses Market Revenue Share (%), by Consumer 2025 & 2033
- Figure 16: South America APAC Electric Buses Market Revenue (Million), by Country 2025 & 2033
- Figure 17: South America APAC Electric Buses Market Revenue Share (%), by Country 2025 & 2033
- Figure 18: Europe APAC Electric Buses Market Revenue (Million), by Vehicle Type 2025 & 2033
- Figure 19: Europe APAC Electric Buses Market Revenue Share (%), by Vehicle Type 2025 & 2033
- Figure 20: Europe APAC Electric Buses Market Revenue (Million), by Power Source 2025 & 2033
- Figure 21: Europe APAC Electric Buses Market Revenue Share (%), by Power Source 2025 & 2033
- Figure 22: Europe APAC Electric Buses Market Revenue (Million), by Consumer 2025 & 2033
- Figure 23: Europe APAC Electric Buses Market Revenue Share (%), by Consumer 2025 & 2033
- Figure 24: Europe APAC Electric Buses Market Revenue (Million), by Country 2025 & 2033
- Figure 25: Europe APAC Electric Buses Market Revenue Share (%), by Country 2025 & 2033
- Figure 26: Middle East & Africa APAC Electric Buses Market Revenue (Million), by Vehicle Type 2025 & 2033
- Figure 27: Middle East & Africa APAC Electric Buses Market Revenue Share (%), by Vehicle Type 2025 & 2033
- Figure 28: Middle East & Africa APAC Electric Buses Market Revenue (Million), by Power Source 2025 & 2033
- Figure 29: Middle East & Africa APAC Electric Buses Market Revenue Share (%), by Power Source 2025 & 2033
- Figure 30: Middle East & Africa APAC Electric Buses Market Revenue (Million), by Consumer 2025 & 2033
- Figure 31: Middle East & Africa APAC Electric Buses Market Revenue Share (%), by Consumer 2025 & 2033
- Figure 32: Middle East & Africa APAC Electric Buses Market Revenue (Million), by Country 2025 & 2033
- Figure 33: Middle East & Africa APAC Electric Buses Market Revenue Share (%), by Country 2025 & 2033
- Figure 34: Asia Pacific APAC Electric Buses Market Revenue (Million), by Vehicle Type 2025 & 2033
- Figure 35: Asia Pacific APAC Electric Buses Market Revenue Share (%), by Vehicle Type 2025 & 2033
- Figure 36: Asia Pacific APAC Electric Buses Market Revenue (Million), by Power Source 2025 & 2033
- Figure 37: Asia Pacific APAC Electric Buses Market Revenue Share (%), by Power Source 2025 & 2033
- Figure 38: Asia Pacific APAC Electric Buses Market Revenue (Million), by Consumer 2025 & 2033
- Figure 39: Asia Pacific APAC Electric Buses Market Revenue Share (%), by Consumer 2025 & 2033
- Figure 40: Asia Pacific APAC Electric Buses Market Revenue (Million), by Country 2025 & 2033
- Figure 41: Asia Pacific APAC Electric Buses Market Revenue Share (%), by Country 2025 & 2033
List of Tables
- Table 1: Global APAC Electric Buses Market Revenue Million Forecast, by Vehicle Type 2020 & 2033
- Table 2: Global APAC Electric Buses Market Revenue Million Forecast, by Power Source 2020 & 2033
- Table 3: Global APAC Electric Buses Market Revenue Million Forecast, by Consumer 2020 & 2033
- Table 4: Global APAC Electric Buses Market Revenue Million Forecast, by Region 2020 & 2033
- Table 5: Global APAC Electric Buses Market Revenue Million Forecast, by Vehicle Type 2020 & 2033
- Table 6: Global APAC Electric Buses Market Revenue Million Forecast, by Power Source 2020 & 2033
- Table 7: Global APAC Electric Buses Market Revenue Million Forecast, by Consumer 2020 & 2033
- Table 8: Global APAC Electric Buses Market Revenue Million Forecast, by Country 2020 & 2033
- Table 9: United States APAC Electric Buses Market Revenue (Million) Forecast, by Application 2020 & 2033
- Table 10: Canada APAC Electric Buses Market Revenue (Million) Forecast, by Application 2020 & 2033
- Table 11: Mexico APAC Electric Buses Market Revenue (Million) Forecast, by Application 2020 & 2033
- Table 12: Global APAC Electric Buses Market Revenue Million Forecast, by Vehicle Type 2020 & 2033
- Table 13: Global APAC Electric Buses Market Revenue Million Forecast, by Power Source 2020 & 2033
- Table 14: Global APAC Electric Buses Market Revenue Million Forecast, by Consumer 2020 & 2033
- Table 15: Global APAC Electric Buses Market Revenue Million Forecast, by Country 2020 & 2033
- Table 16: Brazil APAC Electric Buses Market Revenue (Million) Forecast, by Application 2020 & 2033
- Table 17: Argentina APAC Electric Buses Market Revenue (Million) Forecast, by Application 2020 & 2033
- Table 18: Rest of South America APAC Electric Buses Market Revenue (Million) Forecast, by Application 2020 & 2033
- Table 19: Global APAC Electric Buses Market Revenue Million Forecast, by Vehicle Type 2020 & 2033
- Table 20: Global APAC Electric Buses Market Revenue Million Forecast, by Power Source 2020 & 2033
- Table 21: Global APAC Electric Buses Market Revenue Million Forecast, by Consumer 2020 & 2033
- Table 22: Global APAC Electric Buses Market Revenue Million Forecast, by Country 2020 & 2033
- Table 23: United Kingdom APAC Electric Buses Market Revenue (Million) Forecast, by Application 2020 & 2033
- Table 24: Germany APAC Electric Buses Market Revenue (Million) Forecast, by Application 2020 & 2033
- Table 25: France APAC Electric Buses Market Revenue (Million) Forecast, by Application 2020 & 2033
- Table 26: Italy APAC Electric Buses Market Revenue (Million) Forecast, by Application 2020 & 2033
- Table 27: Spain APAC Electric Buses Market Revenue (Million) Forecast, by Application 2020 & 2033
- Table 28: Russia APAC Electric Buses Market Revenue (Million) Forecast, by Application 2020 & 2033
- Table 29: Benelux APAC Electric Buses Market Revenue (Million) Forecast, by Application 2020 & 2033
- Table 30: Nordics APAC Electric Buses Market Revenue (Million) Forecast, by Application 2020 & 2033
- Table 31: Rest of Europe APAC Electric Buses Market Revenue (Million) Forecast, by Application 2020 & 2033
- Table 32: Global APAC Electric Buses Market Revenue Million Forecast, by Vehicle Type 2020 & 2033
- Table 33: Global APAC Electric Buses Market Revenue Million Forecast, by Power Source 2020 & 2033
- Table 34: Global APAC Electric Buses Market Revenue Million Forecast, by Consumer 2020 & 2033
- Table 35: Global APAC Electric Buses Market Revenue Million Forecast, by Country 2020 & 2033
- Table 36: Turkey APAC Electric Buses Market Revenue (Million) Forecast, by Application 2020 & 2033
- Table 37: Israel APAC Electric Buses Market Revenue (Million) Forecast, by Application 2020 & 2033
- Table 38: GCC APAC Electric Buses Market Revenue (Million) Forecast, by Application 2020 & 2033
- Table 39: North Africa APAC Electric Buses Market Revenue (Million) Forecast, by Application 2020 & 2033
- Table 40: South Africa APAC Electric Buses Market Revenue (Million) Forecast, by Application 2020 & 2033
- Table 41: Rest of Middle East & Africa APAC Electric Buses Market Revenue (Million) Forecast, by Application 2020 & 2033
- Table 42: Global APAC Electric Buses Market Revenue Million Forecast, by Vehicle Type 2020 & 2033
- Table 43: Global APAC Electric Buses Market Revenue Million Forecast, by Power Source 2020 & 2033
- Table 44: Global APAC Electric Buses Market Revenue Million Forecast, by Consumer 2020 & 2033
- Table 45: Global APAC Electric Buses Market Revenue Million Forecast, by Country 2020 & 2033
- Table 46: China APAC Electric Buses Market Revenue (Million) Forecast, by Application 2020 & 2033
- Table 47: India APAC Electric Buses Market Revenue (Million) Forecast, by Application 2020 & 2033
- Table 48: Japan APAC Electric Buses Market Revenue (Million) Forecast, by Application 2020 & 2033
- Table 49: South Korea APAC Electric Buses Market Revenue (Million) Forecast, by Application 2020 & 2033
- Table 50: ASEAN APAC Electric Buses Market Revenue (Million) Forecast, by Application 2020 & 2033
- Table 51: Oceania APAC Electric Buses Market Revenue (Million) Forecast, by Application 2020 & 2033
- Table 52: Rest of Asia Pacific APAC Electric Buses Market Revenue (Million) Forecast, by Application 2020 & 2033
Frequently Asked Questions
1. What is the projected Compound Annual Growth Rate (CAGR) of the APAC Electric Buses Market?
The projected CAGR is approximately 10.55%.
2. Which companies are prominent players in the APAC Electric Buses Market?
Key companies in the market include Ashok Leyland Limited, Scania AB*List Not Exhaustive, Tata Motors Limited, Volvo Group, Nanjing Jiayuan EV, King Long United Automotive Co Limited, Zhongtong Bus Holding Co Limited, BYD Auto Co Limited, Anhui Ankai Automobile Industries Co Limited.
3. What are the main segments of the APAC Electric Buses Market?
The market segments include Vehicle Type, Power Source, Consumer.
4. Can you provide details about the market size?
The market size is estimated to be USD 44.74 Million as of 2022.
5. What are some drivers contributing to market growth?
Growing Travel and Tourism Industry is Driving the Car Rental Market.
6. What are the notable trends driving market growth?
Battery Electric Bus Segment to Play Prominent Role in the Market.
7. Are there any restraints impacting market growth?
Increasing Popularity of Ride-Sharing Services Pose Challenges for the Conventional Car Rental Market.
8. Can you provide examples of recent developments in the market?
In August 2022, Ashok Leyland's subsidiary Switch Mobility Ltd. secured an order to supply 200 air-conditioned electric double-decker buses from BEST in Mumbai. The double-decker buses are from EiV22 family and are powered by a 231 kWh battery, The buses will replace the existing fossil fuel powered double-decker buses in the BEST fleet.
9. What pricing options are available for accessing the report?
Pricing options include single-user, multi-user, and enterprise licenses priced at USD 4750, USD 4950, and USD 6800 respectively.
10. Is the market size provided in terms of value or volume?
The market size is provided in terms of value, measured in Million.
11. Are there any specific market keywords associated with the report?
Yes, the market keyword associated with the report is "APAC Electric Buses Market," which aids in identifying and referencing the specific market segment covered.
12. How do I determine which pricing option suits my needs best?
The pricing options vary based on user requirements and access needs. Individual users may opt for single-user licenses, while businesses requiring broader access may choose multi-user or enterprise licenses for cost-effective access to the report.
13. Are there any additional resources or data provided in the APAC Electric Buses Market report?
While the report offers comprehensive insights, it's advisable to review the specific contents or supplementary materials provided to ascertain if additional resources or data are available.
14. How can I stay updated on further developments or reports in the APAC Electric Buses Market?
To stay informed about further developments, trends, and reports in the APAC Electric Buses Market, consider subscribing to industry newsletters, following relevant companies and organizations, or regularly checking reputable industry news sources and publications.
Methodology
Step 1 - Identification of Relevant Samples Size from Population Database


Step 2 - Approaches for Defining Global Market Size (Value, Volume* & Price*)

Note*: In applicable scenarios
Step 3 - Data Sources
Primary Research
- Web Analytics
- Survey Reports
- Research Institute
- Latest Research Reports
- Opinion Leaders
Secondary Research
- Annual Reports
- White Paper
- Latest Press Release
- Industry Association
- Paid Database
- Investor Presentations

Step 4 - Data Triangulation
Involves using different sources of information in order to increase the validity of a study
These sources are likely to be stakeholders in a program - participants, other researchers, program staff, other community members, and so on.
Then we put all data in single framework & apply various statistical tools to find out the dynamic on the market.
During the analysis stage, feedback from the stakeholder groups would be compared to determine areas of agreement as well as areas of divergence