

Key Insights
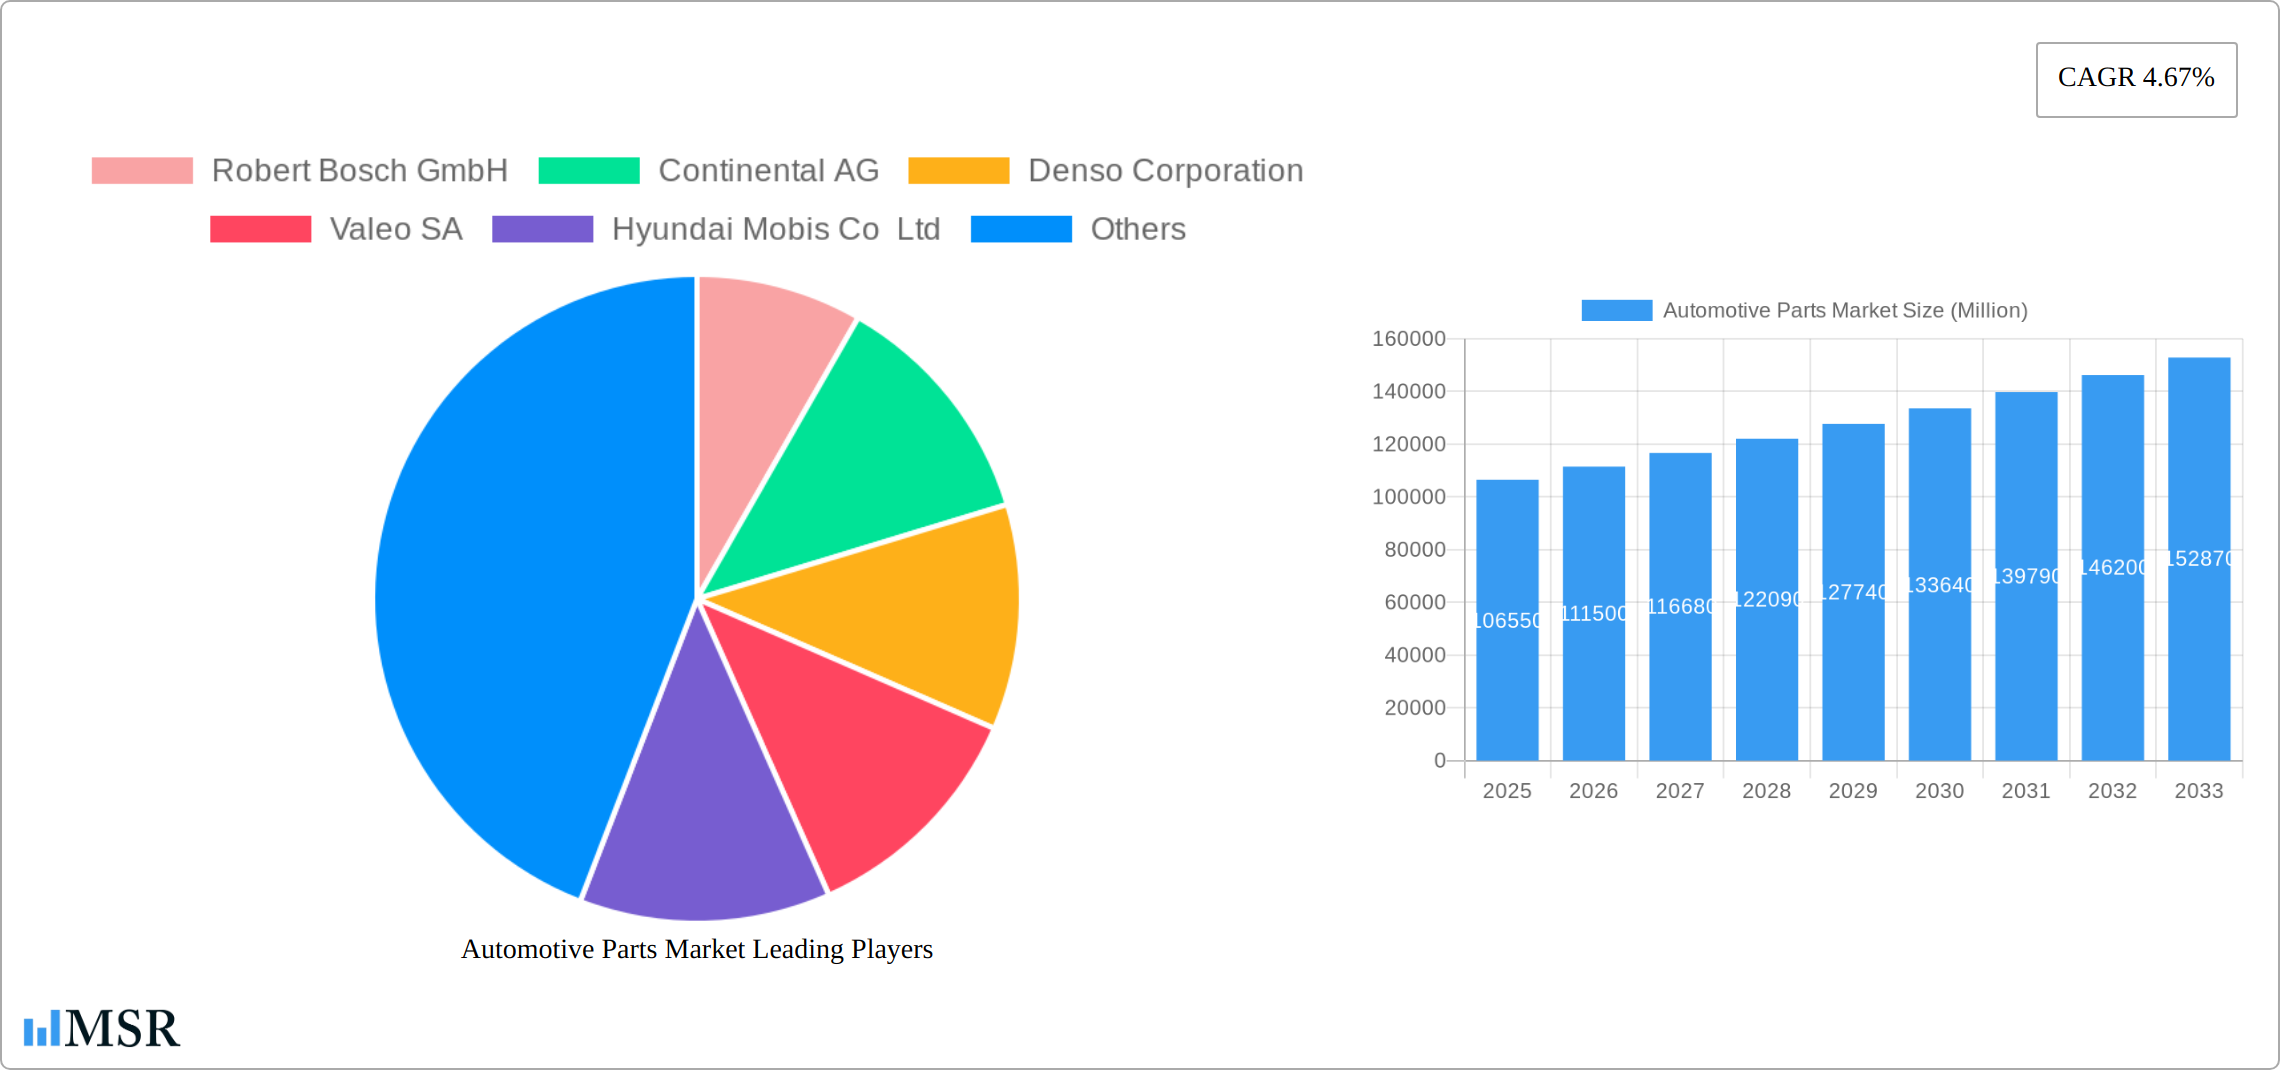
The global automotive parts market, valued at $106.55 billion in 2025, is projected to experience robust growth, driven by several key factors. The increasing demand for vehicles, particularly in developing economies, fuels the need for replacement and repair parts, significantly impacting market expansion. Furthermore, the ongoing trend towards vehicle electrification and the integration of advanced driver-assistance systems (ADAS) are creating new opportunities for innovative and technologically advanced components. The rising adoption of connected car technologies and the increasing focus on improving fuel efficiency also contribute to the market's growth trajectory. However, fluctuations in raw material prices and the global economic climate pose potential challenges. Supply chain disruptions and the impact of geopolitical events can influence the availability and cost of automotive parts, potentially affecting market growth. Despite these challenges, the long-term outlook remains positive, with a projected Compound Annual Growth Rate (CAGR) of 4.67% from 2025 to 2033. This growth is expected to be fueled by continuous technological advancements within the automotive industry and the increasing demand for higher quality, more durable, and technologically sophisticated parts.
The market is highly fragmented, with numerous global players such as Robert Bosch GmbH, Continental AG, Denso Corporation, and others fiercely competing for market share. These companies are continuously investing in research and development to improve existing technologies and introduce innovative products. Strategic partnerships and mergers & acquisitions are common strategies adopted by industry leaders to enhance their product portfolio and expand their market reach. Regional variations in growth are expected, with regions like Asia-Pacific likely to show significant growth due to rapid industrialization and increasing vehicle ownership. North America and Europe will continue to be major markets, driven by the replacement and repair of existing vehicles and the adoption of new technologies. Understanding the diverse range of segments within the automotive parts market—including engines, transmissions, braking systems, electronics, and others—is crucial for accurately predicting and capitalizing on future growth opportunities.
Automotive Parts Market: A Comprehensive Report (2019-2033)
This in-depth report provides a comprehensive analysis of the global Automotive Parts Market, encompassing market dynamics, industry trends, key players, and future growth prospects. The study period covers 2019-2033, with 2025 as the base and estimated year. This report is essential for automotive industry stakeholders, investors, and market researchers seeking actionable insights into this dynamic sector.
Automotive Parts Market Market Concentration & Dynamics
The automotive parts market exhibits a moderately concentrated landscape, with several large multinational corporations holding significant market share. Key players like Robert Bosch GmbH, Continental AG, and Denso Corporation dominate various segments. The market is characterized by a robust innovation ecosystem driven by the increasing demand for advanced driver-assistance systems (ADAS), electric vehicles (EVs), and connected car technologies.
Market Concentration Metrics:
- Top 5 players account for approximately xx% of the global market share (2025).
- Average market concentration ratio (CR5) is estimated at xx%.
Dynamics:
- Innovation Ecosystems: Intense R&D investments fuel continuous advancements in materials, electronics, and software, leading to lighter, safer, and more efficient components.
- Regulatory Frameworks: Stringent emission regulations and safety standards globally influence technological innovations and market demand.
- Substitute Products: The emergence of alternative materials and manufacturing processes presents both opportunities and challenges for established players.
- End-User Trends: Increasing preference for fuel-efficient and environmentally friendly vehicles significantly impacts demand for specific automotive parts.
- M&A Activities: The number of mergers and acquisitions in the industry has increased in recent years, driven by the need for technological advancements and market consolidation. An estimated xx M&A deals were recorded between 2019 and 2024.
Automotive Parts Market Industry Insights & Trends
The global automotive parts market is projected to experience robust growth, driven by factors like the rising demand for vehicles globally, technological advancements in automotive technology, and increasing investments in the automotive sector. The market size was valued at USD xx Million in 2025 and is expected to reach USD xx Million by 2033, exhibiting a CAGR of xx% during the forecast period (2025-2033).
The industry witnesses significant technological disruptions, including the transition toward electric vehicles, autonomous driving technologies, and the increasing integration of electronics and software in vehicles. Consumer preferences are also shifting towards advanced safety features, personalized in-car experiences, and improved fuel efficiency, impacting the demand for different types of automotive parts.

Key Markets & Segments Leading Automotive Parts Market
The Asia-Pacific region is currently the dominant market for automotive parts, driven by factors such as rapid economic growth, increasing vehicle production, and expanding infrastructure. China and India are particularly significant contributors to this regional dominance.
Drivers for Asia-Pacific Dominance:
- Rapid economic growth and rising disposable incomes leading to higher vehicle ownership.
- Significant investments in automotive manufacturing and infrastructure development.
- A large and expanding middle class with increased purchasing power.
- Government initiatives supporting domestic automotive production.
Detailed analysis reveals the substantial contribution of the Asia-Pacific region to the global market volume and revenue. While other regions such as North America and Europe also hold significant market share, their growth rate is comparatively slower. Specific segment dominance varies depending on the type of automotive part and the region considered.
Automotive Parts Market Product Developments
Recent years have witnessed significant product innovations in automotive parts, driven by the need for enhanced safety, fuel efficiency, and performance. Technological advancements, such as the adoption of lightweight materials, advanced driver-assistance systems (ADAS), and electric vehicle components, are reshaping the product landscape. These innovations are fostering a competitive advantage for companies that successfully adapt to market trends.
Challenges in the Automotive Parts Market Market
The automotive parts market faces challenges including stringent regulatory requirements concerning emissions and safety, fluctuations in raw material prices, and disruptions in global supply chains. These factors can lead to increased production costs and potentially impact profitability. Increased competition, particularly from emerging players in developing economies, also creates pressure. For instance, supply chain disruptions in 2022-2023 resulted in an estimated xx% increase in production costs for some parts.
Forces Driving Automotive Parts Market Growth
The automotive parts market growth is fueled by several key factors:
- Technological Advancements: The shift towards EVs, ADAS, and connected vehicles is driving demand for advanced electronic components, sensors, and software.
- Economic Growth: Rising disposable incomes in emerging economies are boosting vehicle sales and consequently, the demand for parts.
- Government Regulations: Stricter emission norms and safety standards are incentivizing the adoption of newer, more efficient parts. For example, the EU's Euro 7 standards are expected to significantly impact the market for emission control systems.
Challenges in the Automotive Parts Market Market (Long-Term Growth Catalysts)
Long-term growth is fueled by strategic partnerships and collaborations fostering innovation in areas such as electrification, autonomous driving, and connected car technologies. Market expansion into emerging economies and the development of sustainable and eco-friendly parts further contribute to this positive outlook.
Emerging Opportunities in Automotive Parts Market
Emerging opportunities include the growing market for electric vehicle components, the rising adoption of autonomous driving technology, and the increasing demand for connected car features. New materials and manufacturing processes will offer significant opportunities for innovation and growth. The focus on improving vehicle safety and efficiency opens doors for sophisticated components, sensors, and software solutions.
Leading Players in the Automotive Parts Market Sector
- Robert Bosch GmbH
- Continental AG
- Denso Corporation
- Valeo SA
- Hyundai Mobis Co Ltd
- ZF Friedrichshafen AG
- Magna International Inc
- Faurecia SE
- Lear Corporation
- CATL (Contemporary Amperex Technology Co Ltd)
- Aisin Corporation
- Aptiv Plc
- BorgWarner Inc
- Schaeffler AG
- Cummins Inc
Key Milestones in Automotive Parts Market Industry
- April 2024: BorgWarner Inc. invested USD 20.6 Million in expanding its EV product manufacturing facility in the US, boosting its EV component production capabilities.
- January 2024: ZF Friedrichshafen AG launched a highly advanced Parking ECU, enhancing automated parking system accessibility and affordability.
- November 2023: ZF Friedrichshafen AG unveiled a groundbreaking electro-mechanical brake system, offering a simpler and more sustainable alternative to traditional systems.
Strategic Outlook for Automotive Parts Market Market
The automotive parts market's future looks promising, driven by the ongoing trend towards electrification, automation, and connectivity. Strategic partnerships, investments in R&D, and the development of sustainable solutions will be crucial for success in this evolving landscape. Companies that can adapt quickly to technological change and evolving consumer preferences will be best positioned for growth.
Automotive Parts Market Segmentation
-
1. Type
- 1.1. Driveline and Powertrain
- 1.2. Interior and Exterior
- 1.3. Electrical and Electronics
- 1.4. Body and Chassis
- 1.5. Wheel and Tires
- 1.6. Other types
-
2. Propulsion
- 2.1. Internal Combustion Engine
- 2.2. Battery Electric Vehicles
- 2.3. Hybrid Electric Vehicles
- 2.4. Plug-in Hybrid Electric Vehicles
- 2.5. Fuel Cell Electric Vehicles
-
3. Vehicle Type
- 3.1. Passenger Car
- 3.2. Commercial Vehicles
-
4. Sales Channel
- 4.1. Original Equipment Manufacturers (OEM)
- 4.2. Aftermarket
Automotive Parts Market Segmentation By Geography
-
1. North America
- 1.1. United States
- 1.2. Canada
- 1.3. Rest of North America
-
2. Europe
- 2.1. Germany
- 2.2. United Kingdom
- 2.3. France
- 2.4. Italy
- 2.5. Spain
- 2.6. Rest of Europe
-
3. Asia Pacific
- 3.1. China
- 3.2. India
- 3.3. Japan
- 3.4. South Korea
- 3.5. Rest of Asia Pacific
-
4. Rest of the World
- 4.1. South America
- 4.2. Middle East and Africa

Automotive Parts Market REPORT HIGHLIGHTS
| Aspects | Details |
|---|---|
| Study Period | 2019-2033 |
| Base Year | 2024 |
| Estimated Year | 2025 |
| Forecast Period | 2025-2033 |
| Historical Period | 2019-2024 |
| Growth Rate | CAGR of 4.67% from 2019-2033 |
| Segmentation |
|
Table of Contents
- 1. Introduction
- 1.1. Research Scope
- 1.2. Market Segmentation
- 1.3. Research Methodology
- 1.4. Definitions and Assumptions
- 2. Executive Summary
- 2.1. Introduction
- 3. Market Dynamics
- 3.1. Introduction
- 3.2. Market Drivers
- 3.2.1. Rise in Vehicle Production Across the Globe
- 3.3. Market Restrains
- 3.3.1. Rise in Vehicle Production Across the Globe
- 3.4. Market Trends
- 3.4.1. Battery Electric Vehicles are Witnessing Major Growth
- 4. Market Factor Analysis
- 4.1. Porters Five Forces
- 4.2. Supply/Value Chain
- 4.3. PESTEL analysis
- 4.4. Market Entropy
- 4.5. Patent/Trademark Analysis
- 5. Global Automotive Parts Market Analysis, Insights and Forecast, 2019-2031
- 5.1. Market Analysis, Insights and Forecast - by Type
- 5.1.1. Driveline and Powertrain
- 5.1.2. Interior and Exterior
- 5.1.3. Electrical and Electronics
- 5.1.4. Body and Chassis
- 5.1.5. Wheel and Tires
- 5.1.6. Other types
- 5.2. Market Analysis, Insights and Forecast - by Propulsion
- 5.2.1. Internal Combustion Engine
- 5.2.2. Battery Electric Vehicles
- 5.2.3. Hybrid Electric Vehicles
- 5.2.4. Plug-in Hybrid Electric Vehicles
- 5.2.5. Fuel Cell Electric Vehicles
- 5.3. Market Analysis, Insights and Forecast - by Vehicle Type
- 5.3.1. Passenger Car
- 5.3.2. Commercial Vehicles
- 5.4. Market Analysis, Insights and Forecast - by Sales Channel
- 5.4.1. Original Equipment Manufacturers (OEM)
- 5.4.2. Aftermarket
- 5.5. Market Analysis, Insights and Forecast - by Region
- 5.5.1. North America
- 5.5.2. Europe
- 5.5.3. Asia Pacific
- 5.5.4. Rest of the World
- 5.1. Market Analysis, Insights and Forecast - by Type
- 6. North America Automotive Parts Market Analysis, Insights and Forecast, 2019-2031
- 6.1. Market Analysis, Insights and Forecast - by Type
- 6.1.1. Driveline and Powertrain
- 6.1.2. Interior and Exterior
- 6.1.3. Electrical and Electronics
- 6.1.4. Body and Chassis
- 6.1.5. Wheel and Tires
- 6.1.6. Other types
- 6.2. Market Analysis, Insights and Forecast - by Propulsion
- 6.2.1. Internal Combustion Engine
- 6.2.2. Battery Electric Vehicles
- 6.2.3. Hybrid Electric Vehicles
- 6.2.4. Plug-in Hybrid Electric Vehicles
- 6.2.5. Fuel Cell Electric Vehicles
- 6.3. Market Analysis, Insights and Forecast - by Vehicle Type
- 6.3.1. Passenger Car
- 6.3.2. Commercial Vehicles
- 6.4. Market Analysis, Insights and Forecast - by Sales Channel
- 6.4.1. Original Equipment Manufacturers (OEM)
- 6.4.2. Aftermarket
- 6.1. Market Analysis, Insights and Forecast - by Type
- 7. Europe Automotive Parts Market Analysis, Insights and Forecast, 2019-2031
- 7.1. Market Analysis, Insights and Forecast - by Type
- 7.1.1. Driveline and Powertrain
- 7.1.2. Interior and Exterior
- 7.1.3. Electrical and Electronics
- 7.1.4. Body and Chassis
- 7.1.5. Wheel and Tires
- 7.1.6. Other types
- 7.2. Market Analysis, Insights and Forecast - by Propulsion
- 7.2.1. Internal Combustion Engine
- 7.2.2. Battery Electric Vehicles
- 7.2.3. Hybrid Electric Vehicles
- 7.2.4. Plug-in Hybrid Electric Vehicles
- 7.2.5. Fuel Cell Electric Vehicles
- 7.3. Market Analysis, Insights and Forecast - by Vehicle Type
- 7.3.1. Passenger Car
- 7.3.2. Commercial Vehicles
- 7.4. Market Analysis, Insights and Forecast - by Sales Channel
- 7.4.1. Original Equipment Manufacturers (OEM)
- 7.4.2. Aftermarket
- 7.1. Market Analysis, Insights and Forecast - by Type
- 8. Asia Pacific Automotive Parts Market Analysis, Insights and Forecast, 2019-2031
- 8.1. Market Analysis, Insights and Forecast - by Type
- 8.1.1. Driveline and Powertrain
- 8.1.2. Interior and Exterior
- 8.1.3. Electrical and Electronics
- 8.1.4. Body and Chassis
- 8.1.5. Wheel and Tires
- 8.1.6. Other types
- 8.2. Market Analysis, Insights and Forecast - by Propulsion
- 8.2.1. Internal Combustion Engine
- 8.2.2. Battery Electric Vehicles
- 8.2.3. Hybrid Electric Vehicles
- 8.2.4. Plug-in Hybrid Electric Vehicles
- 8.2.5. Fuel Cell Electric Vehicles
- 8.3. Market Analysis, Insights and Forecast - by Vehicle Type
- 8.3.1. Passenger Car
- 8.3.2. Commercial Vehicles
- 8.4. Market Analysis, Insights and Forecast - by Sales Channel
- 8.4.1. Original Equipment Manufacturers (OEM)
- 8.4.2. Aftermarket
- 8.1. Market Analysis, Insights and Forecast - by Type
- 9. Rest of the World Automotive Parts Market Analysis, Insights and Forecast, 2019-2031
- 9.1. Market Analysis, Insights and Forecast - by Type
- 9.1.1. Driveline and Powertrain
- 9.1.2. Interior and Exterior
- 9.1.3. Electrical and Electronics
- 9.1.4. Body and Chassis
- 9.1.5. Wheel and Tires
- 9.1.6. Other types
- 9.2. Market Analysis, Insights and Forecast - by Propulsion
- 9.2.1. Internal Combustion Engine
- 9.2.2. Battery Electric Vehicles
- 9.2.3. Hybrid Electric Vehicles
- 9.2.4. Plug-in Hybrid Electric Vehicles
- 9.2.5. Fuel Cell Electric Vehicles
- 9.3. Market Analysis, Insights and Forecast - by Vehicle Type
- 9.3.1. Passenger Car
- 9.3.2. Commercial Vehicles
- 9.4. Market Analysis, Insights and Forecast - by Sales Channel
- 9.4.1. Original Equipment Manufacturers (OEM)
- 9.4.2. Aftermarket
- 9.1. Market Analysis, Insights and Forecast - by Type
- 10. Competitive Analysis
- 10.1. Global Market Share Analysis 2024
- 10.2. Company Profiles
- 10.2.1 Robert Bosch GmbH
- 10.2.1.1. Overview
- 10.2.1.2. Products
- 10.2.1.3. SWOT Analysis
- 10.2.1.4. Recent Developments
- 10.2.1.5. Financials (Based on Availability)
- 10.2.2 Continental AG
- 10.2.2.1. Overview
- 10.2.2.2. Products
- 10.2.2.3. SWOT Analysis
- 10.2.2.4. Recent Developments
- 10.2.2.5. Financials (Based on Availability)
- 10.2.3 Denso Corporation
- 10.2.3.1. Overview
- 10.2.3.2. Products
- 10.2.3.3. SWOT Analysis
- 10.2.3.4. Recent Developments
- 10.2.3.5. Financials (Based on Availability)
- 10.2.4 Valeo SA
- 10.2.4.1. Overview
- 10.2.4.2. Products
- 10.2.4.3. SWOT Analysis
- 10.2.4.4. Recent Developments
- 10.2.4.5. Financials (Based on Availability)
- 10.2.5 Hyundai Mobis Co Ltd
- 10.2.5.1. Overview
- 10.2.5.2. Products
- 10.2.5.3. SWOT Analysis
- 10.2.5.4. Recent Developments
- 10.2.5.5. Financials (Based on Availability)
- 10.2.6 ZF Friedrichshafen AG
- 10.2.6.1. Overview
- 10.2.6.2. Products
- 10.2.6.3. SWOT Analysis
- 10.2.6.4. Recent Developments
- 10.2.6.5. Financials (Based on Availability)
- 10.2.7 Magna International Inc
- 10.2.7.1. Overview
- 10.2.7.2. Products
- 10.2.7.3. SWOT Analysis
- 10.2.7.4. Recent Developments
- 10.2.7.5. Financials (Based on Availability)
- 10.2.8 Faurecia SE
- 10.2.8.1. Overview
- 10.2.8.2. Products
- 10.2.8.3. SWOT Analysis
- 10.2.8.4. Recent Developments
- 10.2.8.5. Financials (Based on Availability)
- 10.2.9 Lear Corporation
- 10.2.9.1. Overview
- 10.2.9.2. Products
- 10.2.9.3. SWOT Analysis
- 10.2.9.4. Recent Developments
- 10.2.9.5. Financials (Based on Availability)
- 10.2.10 CATL (Contemporary Amperex Technology Co Ltd)
- 10.2.10.1. Overview
- 10.2.10.2. Products
- 10.2.10.3. SWOT Analysis
- 10.2.10.4. Recent Developments
- 10.2.10.5. Financials (Based on Availability)
- 10.2.11 Aisin Corporation
- 10.2.11.1. Overview
- 10.2.11.2. Products
- 10.2.11.3. SWOT Analysis
- 10.2.11.4. Recent Developments
- 10.2.11.5. Financials (Based on Availability)
- 10.2.12 Aptiv Plc
- 10.2.12.1. Overview
- 10.2.12.2. Products
- 10.2.12.3. SWOT Analysis
- 10.2.12.4. Recent Developments
- 10.2.12.5. Financials (Based on Availability)
- 10.2.13 BorgWarner Inc
- 10.2.13.1. Overview
- 10.2.13.2. Products
- 10.2.13.3. SWOT Analysis
- 10.2.13.4. Recent Developments
- 10.2.13.5. Financials (Based on Availability)
- 10.2.14 Schaeffler AG
- 10.2.14.1. Overview
- 10.2.14.2. Products
- 10.2.14.3. SWOT Analysis
- 10.2.14.4. Recent Developments
- 10.2.14.5. Financials (Based on Availability)
- 10.2.15 Cummins Inc
- 10.2.15.1. Overview
- 10.2.15.2. Products
- 10.2.15.3. SWOT Analysis
- 10.2.15.4. Recent Developments
- 10.2.15.5. Financials (Based on Availability)
- 10.2.1 Robert Bosch GmbH
List of Figures
- Figure 1: Global Automotive Parts Market Revenue Breakdown (Million, %) by Region 2024 & 2032
- Figure 2: Global Automotive Parts Market Volume Breakdown (Billion, %) by Region 2024 & 2032
- Figure 3: North America Automotive Parts Market Revenue (Million), by Type 2024 & 2032
- Figure 4: North America Automotive Parts Market Volume (Billion), by Type 2024 & 2032
- Figure 5: North America Automotive Parts Market Revenue Share (%), by Type 2024 & 2032
- Figure 6: North America Automotive Parts Market Volume Share (%), by Type 2024 & 2032
- Figure 7: North America Automotive Parts Market Revenue (Million), by Propulsion 2024 & 2032
- Figure 8: North America Automotive Parts Market Volume (Billion), by Propulsion 2024 & 2032
- Figure 9: North America Automotive Parts Market Revenue Share (%), by Propulsion 2024 & 2032
- Figure 10: North America Automotive Parts Market Volume Share (%), by Propulsion 2024 & 2032
- Figure 11: North America Automotive Parts Market Revenue (Million), by Vehicle Type 2024 & 2032
- Figure 12: North America Automotive Parts Market Volume (Billion), by Vehicle Type 2024 & 2032
- Figure 13: North America Automotive Parts Market Revenue Share (%), by Vehicle Type 2024 & 2032
- Figure 14: North America Automotive Parts Market Volume Share (%), by Vehicle Type 2024 & 2032
- Figure 15: North America Automotive Parts Market Revenue (Million), by Sales Channel 2024 & 2032
- Figure 16: North America Automotive Parts Market Volume (Billion), by Sales Channel 2024 & 2032
- Figure 17: North America Automotive Parts Market Revenue Share (%), by Sales Channel 2024 & 2032
- Figure 18: North America Automotive Parts Market Volume Share (%), by Sales Channel 2024 & 2032
- Figure 19: North America Automotive Parts Market Revenue (Million), by Country 2024 & 2032
- Figure 20: North America Automotive Parts Market Volume (Billion), by Country 2024 & 2032
- Figure 21: North America Automotive Parts Market Revenue Share (%), by Country 2024 & 2032
- Figure 22: North America Automotive Parts Market Volume Share (%), by Country 2024 & 2032
- Figure 23: Europe Automotive Parts Market Revenue (Million), by Type 2024 & 2032
- Figure 24: Europe Automotive Parts Market Volume (Billion), by Type 2024 & 2032
- Figure 25: Europe Automotive Parts Market Revenue Share (%), by Type 2024 & 2032
- Figure 26: Europe Automotive Parts Market Volume Share (%), by Type 2024 & 2032
- Figure 27: Europe Automotive Parts Market Revenue (Million), by Propulsion 2024 & 2032
- Figure 28: Europe Automotive Parts Market Volume (Billion), by Propulsion 2024 & 2032
- Figure 29: Europe Automotive Parts Market Revenue Share (%), by Propulsion 2024 & 2032
- Figure 30: Europe Automotive Parts Market Volume Share (%), by Propulsion 2024 & 2032
- Figure 31: Europe Automotive Parts Market Revenue (Million), by Vehicle Type 2024 & 2032
- Figure 32: Europe Automotive Parts Market Volume (Billion), by Vehicle Type 2024 & 2032
- Figure 33: Europe Automotive Parts Market Revenue Share (%), by Vehicle Type 2024 & 2032
- Figure 34: Europe Automotive Parts Market Volume Share (%), by Vehicle Type 2024 & 2032
- Figure 35: Europe Automotive Parts Market Revenue (Million), by Sales Channel 2024 & 2032
- Figure 36: Europe Automotive Parts Market Volume (Billion), by Sales Channel 2024 & 2032
- Figure 37: Europe Automotive Parts Market Revenue Share (%), by Sales Channel 2024 & 2032
- Figure 38: Europe Automotive Parts Market Volume Share (%), by Sales Channel 2024 & 2032
- Figure 39: Europe Automotive Parts Market Revenue (Million), by Country 2024 & 2032
- Figure 40: Europe Automotive Parts Market Volume (Billion), by Country 2024 & 2032
- Figure 41: Europe Automotive Parts Market Revenue Share (%), by Country 2024 & 2032
- Figure 42: Europe Automotive Parts Market Volume Share (%), by Country 2024 & 2032
- Figure 43: Asia Pacific Automotive Parts Market Revenue (Million), by Type 2024 & 2032
- Figure 44: Asia Pacific Automotive Parts Market Volume (Billion), by Type 2024 & 2032
- Figure 45: Asia Pacific Automotive Parts Market Revenue Share (%), by Type 2024 & 2032
- Figure 46: Asia Pacific Automotive Parts Market Volume Share (%), by Type 2024 & 2032
- Figure 47: Asia Pacific Automotive Parts Market Revenue (Million), by Propulsion 2024 & 2032
- Figure 48: Asia Pacific Automotive Parts Market Volume (Billion), by Propulsion 2024 & 2032
- Figure 49: Asia Pacific Automotive Parts Market Revenue Share (%), by Propulsion 2024 & 2032
- Figure 50: Asia Pacific Automotive Parts Market Volume Share (%), by Propulsion 2024 & 2032
- Figure 51: Asia Pacific Automotive Parts Market Revenue (Million), by Vehicle Type 2024 & 2032
- Figure 52: Asia Pacific Automotive Parts Market Volume (Billion), by Vehicle Type 2024 & 2032
- Figure 53: Asia Pacific Automotive Parts Market Revenue Share (%), by Vehicle Type 2024 & 2032
- Figure 54: Asia Pacific Automotive Parts Market Volume Share (%), by Vehicle Type 2024 & 2032
- Figure 55: Asia Pacific Automotive Parts Market Revenue (Million), by Sales Channel 2024 & 2032
- Figure 56: Asia Pacific Automotive Parts Market Volume (Billion), by Sales Channel 2024 & 2032
- Figure 57: Asia Pacific Automotive Parts Market Revenue Share (%), by Sales Channel 2024 & 2032
- Figure 58: Asia Pacific Automotive Parts Market Volume Share (%), by Sales Channel 2024 & 2032
- Figure 59: Asia Pacific Automotive Parts Market Revenue (Million), by Country 2024 & 2032
- Figure 60: Asia Pacific Automotive Parts Market Volume (Billion), by Country 2024 & 2032
- Figure 61: Asia Pacific Automotive Parts Market Revenue Share (%), by Country 2024 & 2032
- Figure 62: Asia Pacific Automotive Parts Market Volume Share (%), by Country 2024 & 2032
- Figure 63: Rest of the World Automotive Parts Market Revenue (Million), by Type 2024 & 2032
- Figure 64: Rest of the World Automotive Parts Market Volume (Billion), by Type 2024 & 2032
- Figure 65: Rest of the World Automotive Parts Market Revenue Share (%), by Type 2024 & 2032
- Figure 66: Rest of the World Automotive Parts Market Volume Share (%), by Type 2024 & 2032
- Figure 67: Rest of the World Automotive Parts Market Revenue (Million), by Propulsion 2024 & 2032
- Figure 68: Rest of the World Automotive Parts Market Volume (Billion), by Propulsion 2024 & 2032
- Figure 69: Rest of the World Automotive Parts Market Revenue Share (%), by Propulsion 2024 & 2032
- Figure 70: Rest of the World Automotive Parts Market Volume Share (%), by Propulsion 2024 & 2032
- Figure 71: Rest of the World Automotive Parts Market Revenue (Million), by Vehicle Type 2024 & 2032
- Figure 72: Rest of the World Automotive Parts Market Volume (Billion), by Vehicle Type 2024 & 2032
- Figure 73: Rest of the World Automotive Parts Market Revenue Share (%), by Vehicle Type 2024 & 2032
- Figure 74: Rest of the World Automotive Parts Market Volume Share (%), by Vehicle Type 2024 & 2032
- Figure 75: Rest of the World Automotive Parts Market Revenue (Million), by Sales Channel 2024 & 2032
- Figure 76: Rest of the World Automotive Parts Market Volume (Billion), by Sales Channel 2024 & 2032
- Figure 77: Rest of the World Automotive Parts Market Revenue Share (%), by Sales Channel 2024 & 2032
- Figure 78: Rest of the World Automotive Parts Market Volume Share (%), by Sales Channel 2024 & 2032
- Figure 79: Rest of the World Automotive Parts Market Revenue (Million), by Country 2024 & 2032
- Figure 80: Rest of the World Automotive Parts Market Volume (Billion), by Country 2024 & 2032
- Figure 81: Rest of the World Automotive Parts Market Revenue Share (%), by Country 2024 & 2032
- Figure 82: Rest of the World Automotive Parts Market Volume Share (%), by Country 2024 & 2032
List of Tables
- Table 1: Global Automotive Parts Market Revenue Million Forecast, by Region 2019 & 2032
- Table 2: Global Automotive Parts Market Volume Billion Forecast, by Region 2019 & 2032
- Table 3: Global Automotive Parts Market Revenue Million Forecast, by Type 2019 & 2032
- Table 4: Global Automotive Parts Market Volume Billion Forecast, by Type 2019 & 2032
- Table 5: Global Automotive Parts Market Revenue Million Forecast, by Propulsion 2019 & 2032
- Table 6: Global Automotive Parts Market Volume Billion Forecast, by Propulsion 2019 & 2032
- Table 7: Global Automotive Parts Market Revenue Million Forecast, by Vehicle Type 2019 & 2032
- Table 8: Global Automotive Parts Market Volume Billion Forecast, by Vehicle Type 2019 & 2032
- Table 9: Global Automotive Parts Market Revenue Million Forecast, by Sales Channel 2019 & 2032
- Table 10: Global Automotive Parts Market Volume Billion Forecast, by Sales Channel 2019 & 2032
- Table 11: Global Automotive Parts Market Revenue Million Forecast, by Region 2019 & 2032
- Table 12: Global Automotive Parts Market Volume Billion Forecast, by Region 2019 & 2032
- Table 13: Global Automotive Parts Market Revenue Million Forecast, by Type 2019 & 2032
- Table 14: Global Automotive Parts Market Volume Billion Forecast, by Type 2019 & 2032
- Table 15: Global Automotive Parts Market Revenue Million Forecast, by Propulsion 2019 & 2032
- Table 16: Global Automotive Parts Market Volume Billion Forecast, by Propulsion 2019 & 2032
- Table 17: Global Automotive Parts Market Revenue Million Forecast, by Vehicle Type 2019 & 2032
- Table 18: Global Automotive Parts Market Volume Billion Forecast, by Vehicle Type 2019 & 2032
- Table 19: Global Automotive Parts Market Revenue Million Forecast, by Sales Channel 2019 & 2032
- Table 20: Global Automotive Parts Market Volume Billion Forecast, by Sales Channel 2019 & 2032
- Table 21: Global Automotive Parts Market Revenue Million Forecast, by Country 2019 & 2032
- Table 22: Global Automotive Parts Market Volume Billion Forecast, by Country 2019 & 2032
- Table 23: United States Automotive Parts Market Revenue (Million) Forecast, by Application 2019 & 2032
- Table 24: United States Automotive Parts Market Volume (Billion) Forecast, by Application 2019 & 2032
- Table 25: Canada Automotive Parts Market Revenue (Million) Forecast, by Application 2019 & 2032
- Table 26: Canada Automotive Parts Market Volume (Billion) Forecast, by Application 2019 & 2032
- Table 27: Rest of North America Automotive Parts Market Revenue (Million) Forecast, by Application 2019 & 2032
- Table 28: Rest of North America Automotive Parts Market Volume (Billion) Forecast, by Application 2019 & 2032
- Table 29: Global Automotive Parts Market Revenue Million Forecast, by Type 2019 & 2032
- Table 30: Global Automotive Parts Market Volume Billion Forecast, by Type 2019 & 2032
- Table 31: Global Automotive Parts Market Revenue Million Forecast, by Propulsion 2019 & 2032
- Table 32: Global Automotive Parts Market Volume Billion Forecast, by Propulsion 2019 & 2032
- Table 33: Global Automotive Parts Market Revenue Million Forecast, by Vehicle Type 2019 & 2032
- Table 34: Global Automotive Parts Market Volume Billion Forecast, by Vehicle Type 2019 & 2032
- Table 35: Global Automotive Parts Market Revenue Million Forecast, by Sales Channel 2019 & 2032
- Table 36: Global Automotive Parts Market Volume Billion Forecast, by Sales Channel 2019 & 2032
- Table 37: Global Automotive Parts Market Revenue Million Forecast, by Country 2019 & 2032
- Table 38: Global Automotive Parts Market Volume Billion Forecast, by Country 2019 & 2032
- Table 39: Germany Automotive Parts Market Revenue (Million) Forecast, by Application 2019 & 2032
- Table 40: Germany Automotive Parts Market Volume (Billion) Forecast, by Application 2019 & 2032
- Table 41: United Kingdom Automotive Parts Market Revenue (Million) Forecast, by Application 2019 & 2032
- Table 42: United Kingdom Automotive Parts Market Volume (Billion) Forecast, by Application 2019 & 2032
- Table 43: France Automotive Parts Market Revenue (Million) Forecast, by Application 2019 & 2032
- Table 44: France Automotive Parts Market Volume (Billion) Forecast, by Application 2019 & 2032
- Table 45: Italy Automotive Parts Market Revenue (Million) Forecast, by Application 2019 & 2032
- Table 46: Italy Automotive Parts Market Volume (Billion) Forecast, by Application 2019 & 2032
- Table 47: Spain Automotive Parts Market Revenue (Million) Forecast, by Application 2019 & 2032
- Table 48: Spain Automotive Parts Market Volume (Billion) Forecast, by Application 2019 & 2032
- Table 49: Rest of Europe Automotive Parts Market Revenue (Million) Forecast, by Application 2019 & 2032
- Table 50: Rest of Europe Automotive Parts Market Volume (Billion) Forecast, by Application 2019 & 2032
- Table 51: Global Automotive Parts Market Revenue Million Forecast, by Type 2019 & 2032
- Table 52: Global Automotive Parts Market Volume Billion Forecast, by Type 2019 & 2032
- Table 53: Global Automotive Parts Market Revenue Million Forecast, by Propulsion 2019 & 2032
- Table 54: Global Automotive Parts Market Volume Billion Forecast, by Propulsion 2019 & 2032
- Table 55: Global Automotive Parts Market Revenue Million Forecast, by Vehicle Type 2019 & 2032
- Table 56: Global Automotive Parts Market Volume Billion Forecast, by Vehicle Type 2019 & 2032
- Table 57: Global Automotive Parts Market Revenue Million Forecast, by Sales Channel 2019 & 2032
- Table 58: Global Automotive Parts Market Volume Billion Forecast, by Sales Channel 2019 & 2032
- Table 59: Global Automotive Parts Market Revenue Million Forecast, by Country 2019 & 2032
- Table 60: Global Automotive Parts Market Volume Billion Forecast, by Country 2019 & 2032
- Table 61: China Automotive Parts Market Revenue (Million) Forecast, by Application 2019 & 2032
- Table 62: China Automotive Parts Market Volume (Billion) Forecast, by Application 2019 & 2032
- Table 63: India Automotive Parts Market Revenue (Million) Forecast, by Application 2019 & 2032
- Table 64: India Automotive Parts Market Volume (Billion) Forecast, by Application 2019 & 2032
- Table 65: Japan Automotive Parts Market Revenue (Million) Forecast, by Application 2019 & 2032
- Table 66: Japan Automotive Parts Market Volume (Billion) Forecast, by Application 2019 & 2032
- Table 67: South Korea Automotive Parts Market Revenue (Million) Forecast, by Application 2019 & 2032
- Table 68: South Korea Automotive Parts Market Volume (Billion) Forecast, by Application 2019 & 2032
- Table 69: Rest of Asia Pacific Automotive Parts Market Revenue (Million) Forecast, by Application 2019 & 2032
- Table 70: Rest of Asia Pacific Automotive Parts Market Volume (Billion) Forecast, by Application 2019 & 2032
- Table 71: Global Automotive Parts Market Revenue Million Forecast, by Type 2019 & 2032
- Table 72: Global Automotive Parts Market Volume Billion Forecast, by Type 2019 & 2032
- Table 73: Global Automotive Parts Market Revenue Million Forecast, by Propulsion 2019 & 2032
- Table 74: Global Automotive Parts Market Volume Billion Forecast, by Propulsion 2019 & 2032
- Table 75: Global Automotive Parts Market Revenue Million Forecast, by Vehicle Type 2019 & 2032
- Table 76: Global Automotive Parts Market Volume Billion Forecast, by Vehicle Type 2019 & 2032
- Table 77: Global Automotive Parts Market Revenue Million Forecast, by Sales Channel 2019 & 2032
- Table 78: Global Automotive Parts Market Volume Billion Forecast, by Sales Channel 2019 & 2032
- Table 79: Global Automotive Parts Market Revenue Million Forecast, by Country 2019 & 2032
- Table 80: Global Automotive Parts Market Volume Billion Forecast, by Country 2019 & 2032
- Table 81: South America Automotive Parts Market Revenue (Million) Forecast, by Application 2019 & 2032
- Table 82: South America Automotive Parts Market Volume (Billion) Forecast, by Application 2019 & 2032
- Table 83: Middle East and Africa Automotive Parts Market Revenue (Million) Forecast, by Application 2019 & 2032
- Table 84: Middle East and Africa Automotive Parts Market Volume (Billion) Forecast, by Application 2019 & 2032
Frequently Asked Questions
1. What is the projected Compound Annual Growth Rate (CAGR) of the Automotive Parts Market?
The projected CAGR is approximately 4.67%.
2. Which companies are prominent players in the Automotive Parts Market?
Key companies in the market include Robert Bosch GmbH, Continental AG, Denso Corporation, Valeo SA, Hyundai Mobis Co Ltd, ZF Friedrichshafen AG, Magna International Inc, Faurecia SE, Lear Corporation, CATL (Contemporary Amperex Technology Co Ltd), Aisin Corporation, Aptiv Plc, BorgWarner Inc, Schaeffler AG, Cummins Inc.
3. What are the main segments of the Automotive Parts Market?
The market segments include Type, Propulsion, Vehicle Type, Sales Channel.
4. Can you provide details about the market size?
The market size is estimated to be USD 106.55 Million as of 2022.
5. What are some drivers contributing to market growth?
Rise in Vehicle Production Across the Globe.
6. What are the notable trends driving market growth?
Battery Electric Vehicles are Witnessing Major Growth.
7. Are there any restraints impacting market growth?
Rise in Vehicle Production Across the Globe.
8. Can you provide examples of recent developments in the market?
April 2024: BorgWarner Inc. invested USD 20.6 million for the expansion of an electric vehicle product manufacturing facility in the United States. With this investment, the company has expanded its development and testing of EV products, including battery modules, battery packs, and DC fast chargers. It has also scaled up its manufacturing operations for DC fast chargers.
9. What pricing options are available for accessing the report?
Pricing options include single-user, multi-user, and enterprise licenses priced at USD 4750, USD 5250, and USD 8750 respectively.
10. Is the market size provided in terms of value or volume?
The market size is provided in terms of value, measured in Million and volume, measured in Billion.
11. Are there any specific market keywords associated with the report?
Yes, the market keyword associated with the report is "Automotive Parts Market," which aids in identifying and referencing the specific market segment covered.
12. How do I determine which pricing option suits my needs best?
The pricing options vary based on user requirements and access needs. Individual users may opt for single-user licenses, while businesses requiring broader access may choose multi-user or enterprise licenses for cost-effective access to the report.
13. Are there any additional resources or data provided in the Automotive Parts Market report?
While the report offers comprehensive insights, it's advisable to review the specific contents or supplementary materials provided to ascertain if additional resources or data are available.
14. How can I stay updated on further developments or reports in the Automotive Parts Market?
To stay informed about further developments, trends, and reports in the Automotive Parts Market, consider subscribing to industry newsletters, following relevant companies and organizations, or regularly checking reputable industry news sources and publications.
Methodology
Step 1 - Identification of Relevant Samples Size from Population Database


Step 2 - Approaches for Defining Global Market Size (Value, Volume* & Price*)

Note*: In applicable scenarios
Step 3 - Data Sources
Primary Research
- Web Analytics
- Survey Reports
- Research Institute
- Latest Research Reports
- Opinion Leaders
Secondary Research
- Annual Reports
- White Paper
- Latest Press Release
- Industry Association
- Paid Database
- Investor Presentations

Step 4 - Data Triangulation
Involves using different sources of information in order to increase the validity of a study
These sources are likely to be stakeholders in a program - participants, other researchers, program staff, other community members, and so on.
Then we put all data in single framework & apply various statistical tools to find out the dynamic on the market.
During the analysis stage, feedback from the stakeholder groups would be compared to determine areas of agreement as well as areas of divergence
