

Key Insights
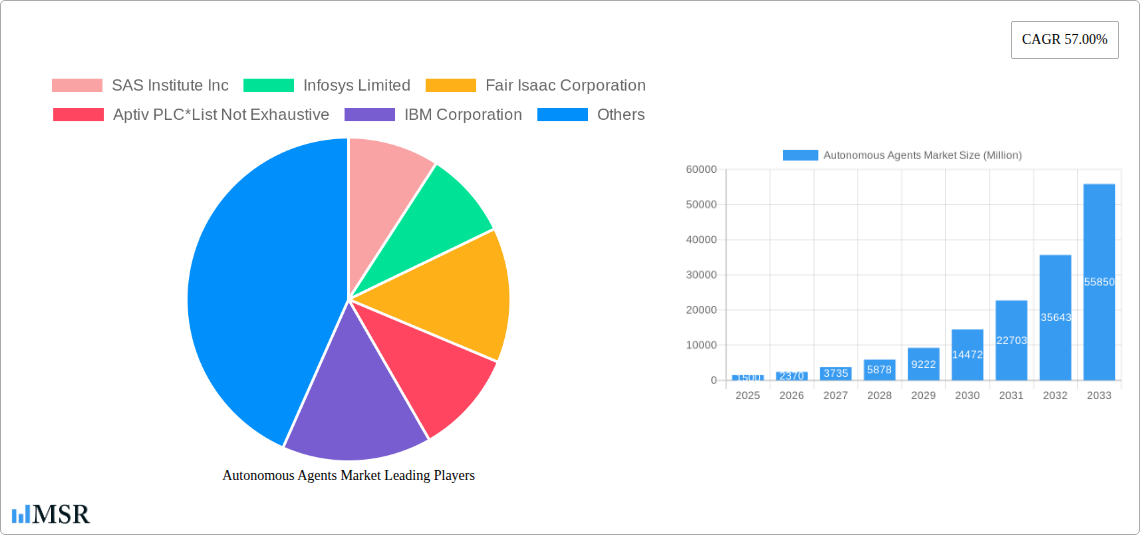
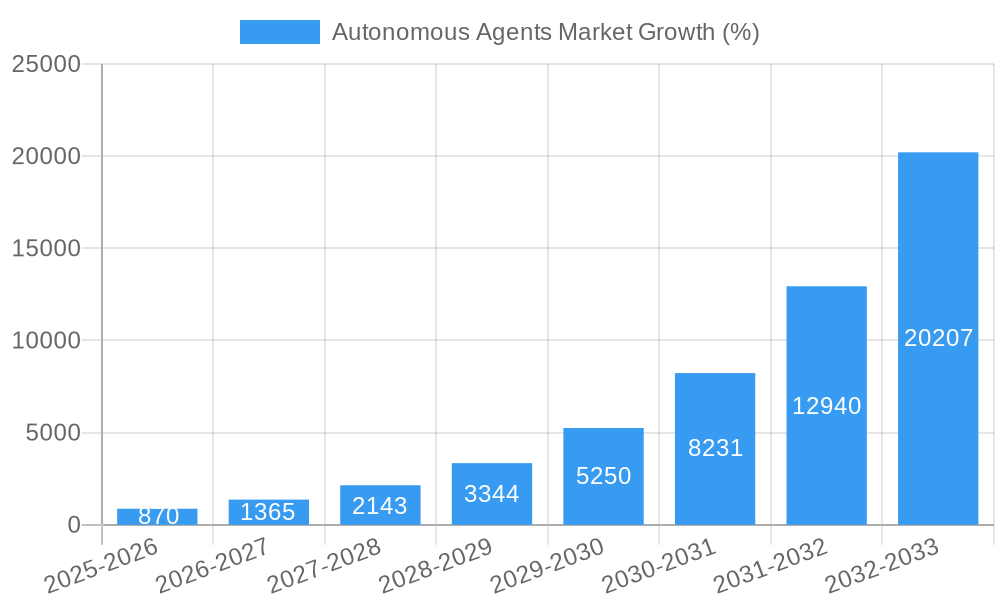
The Autonomous Agents market is experiencing explosive growth, projected to reach a substantial size with a remarkable Compound Annual Growth Rate (CAGR) of 57% from 2025 to 2033. This rapid expansion is driven by several key factors. The increasing adoption of cloud-based solutions offers scalability and cost-effectiveness, fueling market penetration across various sectors. Furthermore, advancements in artificial intelligence (AI) and machine learning (ML) are enabling the development of more sophisticated and autonomous agents capable of handling complex tasks, boosting efficiency and productivity. The surge in big data and the need for advanced analytics are also contributing significantly, as autonomous agents excel at processing and interpreting vast datasets to extract actionable insights. Industries like BFSI, IT & Telecom, and Healthcare are early adopters, leveraging autonomous agents for fraud detection, customer service automation, and personalized medicine, respectively. However, concerns regarding data security and privacy, as well as the need for robust regulatory frameworks, pose significant challenges to wider adoption. The market segmentation reveals a significant share held by large enterprises due to their greater resources and technological capabilities; however, SMEs are also progressively adopting these solutions, driving further market expansion.
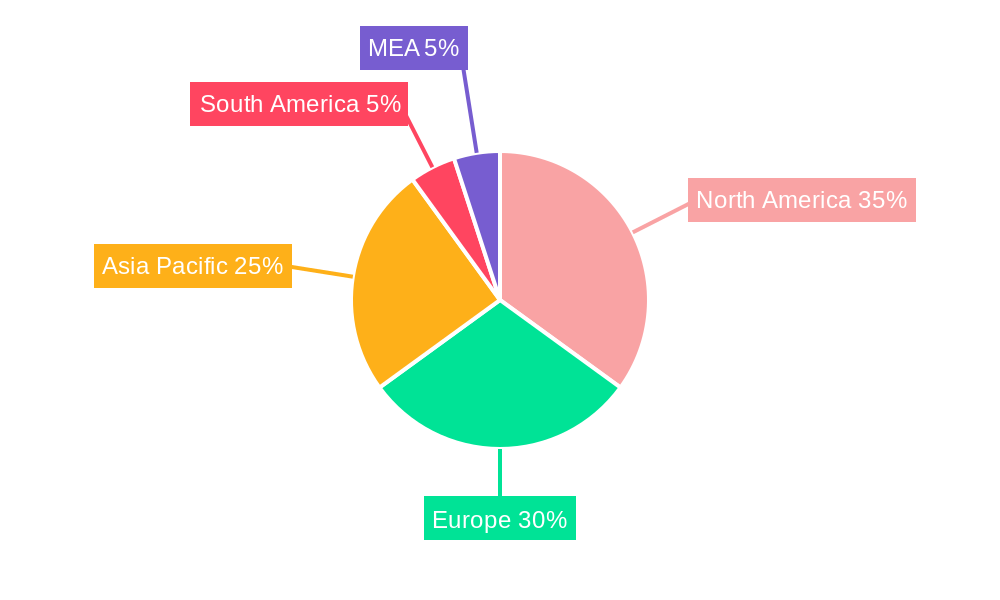
The geographical distribution showcases strong growth across North America and Europe, driven by technological advancements and early adoption. The Asia-Pacific region is also poised for rapid expansion, fueled by increasing digitalization and the growth of emerging economies like India and China. While the competitive landscape is populated by established tech giants like Google, Microsoft, and IBM, as well as specialized players like SAS and Nuance, the market is also witnessing the emergence of innovative startups focusing on niche applications. The forecast period suggests that continued technological innovation, coupled with increasing industry adoption, will further propel market growth, creating lucrative opportunities for established players and new entrants alike. However, sustained investment in R&D and a proactive approach to addressing security and ethical concerns will be crucial for long-term success in this dynamic market.
Autonomous Agents Market: A Comprehensive Report (2019-2033)
This in-depth report provides a comprehensive analysis of the Autonomous Agents Market, offering actionable insights for stakeholders across the industry. With a study period spanning 2019-2033, a base year of 2025, and a forecast period of 2025-2033, this report delivers a holistic view of market dynamics, growth drivers, challenges, and emerging opportunities. The market is segmented by deployment type (Cloud, On-Premises), organization size (SMEs, Large Enterprises), and industry vertical (BFSI, IT & Telecom, Healthcare, Manufacturing, Transportation & Mobility, Other). The report projects a market size of xx Million by 2025, with a CAGR of xx% during the forecast period. Key players analyzed include SAS Institute Inc, Infosys Limited, Fair Isaac Corporation, Aptiv PLC, IBM Corporation, Google LLC, Nuance Communications, Salesforce.com Inc, Microsoft Corporation, Affectiva Inc, Amazon Web Services Inc, Fetch.ai, Oracle Corporation, Intel Corporation, and SAP SE.
Autonomous Agents Market Concentration & Dynamics
The Autonomous Agents market exhibits a moderately concentrated landscape, with a few major players holding significant market share. However, the presence of numerous smaller, specialized firms fosters a dynamic competitive environment. The market is characterized by rapid innovation, driven by advancements in AI, machine learning, and natural language processing. Regulatory frameworks are still evolving, posing both opportunities and challenges. Substitute products, particularly rule-based systems, present some competition, but the increasing complexity of tasks favors autonomous agents. End-user trends indicate a growing preference for automated solutions across various industries. M&A activity has been significant, with xx deals recorded in the historical period (2019-2024), indicating consolidation and strategic expansion within the market. This activity is expected to continue, potentially leading to further market concentration.
- Market Share: Top 5 players hold approximately xx% of the market share (2025 estimate).
- M&A Deal Count: xx deals recorded between 2019 and 2024.
- Innovation Ecosystem: Strong presence of startups and research institutions actively contributing to technological advancements.
- Regulatory Landscape: Varying regulations across different geographies create both opportunities and challenges for market expansion.
Autonomous Agents Market Industry Insights & Trends
The Autonomous Agents market is experiencing significant growth, driven by the increasing need for automation across various sectors. The market size is projected to reach xx Million by 2025, expanding to xx Million by 2033. This growth is fuelled by several factors: the rising adoption of cloud computing, the increasing demand for improved operational efficiency, and the growing need for personalized customer experiences. Technological advancements in AI and machine learning are continuously enhancing the capabilities of autonomous agents, leading to broader applications across industries. Consumer behavior is evolving towards the acceptance and expectation of intelligent, automated systems, further driving market demand. The overall market is expected to maintain a strong CAGR of xx% during the forecast period (2025-2033).
Key Markets & Segments Leading Autonomous Agents Market
The Autonomous Agents market demonstrates strong growth across various segments and regions. Large Enterprises currently dominate the market due to their higher budgets and greater need for automation. However, SMEs are showing increasing adoption rates, anticipating significant growth in the coming years. Cloud deployment is the leading segment, reflecting the benefits of scalability, accessibility, and cost-effectiveness. The BFSI and IT & Telecom sectors are currently the largest adopters, but Healthcare, Manufacturing, and Transportation & Mobility sectors are experiencing rapid growth.
- Dominant Region/Country: North America currently holds the largest market share, followed by Europe and Asia Pacific.
- Drivers by Segment:
- Cloud Deployment: Scalability, cost-effectiveness, accessibility.
- Large Enterprises: Higher budgets, complex operations requiring automation.
- BFSI: Need for fraud detection, risk management, and customer service automation.
- IT & Telecom: Network optimization, customer support, and service provisioning automation.
Autonomous Agents Market Product Developments
Recent product innovations focus on enhancing the intelligence, adaptability, and security of autonomous agents. Developments include improved natural language processing, enhanced machine learning algorithms, and more robust security protocols. Applications span diverse sectors, from customer service chatbots and fraud detection systems to autonomous vehicles and supply chain optimization tools. These advancements provide businesses with significant competitive advantages, improving operational efficiency, customer satisfaction, and decision-making.
Challenges in the Autonomous Agents Market Market
The Autonomous Agents market faces several challenges, including regulatory uncertainties surrounding data privacy and AI ethics, concerns regarding the security and reliability of autonomous systems, and potential supply chain disruptions impacting the availability of necessary components. These factors can hinder market growth and adoption, particularly in sensitive sectors like finance and healthcare. The competitive landscape also presents challenges, with established players and new entrants vying for market share.
Forces Driving Autonomous Agents Market Growth
Several factors are driving the growth of the Autonomous Agents market: technological advancements in AI and machine learning, increasing demand for automation across industries, and the growing need for personalized customer experiences. Government initiatives promoting the adoption of AI and automation further accelerate market expansion. The cost-effectiveness of autonomous agents compared to traditional solutions also contributes to their widespread adoption. For instance, the implementation of AI-powered chatbots for customer service significantly reduces labor costs.
Long-Term Growth Catalysts in Autonomous Agents Market
Long-term growth will be driven by continuous innovation in AI and machine learning, leading to more sophisticated and versatile autonomous agents. Strategic partnerships between technology providers and industry players will expand market reach and accelerate adoption. Furthermore, the expansion into new and emerging markets, such as smart cities and personalized healthcare, offers significant growth potential.
Emerging Opportunities in Autonomous Agents Market
Emerging opportunities exist in the development of specialized autonomous agents for specific industries, such as autonomous logistics and robotic process automation (RPA). The integration of autonomous agents with other technologies, such as IoT and blockchain, presents further opportunities for innovation. Personalized experiences driven by autonomous agents are also a significant area of growth.
Leading Players in the Autonomous Agents Market Sector
- SAS Institute Inc
- Infosys Limited
- Fair Isaac Corporation
- Aptiv PLC
- IBM Corporation
- Google LLC
- Nuance Communications
- Salesforce.com Inc
- Microsoft Corporation
- Affectiva Inc
- Amazon Web Services Inc
- Fetch.ai
- Oracle Corporation
- Intel Corporation
- SAP SE
Key Milestones in Autonomous Agents Market Industry
- 2020: Significant increase in investment in AI and autonomous agent development.
- 2021: Launch of several advanced autonomous agent platforms by major players.
- 2022: Increased regulatory scrutiny on data privacy related to autonomous agents.
- 2023: Several mergers and acquisitions within the autonomous agent market.
- 2024: Growing adoption of autonomous agents in the healthcare and manufacturing sectors.
Strategic Outlook for Autonomous Agents Market Market
The Autonomous Agents market presents significant growth potential, driven by ongoing technological advancements, increasing demand for automation, and the expansion into new applications. Companies focused on innovation, strategic partnerships, and targeted market expansion will be well-positioned to capitalize on this growth. The development of robust security and ethical frameworks will be crucial for continued market expansion and adoption.
Autonomous Agents Market Segmentation
-
1. Deployment Type
- 1.1. Cloud
- 1.2. On-Premises
-
2. Organization Size
- 2.1. Small & Medium-Sized Enterprises (SMEs)
- 2.2. Large Enterprises
-
3. Industry Vertical
- 3.1. BFSI
- 3.2. IT &Telecom
- 3.3. Healthcare
- 3.4. Manufacturing
- 3.5. Transportation & Mobility
- 3.6. Other Industry Verticals
Autonomous Agents Market Segmentation By Geography
- 1. North America
- 2. Europe
- 3. Asia Pacific
- 4. Latin America
- 5. Middle East
Autonomous Agents Market REPORT HIGHLIGHTS
| Aspects | Details |
|---|---|
| Study Period | 2019-2033 |
| Base Year | 2024 |
| Estimated Year | 2025 |
| Forecast Period | 2025-2033 |
| Historical Period | 2019-2024 |
| Growth Rate | CAGR of 57.00% from 2019-2033 |
| Segmentation |
|
Table of Contents
- 1. Introduction
- 1.1. Research Scope
- 1.2. Market Segmentation
- 1.3. Research Methodology
- 1.4. Definitions and Assumptions
- 2. Executive Summary
- 2.1. Introduction
- 3. Market Dynamics
- 3.1. Introduction
- 3.2. Market Drivers
- 3.2.1. ; Rising Number of AI Applications; Growing Presence of Parallel Computational Resources
- 3.3. Market Restrains
- 3.3.1. Maintaining the Privacy and Integrity of Patient Data
- 3.4. Market Trends
- 3.4.1. Transportation and Mobility Segments to Dominate the Market
- 4. Market Factor Analysis
- 4.1. Porters Five Forces
- 4.2. Supply/Value Chain
- 4.3. PESTEL analysis
- 4.4. Market Entropy
- 4.5. Patent/Trademark Analysis
- 5. Global Autonomous Agents Market Analysis, Insights and Forecast, 2019-2031
- 5.1. Market Analysis, Insights and Forecast - by Deployment Type
- 5.1.1. Cloud
- 5.1.2. On-Premises
- 5.2. Market Analysis, Insights and Forecast - by Organization Size
- 5.2.1. Small & Medium-Sized Enterprises (SMEs)
- 5.2.2. Large Enterprises
- 5.3. Market Analysis, Insights and Forecast - by Industry Vertical
- 5.3.1. BFSI
- 5.3.2. IT &Telecom
- 5.3.3. Healthcare
- 5.3.4. Manufacturing
- 5.3.5. Transportation & Mobility
- 5.3.6. Other Industry Verticals
- 5.4. Market Analysis, Insights and Forecast - by Region
- 5.4.1. North America
- 5.4.2. Europe
- 5.4.3. Asia Pacific
- 5.4.4. Latin America
- 5.4.5. Middle East
- 5.1. Market Analysis, Insights and Forecast - by Deployment Type
- 6. North America Autonomous Agents Market Analysis, Insights and Forecast, 2019-2031
- 6.1. Market Analysis, Insights and Forecast - by Deployment Type
- 6.1.1. Cloud
- 6.1.2. On-Premises
- 6.2. Market Analysis, Insights and Forecast - by Organization Size
- 6.2.1. Small & Medium-Sized Enterprises (SMEs)
- 6.2.2. Large Enterprises
- 6.3. Market Analysis, Insights and Forecast - by Industry Vertical
- 6.3.1. BFSI
- 6.3.2. IT &Telecom
- 6.3.3. Healthcare
- 6.3.4. Manufacturing
- 6.3.5. Transportation & Mobility
- 6.3.6. Other Industry Verticals
- 6.1. Market Analysis, Insights and Forecast - by Deployment Type
- 7. Europe Autonomous Agents Market Analysis, Insights and Forecast, 2019-2031
- 7.1. Market Analysis, Insights and Forecast - by Deployment Type
- 7.1.1. Cloud
- 7.1.2. On-Premises
- 7.2. Market Analysis, Insights and Forecast - by Organization Size
- 7.2.1. Small & Medium-Sized Enterprises (SMEs)
- 7.2.2. Large Enterprises
- 7.3. Market Analysis, Insights and Forecast - by Industry Vertical
- 7.3.1. BFSI
- 7.3.2. IT &Telecom
- 7.3.3. Healthcare
- 7.3.4. Manufacturing
- 7.3.5. Transportation & Mobility
- 7.3.6. Other Industry Verticals
- 7.1. Market Analysis, Insights and Forecast - by Deployment Type
- 8. Asia Pacific Autonomous Agents Market Analysis, Insights and Forecast, 2019-2031
- 8.1. Market Analysis, Insights and Forecast - by Deployment Type
- 8.1.1. Cloud
- 8.1.2. On-Premises
- 8.2. Market Analysis, Insights and Forecast - by Organization Size
- 8.2.1. Small & Medium-Sized Enterprises (SMEs)
- 8.2.2. Large Enterprises
- 8.3. Market Analysis, Insights and Forecast - by Industry Vertical
- 8.3.1. BFSI
- 8.3.2. IT &Telecom
- 8.3.3. Healthcare
- 8.3.4. Manufacturing
- 8.3.5. Transportation & Mobility
- 8.3.6. Other Industry Verticals
- 8.1. Market Analysis, Insights and Forecast - by Deployment Type
- 9. Latin America Autonomous Agents Market Analysis, Insights and Forecast, 2019-2031
- 9.1. Market Analysis, Insights and Forecast - by Deployment Type
- 9.1.1. Cloud
- 9.1.2. On-Premises
- 9.2. Market Analysis, Insights and Forecast - by Organization Size
- 9.2.1. Small & Medium-Sized Enterprises (SMEs)
- 9.2.2. Large Enterprises
- 9.3. Market Analysis, Insights and Forecast - by Industry Vertical
- 9.3.1. BFSI
- 9.3.2. IT &Telecom
- 9.3.3. Healthcare
- 9.3.4. Manufacturing
- 9.3.5. Transportation & Mobility
- 9.3.6. Other Industry Verticals
- 9.1. Market Analysis, Insights and Forecast - by Deployment Type
- 10. Middle East Autonomous Agents Market Analysis, Insights and Forecast, 2019-2031
- 10.1. Market Analysis, Insights and Forecast - by Deployment Type
- 10.1.1. Cloud
- 10.1.2. On-Premises
- 10.2. Market Analysis, Insights and Forecast - by Organization Size
- 10.2.1. Small & Medium-Sized Enterprises (SMEs)
- 10.2.2. Large Enterprises
- 10.3. Market Analysis, Insights and Forecast - by Industry Vertical
- 10.3.1. BFSI
- 10.3.2. IT &Telecom
- 10.3.3. Healthcare
- 10.3.4. Manufacturing
- 10.3.5. Transportation & Mobility
- 10.3.6. Other Industry Verticals
- 10.1. Market Analysis, Insights and Forecast - by Deployment Type
- 11. North America Autonomous Agents Market Analysis, Insights and Forecast, 2019-2031
- 11.1. Market Analysis, Insights and Forecast - By Country/Sub-region
- 11.1.1 United States
- 11.1.2 Canada
- 11.1.3 Mexico
- 12. Europe Autonomous Agents Market Analysis, Insights and Forecast, 2019-2031
- 12.1. Market Analysis, Insights and Forecast - By Country/Sub-region
- 12.1.1 Germany
- 12.1.2 United Kingdom
- 12.1.3 France
- 12.1.4 Spain
- 12.1.5 Italy
- 12.1.6 Spain
- 12.1.7 Belgium
- 12.1.8 Netherland
- 12.1.9 Nordics
- 12.1.10 Rest of Europe
- 13. Asia Pacific Autonomous Agents Market Analysis, Insights and Forecast, 2019-2031
- 13.1. Market Analysis, Insights and Forecast - By Country/Sub-region
- 13.1.1 China
- 13.1.2 Japan
- 13.1.3 India
- 13.1.4 South Korea
- 13.1.5 Southeast Asia
- 13.1.6 Australia
- 13.1.7 Indonesia
- 13.1.8 Phillipes
- 13.1.9 Singapore
- 13.1.10 Thailandc
- 13.1.11 Rest of Asia Pacific
- 14. South America Autonomous Agents Market Analysis, Insights and Forecast, 2019-2031
- 14.1. Market Analysis, Insights and Forecast - By Country/Sub-region
- 14.1.1 Brazil
- 14.1.2 Argentina
- 14.1.3 Peru
- 14.1.4 Chile
- 14.1.5 Colombia
- 14.1.6 Ecuador
- 14.1.7 Venezuela
- 14.1.8 Rest of South America
- 15. North America Autonomous Agents Market Analysis, Insights and Forecast, 2019-2031
- 15.1. Market Analysis, Insights and Forecast - By Country/Sub-region
- 15.1.1 United States
- 15.1.2 Canada
- 15.1.3 Mexico
- 16. MEA Autonomous Agents Market Analysis, Insights and Forecast, 2019-2031
- 16.1. Market Analysis, Insights and Forecast - By Country/Sub-region
- 16.1.1 United Arab Emirates
- 16.1.2 Saudi Arabia
- 16.1.3 South Africa
- 16.1.4 Rest of Middle East and Africa
- 17. Competitive Analysis
- 17.1. Global Market Share Analysis 2024
- 17.2. Company Profiles
- 17.2.1 SAS Institute Inc
- 17.2.1.1. Overview
- 17.2.1.2. Products
- 17.2.1.3. SWOT Analysis
- 17.2.1.4. Recent Developments
- 17.2.1.5. Financials (Based on Availability)
- 17.2.2 Infosys Limited
- 17.2.2.1. Overview
- 17.2.2.2. Products
- 17.2.2.3. SWOT Analysis
- 17.2.2.4. Recent Developments
- 17.2.2.5. Financials (Based on Availability)
- 17.2.3 Fair Isaac Corporation
- 17.2.3.1. Overview
- 17.2.3.2. Products
- 17.2.3.3. SWOT Analysis
- 17.2.3.4. Recent Developments
- 17.2.3.5. Financials (Based on Availability)
- 17.2.4 Aptiv PLC*List Not Exhaustive
- 17.2.4.1. Overview
- 17.2.4.2. Products
- 17.2.4.3. SWOT Analysis
- 17.2.4.4. Recent Developments
- 17.2.4.5. Financials (Based on Availability)
- 17.2.5 IBM Corporation
- 17.2.5.1. Overview
- 17.2.5.2. Products
- 17.2.5.3. SWOT Analysis
- 17.2.5.4. Recent Developments
- 17.2.5.5. Financials (Based on Availability)
- 17.2.6 Google LLC
- 17.2.6.1. Overview
- 17.2.6.2. Products
- 17.2.6.3. SWOT Analysis
- 17.2.6.4. Recent Developments
- 17.2.6.5. Financials (Based on Availability)
- 17.2.7 Nuance Communications
- 17.2.7.1. Overview
- 17.2.7.2. Products
- 17.2.7.3. SWOT Analysis
- 17.2.7.4. Recent Developments
- 17.2.7.5. Financials (Based on Availability)
- 17.2.8 Salesforce com Inc
- 17.2.8.1. Overview
- 17.2.8.2. Products
- 17.2.8.3. SWOT Analysis
- 17.2.8.4. Recent Developments
- 17.2.8.5. Financials (Based on Availability)
- 17.2.9 Microsoft Corporation
- 17.2.9.1. Overview
- 17.2.9.2. Products
- 17.2.9.3. SWOT Analysis
- 17.2.9.4. Recent Developments
- 17.2.9.5. Financials (Based on Availability)
- 17.2.10 Affectiva Inc
- 17.2.10.1. Overview
- 17.2.10.2. Products
- 17.2.10.3. SWOT Analysis
- 17.2.10.4. Recent Developments
- 17.2.10.5. Financials (Based on Availability)
- 17.2.11 Amazon Web Services Inc
- 17.2.11.1. Overview
- 17.2.11.2. Products
- 17.2.11.3. SWOT Analysis
- 17.2.11.4. Recent Developments
- 17.2.11.5. Financials (Based on Availability)
- 17.2.12 Fetch ai
- 17.2.12.1. Overview
- 17.2.12.2. Products
- 17.2.12.3. SWOT Analysis
- 17.2.12.4. Recent Developments
- 17.2.12.5. Financials (Based on Availability)
- 17.2.13 Oracle Corporation
- 17.2.13.1. Overview
- 17.2.13.2. Products
- 17.2.13.3. SWOT Analysis
- 17.2.13.4. Recent Developments
- 17.2.13.5. Financials (Based on Availability)
- 17.2.14 Intel Corporation
- 17.2.14.1. Overview
- 17.2.14.2. Products
- 17.2.14.3. SWOT Analysis
- 17.2.14.4. Recent Developments
- 17.2.14.5. Financials (Based on Availability)
- 17.2.15 SAP SE
- 17.2.15.1. Overview
- 17.2.15.2. Products
- 17.2.15.3. SWOT Analysis
- 17.2.15.4. Recent Developments
- 17.2.15.5. Financials (Based on Availability)
- 17.2.1 SAS Institute Inc
List of Figures
- Figure 1: Global Autonomous Agents Market Revenue Breakdown (Million, %) by Region 2024 & 2032
- Figure 2: North America Autonomous Agents Market Revenue (Million), by Country 2024 & 2032
- Figure 3: North America Autonomous Agents Market Revenue Share (%), by Country 2024 & 2032
- Figure 4: Europe Autonomous Agents Market Revenue (Million), by Country 2024 & 2032
- Figure 5: Europe Autonomous Agents Market Revenue Share (%), by Country 2024 & 2032
- Figure 6: Asia Pacific Autonomous Agents Market Revenue (Million), by Country 2024 & 2032
- Figure 7: Asia Pacific Autonomous Agents Market Revenue Share (%), by Country 2024 & 2032
- Figure 8: South America Autonomous Agents Market Revenue (Million), by Country 2024 & 2032
- Figure 9: South America Autonomous Agents Market Revenue Share (%), by Country 2024 & 2032
- Figure 10: North America Autonomous Agents Market Revenue (Million), by Country 2024 & 2032
- Figure 11: North America Autonomous Agents Market Revenue Share (%), by Country 2024 & 2032
- Figure 12: MEA Autonomous Agents Market Revenue (Million), by Country 2024 & 2032
- Figure 13: MEA Autonomous Agents Market Revenue Share (%), by Country 2024 & 2032
- Figure 14: North America Autonomous Agents Market Revenue (Million), by Deployment Type 2024 & 2032
- Figure 15: North America Autonomous Agents Market Revenue Share (%), by Deployment Type 2024 & 2032
- Figure 16: North America Autonomous Agents Market Revenue (Million), by Organization Size 2024 & 2032
- Figure 17: North America Autonomous Agents Market Revenue Share (%), by Organization Size 2024 & 2032
- Figure 18: North America Autonomous Agents Market Revenue (Million), by Industry Vertical 2024 & 2032
- Figure 19: North America Autonomous Agents Market Revenue Share (%), by Industry Vertical 2024 & 2032
- Figure 20: North America Autonomous Agents Market Revenue (Million), by Country 2024 & 2032
- Figure 21: North America Autonomous Agents Market Revenue Share (%), by Country 2024 & 2032
- Figure 22: Europe Autonomous Agents Market Revenue (Million), by Deployment Type 2024 & 2032
- Figure 23: Europe Autonomous Agents Market Revenue Share (%), by Deployment Type 2024 & 2032
- Figure 24: Europe Autonomous Agents Market Revenue (Million), by Organization Size 2024 & 2032
- Figure 25: Europe Autonomous Agents Market Revenue Share (%), by Organization Size 2024 & 2032
- Figure 26: Europe Autonomous Agents Market Revenue (Million), by Industry Vertical 2024 & 2032
- Figure 27: Europe Autonomous Agents Market Revenue Share (%), by Industry Vertical 2024 & 2032
- Figure 28: Europe Autonomous Agents Market Revenue (Million), by Country 2024 & 2032
- Figure 29: Europe Autonomous Agents Market Revenue Share (%), by Country 2024 & 2032
- Figure 30: Asia Pacific Autonomous Agents Market Revenue (Million), by Deployment Type 2024 & 2032
- Figure 31: Asia Pacific Autonomous Agents Market Revenue Share (%), by Deployment Type 2024 & 2032
- Figure 32: Asia Pacific Autonomous Agents Market Revenue (Million), by Organization Size 2024 & 2032
- Figure 33: Asia Pacific Autonomous Agents Market Revenue Share (%), by Organization Size 2024 & 2032
- Figure 34: Asia Pacific Autonomous Agents Market Revenue (Million), by Industry Vertical 2024 & 2032
- Figure 35: Asia Pacific Autonomous Agents Market Revenue Share (%), by Industry Vertical 2024 & 2032
- Figure 36: Asia Pacific Autonomous Agents Market Revenue (Million), by Country 2024 & 2032
- Figure 37: Asia Pacific Autonomous Agents Market Revenue Share (%), by Country 2024 & 2032
- Figure 38: Latin America Autonomous Agents Market Revenue (Million), by Deployment Type 2024 & 2032
- Figure 39: Latin America Autonomous Agents Market Revenue Share (%), by Deployment Type 2024 & 2032
- Figure 40: Latin America Autonomous Agents Market Revenue (Million), by Organization Size 2024 & 2032
- Figure 41: Latin America Autonomous Agents Market Revenue Share (%), by Organization Size 2024 & 2032
- Figure 42: Latin America Autonomous Agents Market Revenue (Million), by Industry Vertical 2024 & 2032
- Figure 43: Latin America Autonomous Agents Market Revenue Share (%), by Industry Vertical 2024 & 2032
- Figure 44: Latin America Autonomous Agents Market Revenue (Million), by Country 2024 & 2032
- Figure 45: Latin America Autonomous Agents Market Revenue Share (%), by Country 2024 & 2032
- Figure 46: Middle East Autonomous Agents Market Revenue (Million), by Deployment Type 2024 & 2032
- Figure 47: Middle East Autonomous Agents Market Revenue Share (%), by Deployment Type 2024 & 2032
- Figure 48: Middle East Autonomous Agents Market Revenue (Million), by Organization Size 2024 & 2032
- Figure 49: Middle East Autonomous Agents Market Revenue Share (%), by Organization Size 2024 & 2032
- Figure 50: Middle East Autonomous Agents Market Revenue (Million), by Industry Vertical 2024 & 2032
- Figure 51: Middle East Autonomous Agents Market Revenue Share (%), by Industry Vertical 2024 & 2032
- Figure 52: Middle East Autonomous Agents Market Revenue (Million), by Country 2024 & 2032
- Figure 53: Middle East Autonomous Agents Market Revenue Share (%), by Country 2024 & 2032
List of Tables
- Table 1: Global Autonomous Agents Market Revenue Million Forecast, by Region 2019 & 2032
- Table 2: Global Autonomous Agents Market Revenue Million Forecast, by Deployment Type 2019 & 2032
- Table 3: Global Autonomous Agents Market Revenue Million Forecast, by Organization Size 2019 & 2032
- Table 4: Global Autonomous Agents Market Revenue Million Forecast, by Industry Vertical 2019 & 2032
- Table 5: Global Autonomous Agents Market Revenue Million Forecast, by Region 2019 & 2032
- Table 6: Global Autonomous Agents Market Revenue Million Forecast, by Country 2019 & 2032
- Table 7: United States Autonomous Agents Market Revenue (Million) Forecast, by Application 2019 & 2032
- Table 8: Canada Autonomous Agents Market Revenue (Million) Forecast, by Application 2019 & 2032
- Table 9: Mexico Autonomous Agents Market Revenue (Million) Forecast, by Application 2019 & 2032
- Table 10: Global Autonomous Agents Market Revenue Million Forecast, by Country 2019 & 2032
- Table 11: Germany Autonomous Agents Market Revenue (Million) Forecast, by Application 2019 & 2032
- Table 12: United Kingdom Autonomous Agents Market Revenue (Million) Forecast, by Application 2019 & 2032
- Table 13: France Autonomous Agents Market Revenue (Million) Forecast, by Application 2019 & 2032
- Table 14: Spain Autonomous Agents Market Revenue (Million) Forecast, by Application 2019 & 2032
- Table 15: Italy Autonomous Agents Market Revenue (Million) Forecast, by Application 2019 & 2032
- Table 16: Spain Autonomous Agents Market Revenue (Million) Forecast, by Application 2019 & 2032
- Table 17: Belgium Autonomous Agents Market Revenue (Million) Forecast, by Application 2019 & 2032
- Table 18: Netherland Autonomous Agents Market Revenue (Million) Forecast, by Application 2019 & 2032
- Table 19: Nordics Autonomous Agents Market Revenue (Million) Forecast, by Application 2019 & 2032
- Table 20: Rest of Europe Autonomous Agents Market Revenue (Million) Forecast, by Application 2019 & 2032
- Table 21: Global Autonomous Agents Market Revenue Million Forecast, by Country 2019 & 2032
- Table 22: China Autonomous Agents Market Revenue (Million) Forecast, by Application 2019 & 2032
- Table 23: Japan Autonomous Agents Market Revenue (Million) Forecast, by Application 2019 & 2032
- Table 24: India Autonomous Agents Market Revenue (Million) Forecast, by Application 2019 & 2032
- Table 25: South Korea Autonomous Agents Market Revenue (Million) Forecast, by Application 2019 & 2032
- Table 26: Southeast Asia Autonomous Agents Market Revenue (Million) Forecast, by Application 2019 & 2032
- Table 27: Australia Autonomous Agents Market Revenue (Million) Forecast, by Application 2019 & 2032
- Table 28: Indonesia Autonomous Agents Market Revenue (Million) Forecast, by Application 2019 & 2032
- Table 29: Phillipes Autonomous Agents Market Revenue (Million) Forecast, by Application 2019 & 2032
- Table 30: Singapore Autonomous Agents Market Revenue (Million) Forecast, by Application 2019 & 2032
- Table 31: Thailandc Autonomous Agents Market Revenue (Million) Forecast, by Application 2019 & 2032
- Table 32: Rest of Asia Pacific Autonomous Agents Market Revenue (Million) Forecast, by Application 2019 & 2032
- Table 33: Global Autonomous Agents Market Revenue Million Forecast, by Country 2019 & 2032
- Table 34: Brazil Autonomous Agents Market Revenue (Million) Forecast, by Application 2019 & 2032
- Table 35: Argentina Autonomous Agents Market Revenue (Million) Forecast, by Application 2019 & 2032
- Table 36: Peru Autonomous Agents Market Revenue (Million) Forecast, by Application 2019 & 2032
- Table 37: Chile Autonomous Agents Market Revenue (Million) Forecast, by Application 2019 & 2032
- Table 38: Colombia Autonomous Agents Market Revenue (Million) Forecast, by Application 2019 & 2032
- Table 39: Ecuador Autonomous Agents Market Revenue (Million) Forecast, by Application 2019 & 2032
- Table 40: Venezuela Autonomous Agents Market Revenue (Million) Forecast, by Application 2019 & 2032
- Table 41: Rest of South America Autonomous Agents Market Revenue (Million) Forecast, by Application 2019 & 2032
- Table 42: Global Autonomous Agents Market Revenue Million Forecast, by Country 2019 & 2032
- Table 43: United States Autonomous Agents Market Revenue (Million) Forecast, by Application 2019 & 2032
- Table 44: Canada Autonomous Agents Market Revenue (Million) Forecast, by Application 2019 & 2032
- Table 45: Mexico Autonomous Agents Market Revenue (Million) Forecast, by Application 2019 & 2032
- Table 46: Global Autonomous Agents Market Revenue Million Forecast, by Country 2019 & 2032
- Table 47: United Arab Emirates Autonomous Agents Market Revenue (Million) Forecast, by Application 2019 & 2032
- Table 48: Saudi Arabia Autonomous Agents Market Revenue (Million) Forecast, by Application 2019 & 2032
- Table 49: South Africa Autonomous Agents Market Revenue (Million) Forecast, by Application 2019 & 2032
- Table 50: Rest of Middle East and Africa Autonomous Agents Market Revenue (Million) Forecast, by Application 2019 & 2032
- Table 51: Global Autonomous Agents Market Revenue Million Forecast, by Deployment Type 2019 & 2032
- Table 52: Global Autonomous Agents Market Revenue Million Forecast, by Organization Size 2019 & 2032
- Table 53: Global Autonomous Agents Market Revenue Million Forecast, by Industry Vertical 2019 & 2032
- Table 54: Global Autonomous Agents Market Revenue Million Forecast, by Country 2019 & 2032
- Table 55: Global Autonomous Agents Market Revenue Million Forecast, by Deployment Type 2019 & 2032
- Table 56: Global Autonomous Agents Market Revenue Million Forecast, by Organization Size 2019 & 2032
- Table 57: Global Autonomous Agents Market Revenue Million Forecast, by Industry Vertical 2019 & 2032
- Table 58: Global Autonomous Agents Market Revenue Million Forecast, by Country 2019 & 2032
- Table 59: Global Autonomous Agents Market Revenue Million Forecast, by Deployment Type 2019 & 2032
- Table 60: Global Autonomous Agents Market Revenue Million Forecast, by Organization Size 2019 & 2032
- Table 61: Global Autonomous Agents Market Revenue Million Forecast, by Industry Vertical 2019 & 2032
- Table 62: Global Autonomous Agents Market Revenue Million Forecast, by Country 2019 & 2032
- Table 63: Global Autonomous Agents Market Revenue Million Forecast, by Deployment Type 2019 & 2032
- Table 64: Global Autonomous Agents Market Revenue Million Forecast, by Organization Size 2019 & 2032
- Table 65: Global Autonomous Agents Market Revenue Million Forecast, by Industry Vertical 2019 & 2032
- Table 66: Global Autonomous Agents Market Revenue Million Forecast, by Country 2019 & 2032
- Table 67: Global Autonomous Agents Market Revenue Million Forecast, by Deployment Type 2019 & 2032
- Table 68: Global Autonomous Agents Market Revenue Million Forecast, by Organization Size 2019 & 2032
- Table 69: Global Autonomous Agents Market Revenue Million Forecast, by Industry Vertical 2019 & 2032
- Table 70: Global Autonomous Agents Market Revenue Million Forecast, by Country 2019 & 2032
Frequently Asked Questions
1. What is the projected Compound Annual Growth Rate (CAGR) of the Autonomous Agents Market?
The projected CAGR is approximately 57.00%.
2. Which companies are prominent players in the Autonomous Agents Market?
Key companies in the market include SAS Institute Inc, Infosys Limited, Fair Isaac Corporation, Aptiv PLC*List Not Exhaustive, IBM Corporation, Google LLC, Nuance Communications, Salesforce com Inc, Microsoft Corporation, Affectiva Inc, Amazon Web Services Inc, Fetch ai, Oracle Corporation, Intel Corporation, SAP SE.
3. What are the main segments of the Autonomous Agents Market?
The market segments include Deployment Type, Organization Size, Industry Vertical.
4. Can you provide details about the market size?
The market size is estimated to be USD XX Million as of 2022.
5. What are some drivers contributing to market growth?
; Rising Number of AI Applications; Growing Presence of Parallel Computational Resources.
6. What are the notable trends driving market growth?
Transportation and Mobility Segments to Dominate the Market.
7. Are there any restraints impacting market growth?
Maintaining the Privacy and Integrity of Patient Data.
8. Can you provide examples of recent developments in the market?
N/A
9. What pricing options are available for accessing the report?
Pricing options include single-user, multi-user, and enterprise licenses priced at USD 4750, USD 5250, and USD 8750 respectively.
10. Is the market size provided in terms of value or volume?
The market size is provided in terms of value, measured in Million.
11. Are there any specific market keywords associated with the report?
Yes, the market keyword associated with the report is "Autonomous Agents Market," which aids in identifying and referencing the specific market segment covered.
12. How do I determine which pricing option suits my needs best?
The pricing options vary based on user requirements and access needs. Individual users may opt for single-user licenses, while businesses requiring broader access may choose multi-user or enterprise licenses for cost-effective access to the report.
13. Are there any additional resources or data provided in the Autonomous Agents Market report?
While the report offers comprehensive insights, it's advisable to review the specific contents or supplementary materials provided to ascertain if additional resources or data are available.
14. How can I stay updated on further developments or reports in the Autonomous Agents Market?
To stay informed about further developments, trends, and reports in the Autonomous Agents Market, consider subscribing to industry newsletters, following relevant companies and organizations, or regularly checking reputable industry news sources and publications.
Methodology
Step 1 - Identification of Relevant Samples Size from Population Database


Step 2 - Approaches for Defining Global Market Size (Value, Volume* & Price*)

Note*: In applicable scenarios
Step 3 - Data Sources
Primary Research
- Web Analytics
- Survey Reports
- Research Institute
- Latest Research Reports
- Opinion Leaders
Secondary Research
- Annual Reports
- White Paper
- Latest Press Release
- Industry Association
- Paid Database
- Investor Presentations

Step 4 - Data Triangulation
Involves using different sources of information in order to increase the validity of a study
These sources are likely to be stakeholders in a program - participants, other researchers, program staff, other community members, and so on.
Then we put all data in single framework & apply various statistical tools to find out the dynamic on the market.
During the analysis stage, feedback from the stakeholder groups would be compared to determine areas of agreement as well as areas of divergence
