

Key Insights
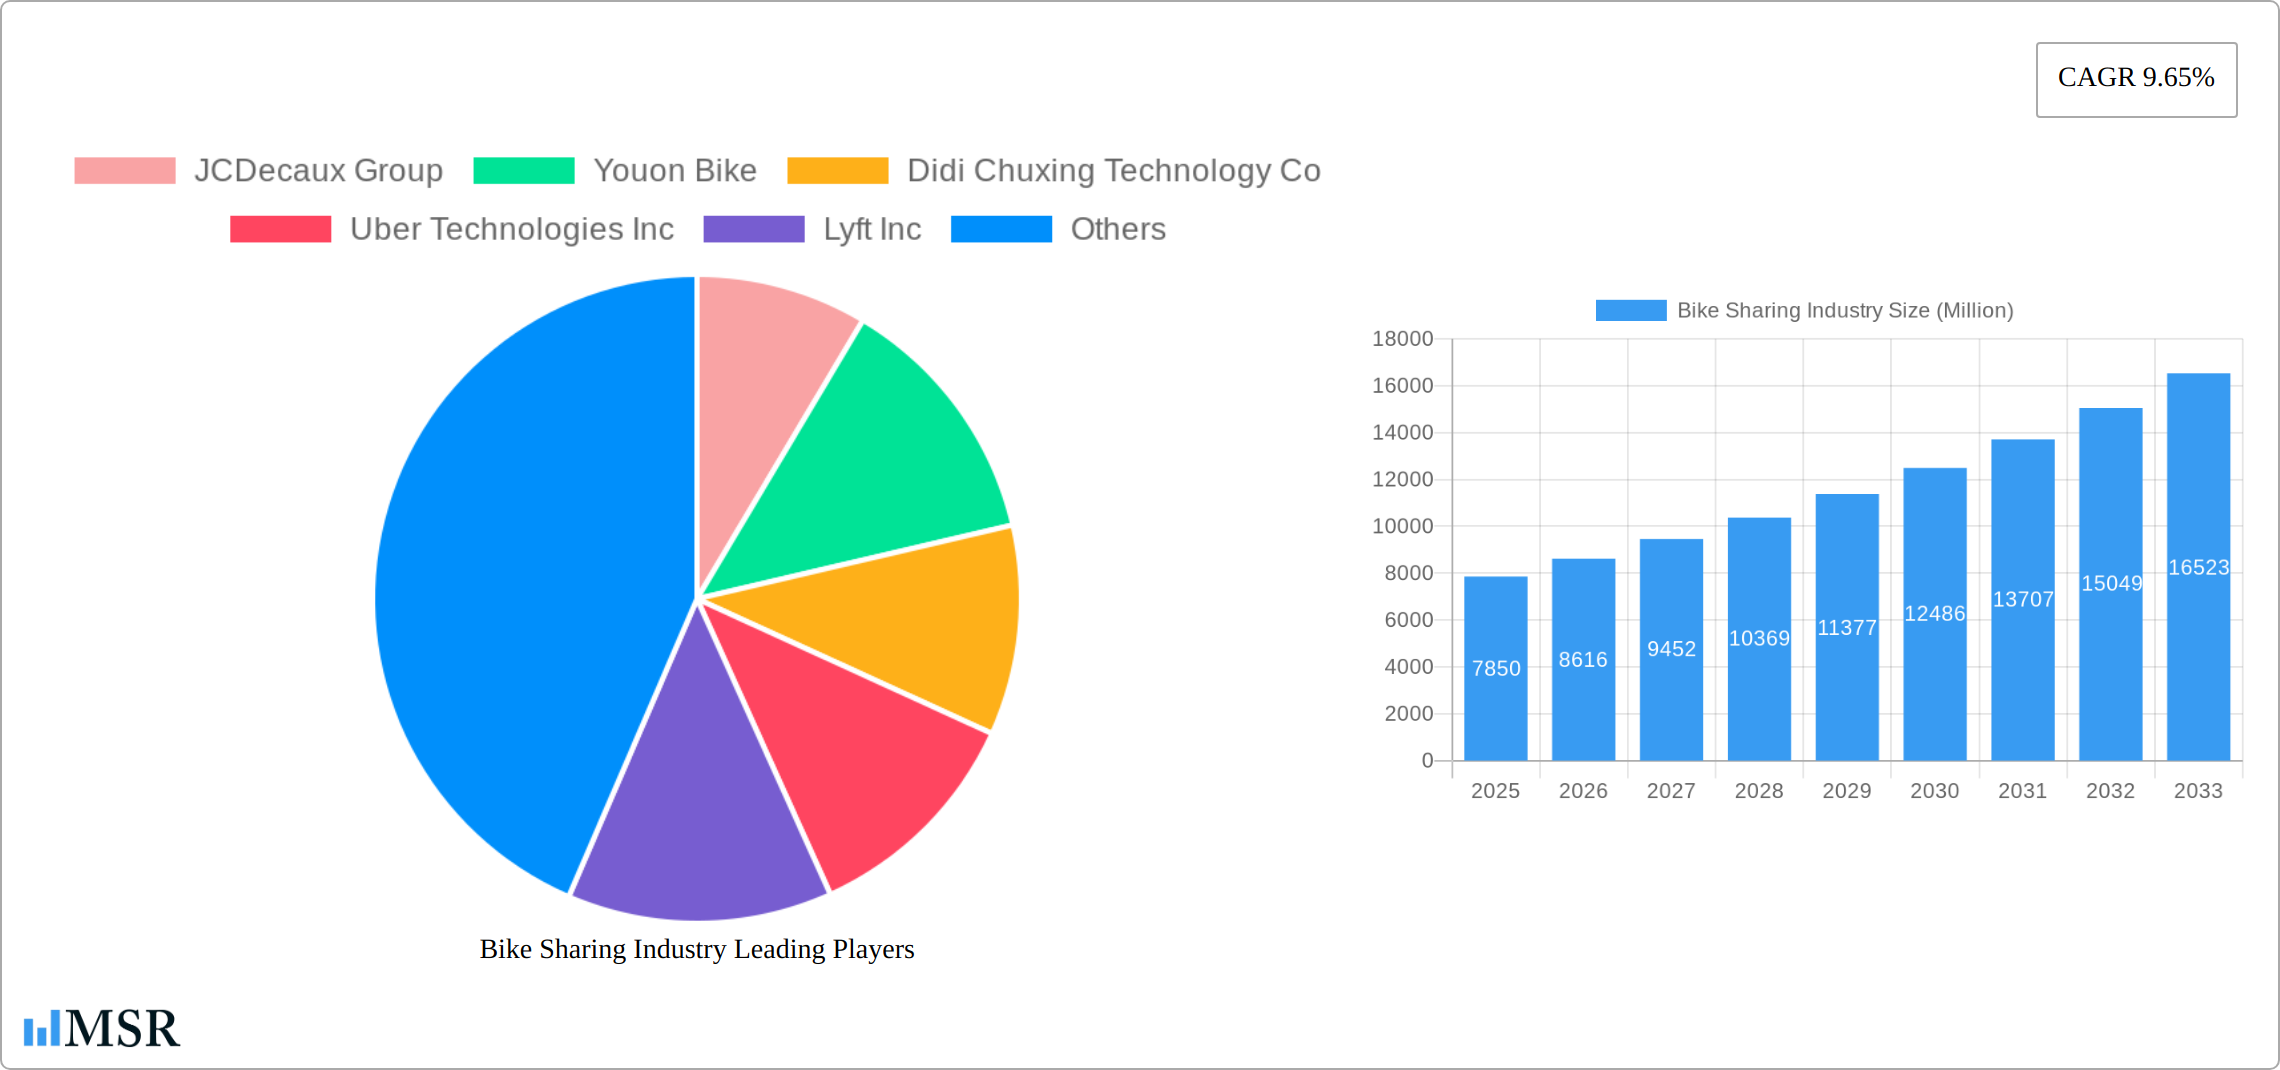
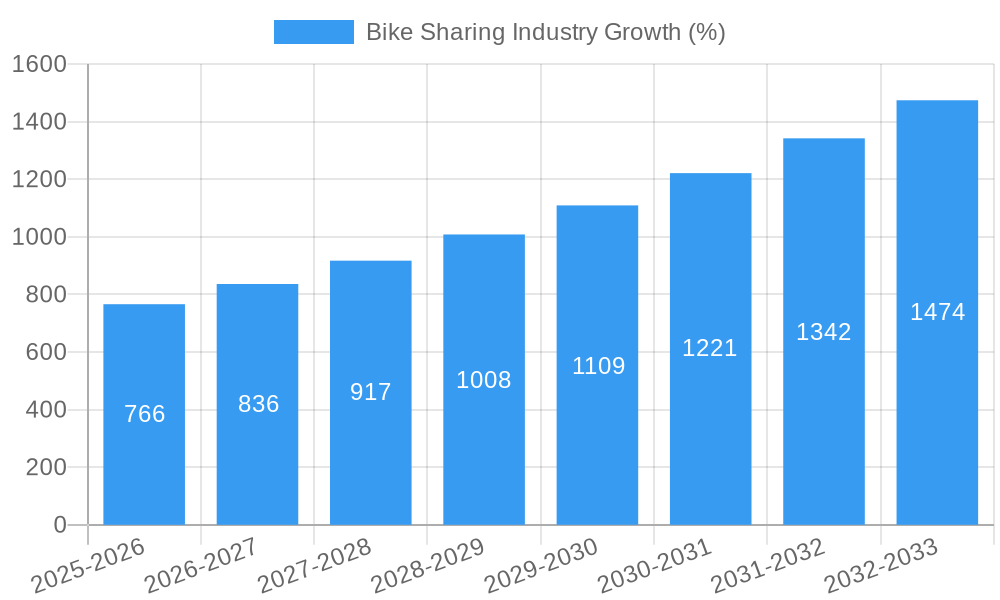
The global bike-sharing market, valued at $7.85 billion in 2025, is projected to experience robust growth, driven by increasing urbanization, rising environmental concerns, and the growing popularity of micromobility solutions. The market's Compound Annual Growth Rate (CAGR) of 9.65% from 2025 to 2033 indicates a significant expansion, with the market size expected to exceed $18 billion by 2033. Several factors contribute to this growth. Technological advancements, such as improved e-bike technology and sophisticated dockless systems, are enhancing user experience and expanding the market's reach. Government initiatives promoting sustainable transportation and reducing traffic congestion further fuel market expansion. The segmentation reveals that e-bikes are gaining traction, surpassing traditional bikes in growth, fueled by convenience and longer travel distances. Dockless systems dominate the sharing segment due to their flexibility and ease of use, although docked systems retain a significant presence in specific urban environments. Key players like JCDecaux Group, Didi Chuxing, and Uber are actively shaping the market through strategic partnerships, technological innovations, and expansion into new geographical areas.
The market's growth is, however, subject to certain restraints. Regulatory hurdles, including permit requirements and operational regulations, can hinder expansion in various regions. Concerns regarding bike safety and security, along with issues of vandalism and theft, also pose challenges. Competition among established players and new entrants is intense, impacting pricing strategies and profitability. Furthermore, the market's success is heavily reliant on effective infrastructure development, including dedicated bike lanes and charging stations for e-bikes. Addressing these challenges through proactive strategies and collaborative efforts will be crucial for sustainable and inclusive growth of the bike-sharing industry in the coming years. Regional variations in market penetration and growth rates are expected, with Asia-Pacific potentially leading the way due to high population density and increasing adoption of shared mobility services.
Bike Sharing Industry Report: 2019-2033
This comprehensive report provides an in-depth analysis of the global bike-sharing market, encompassing the period 2019-2033. With a focus on market dynamics, key players, and future trends, this report is essential for investors, industry stakeholders, and anyone seeking to understand this rapidly evolving sector. The report leverages extensive data analysis to project a market size of USD xx Million by 2033, with a CAGR of xx% during the forecast period (2025-2033).
Bike Sharing Industry Market Concentration & Dynamics
The global bike-sharing market exhibits a moderately concentrated landscape, with a few major players holding significant market share. However, the market is also characterized by a dynamic competitive environment fueled by continuous innovation and evolving consumer preferences. The market share of the top 5 players, including JCDecaux Group, Uber Technologies Inc, and Lyft Inc, is estimated at xx% in 2025. Smaller players and startups continue to enter the market, leading to intense competition.
- Market Concentration: The Herfindahl-Hirschman Index (HHI) is estimated at xx, suggesting a moderately concentrated market.
- Innovation Ecosystems: Rapid technological advancements in e-bikes, GPS tracking, and mobile payment systems are driving innovation.
- Regulatory Frameworks: Varying regulations across different geographies significantly impact market expansion and operations. Licensing requirements and safety standards vary widely.
- Substitute Products: Public transportation, ride-hailing services, and personal vehicle ownership represent key substitute products.
- End-User Trends: Growing awareness of environmental concerns and the need for sustainable transportation solutions are fueling market growth. Increased urban population density is another key driver.
- M&A Activities: The bike-sharing market has witnessed xx M&A deals between 2019 and 2024, primarily focused on consolidation and expansion into new markets.
Bike Sharing Industry Industry Insights & Trends
The global bike-sharing market is experiencing significant growth, driven by several factors. The market size in 2025 is estimated at USD xx Million, representing a substantial increase from USD xx Million in 2019. The rise of e-bikes is a particularly strong trend, offering enhanced convenience and longer travel distances. Changing consumer behavior, particularly among millennials and Gen Z who prioritize sustainability and shared mobility solutions, fuels the market. Technological disruptions like the use of AI-powered predictive maintenance and smart locking systems are enhancing operational efficiency and user experience. Furthermore, government initiatives promoting sustainable urban transportation are creating a favorable regulatory environment in many regions. The increasing adoption of dockless systems is also contributing to market expansion. However, challenges such as vandalism, theft, and effective maintenance remain.
Key Markets & Segments Leading Bike Sharing Industry
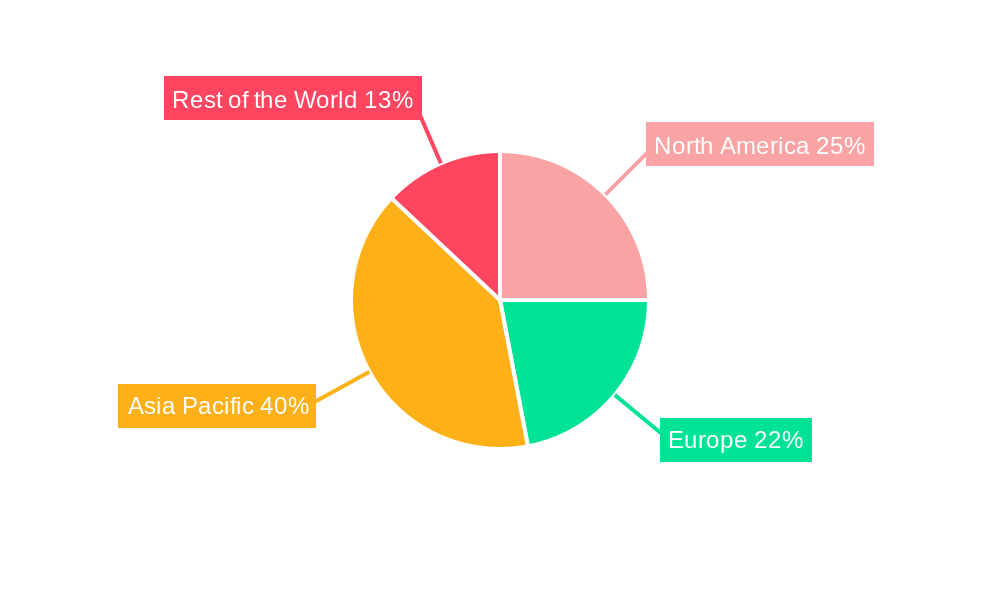
The Asia-Pacific region currently dominates the bike-sharing market, driven by high population density, increasing urbanization, and growing government support for sustainable transportation. Within this region, China and India are key markets. The e-bike segment is experiencing the fastest growth, outpacing the traditional bike segment due to its enhanced convenience and utility. Dockless systems are gaining popularity over docked systems owing to their flexibility and ease of use.
- Dominant Region: Asia-Pacific
- Dominant Country: China
- Fastest-Growing Segment: E-bikes
- Most Popular Sharing System: Dockless
Drivers for Asia-Pacific Dominance:
- Rapid urbanization and increasing population density
- Growing environmental awareness and government support for sustainable transportation
- Rising disposable incomes and increasing adoption of shared mobility services
- Favorable regulatory environment in certain regions
Bike Sharing Industry Product Developments
Recent product innovations focus on enhancing user experience and operational efficiency. This includes the integration of smart locking systems, improved battery technology for e-bikes, and advanced GPS tracking capabilities. The development of electric cargo bikes caters to the last-mile delivery market, while improved durability and theft prevention measures enhance the longevity and security of bikes. These advancements create competitive edges by improving operational efficiency, enhancing user experience, and expanding market reach.
Challenges in the Bike Sharing Industry Market
The bike-sharing market faces several challenges, including regulatory hurdles (permitting and licensing variations), supply chain disruptions affecting bike availability and repair parts, and intense competition from established players and new entrants. These factors have led to a decrease in profitability for some operators and market consolidation. Vandalism and theft also represent significant operational costs.
Forces Driving Bike Sharing Industry Growth
Several factors drive the growth of the bike-sharing industry. These include:
- Technological advancements: Improved battery technology, smart locking systems, and GPS tracking.
- Economic factors: Rising disposable incomes and the affordability of bike-sharing services compared to car ownership.
- Regulatory support: Government incentives and policies supporting sustainable transportation.
- Environmental concerns: Growing awareness of environmental sustainability and the need for greener transportation alternatives.
Long-Term Growth Catalysts in the Bike Sharing Industry
Long-term growth will be fueled by continued innovation in e-bike technology, strategic partnerships with urban planners and transportation authorities, and expansion into new geographic markets, particularly in developing countries with rapidly growing urban populations. The integration of bike-sharing systems with other forms of micro-mobility, such as scooters and e-scooters, also represents a key growth opportunity.
Emerging Opportunities in Bike Sharing Industry
Emerging opportunities include the integration of bike-sharing with other micro-mobility options, expansion into suburban and rural areas, and the development of specialized bike-sharing programs for specific demographics (e.g., tourists, commuters). Subscription models and personalized user experiences also present promising avenues for growth.
Leading Players in the Bike Sharing Industry Sector
- JCDecaux Group
- Youon Bike
- Didi Chuxing Technology Co
- Uber Technologies Inc
- Lyft Inc
- Bluegogo
- Hellobike
- Meituan Bik
- Bird Rides Inc
- Neutron Holdings Inc
Key Milestones in Bike Sharing Industry Industry
- December 2023: USD 23 Million investment in Tembici to expand bike-sharing in Latin America. This signifies increased investor confidence and potential for market expansion in emerging markets.
- March 2023: MYBYK launches electric bike variants, expanding product offerings and targeting both personal and commercial use cases. This demonstrates product innovation and diversification within the industry.
- March 2023: Brighton and Hove launches a bike-sharing scheme with Beryl, showcasing the growing adoption of bike-sharing in smaller cities and towns. This indicates potential for wider market penetration beyond major urban centers.
Strategic Outlook for Bike Sharing Industry Market
The future of the bike-sharing market appears bright, with continued growth expected through 2033. Strategic opportunities include focusing on technological innovation, expanding into underserved markets, and fostering strategic partnerships with local governments and businesses. Companies that successfully adapt to evolving consumer preferences and address operational challenges will be best positioned to capitalize on the market's long-term growth potential.
Bike Sharing Industry Segmentation
-
1. Bike
- 1.1. Traditional/Regular Bike
- 1.2. E-bike
-
2. Sharing System
- 2.1. Docked
- 2.2. Dockless
Bike Sharing Industry Segmentation By Geography
- 1. North America
- 2. Europe
- 3. Asia Pacific
- 4. Rest of the World
Bike Sharing Industry REPORT HIGHLIGHTS
| Aspects | Details |
|---|---|
| Study Period | 2019-2033 |
| Base Year | 2024 |
| Estimated Year | 2025 |
| Forecast Period | 2025-2033 |
| Historical Period | 2019-2024 |
| Growth Rate | CAGR of 9.65% from 2019-2033 |
| Segmentation |
|
Table of Contents
- 1. Introduction
- 1.1. Research Scope
- 1.2. Market Segmentation
- 1.3. Research Methodology
- 1.4. Definitions and Assumptions
- 2. Executive Summary
- 2.1. Introduction
- 3. Market Dynamics
- 3.1. Introduction
- 3.2. Market Drivers
- 3.2.1. Increasing Inclusion of E-bikes in the Sharing Fleet
- 3.3. Market Restrains
- 3.3.1. Limited Infrastructure May Hinder Market Growth
- 3.4. Market Trends
- 3.4.1. E-bike Segment Expected to be the Fastest-growing Segment Over the Forecast Period
- 4. Market Factor Analysis
- 4.1. Porters Five Forces
- 4.2. Supply/Value Chain
- 4.3. PESTEL analysis
- 4.4. Market Entropy
- 4.5. Patent/Trademark Analysis
- 5. Global Bike Sharing Industry Analysis, Insights and Forecast, 2019-2031
- 5.1. Market Analysis, Insights and Forecast - by Bike
- 5.1.1. Traditional/Regular Bike
- 5.1.2. E-bike
- 5.2. Market Analysis, Insights and Forecast - by Sharing System
- 5.2.1. Docked
- 5.2.2. Dockless
- 5.3. Market Analysis, Insights and Forecast - by Region
- 5.3.1. North America
- 5.3.2. Europe
- 5.3.3. Asia Pacific
- 5.3.4. Rest of the World
- 5.1. Market Analysis, Insights and Forecast - by Bike
- 6. North America Bike Sharing Industry Analysis, Insights and Forecast, 2019-2031
- 6.1. Market Analysis, Insights and Forecast - by Bike
- 6.1.1. Traditional/Regular Bike
- 6.1.2. E-bike
- 6.2. Market Analysis, Insights and Forecast - by Sharing System
- 6.2.1. Docked
- 6.2.2. Dockless
- 6.1. Market Analysis, Insights and Forecast - by Bike
- 7. Europe Bike Sharing Industry Analysis, Insights and Forecast, 2019-2031
- 7.1. Market Analysis, Insights and Forecast - by Bike
- 7.1.1. Traditional/Regular Bike
- 7.1.2. E-bike
- 7.2. Market Analysis, Insights and Forecast - by Sharing System
- 7.2.1. Docked
- 7.2.2. Dockless
- 7.1. Market Analysis, Insights and Forecast - by Bike
- 8. Asia Pacific Bike Sharing Industry Analysis, Insights and Forecast, 2019-2031
- 8.1. Market Analysis, Insights and Forecast - by Bike
- 8.1.1. Traditional/Regular Bike
- 8.1.2. E-bike
- 8.2. Market Analysis, Insights and Forecast - by Sharing System
- 8.2.1. Docked
- 8.2.2. Dockless
- 8.1. Market Analysis, Insights and Forecast - by Bike
- 9. Rest of the World Bike Sharing Industry Analysis, Insights and Forecast, 2019-2031
- 9.1. Market Analysis, Insights and Forecast - by Bike
- 9.1.1. Traditional/Regular Bike
- 9.1.2. E-bike
- 9.2. Market Analysis, Insights and Forecast - by Sharing System
- 9.2.1. Docked
- 9.2.2. Dockless
- 9.1. Market Analysis, Insights and Forecast - by Bike
- 10. North America Bike Sharing Industry Analysis, Insights and Forecast, 2019-2031
- 10.1. Market Analysis, Insights and Forecast - By Country/Sub-region
- 10.1.1.
- 11. Europe Bike Sharing Industry Analysis, Insights and Forecast, 2019-2031
- 11.1. Market Analysis, Insights and Forecast - By Country/Sub-region
- 11.1.1.
- 12. Asia Pacific Bike Sharing Industry Analysis, Insights and Forecast, 2019-2031
- 12.1. Market Analysis, Insights and Forecast - By Country/Sub-region
- 12.1.1.
- 13. Rest of the World Bike Sharing Industry Analysis, Insights and Forecast, 2019-2031
- 13.1. Market Analysis, Insights and Forecast - By Country/Sub-region
- 13.1.1.
- 14. Competitive Analysis
- 14.1. Global Market Share Analysis 2024
- 14.2. Company Profiles
- 14.2.1 JCDecaux Group
- 14.2.1.1. Overview
- 14.2.1.2. Products
- 14.2.1.3. SWOT Analysis
- 14.2.1.4. Recent Developments
- 14.2.1.5. Financials (Based on Availability)
- 14.2.2 Youon Bike
- 14.2.2.1. Overview
- 14.2.2.2. Products
- 14.2.2.3. SWOT Analysis
- 14.2.2.4. Recent Developments
- 14.2.2.5. Financials (Based on Availability)
- 14.2.3 Didi Chuxing Technology Co
- 14.2.3.1. Overview
- 14.2.3.2. Products
- 14.2.3.3. SWOT Analysis
- 14.2.3.4. Recent Developments
- 14.2.3.5. Financials (Based on Availability)
- 14.2.4 Uber Technologies Inc
- 14.2.4.1. Overview
- 14.2.4.2. Products
- 14.2.4.3. SWOT Analysis
- 14.2.4.4. Recent Developments
- 14.2.4.5. Financials (Based on Availability)
- 14.2.5 Lyft Inc
- 14.2.5.1. Overview
- 14.2.5.2. Products
- 14.2.5.3. SWOT Analysis
- 14.2.5.4. Recent Developments
- 14.2.5.5. Financials (Based on Availability)
- 14.2.6 Bluegogo
- 14.2.6.1. Overview
- 14.2.6.2. Products
- 14.2.6.3. SWOT Analysis
- 14.2.6.4. Recent Developments
- 14.2.6.5. Financials (Based on Availability)
- 14.2.7 Hellobike
- 14.2.7.1. Overview
- 14.2.7.2. Products
- 14.2.7.3. SWOT Analysis
- 14.2.7.4. Recent Developments
- 14.2.7.5. Financials (Based on Availability)
- 14.2.8 Meituan Bik
- 14.2.8.1. Overview
- 14.2.8.2. Products
- 14.2.8.3. SWOT Analysis
- 14.2.8.4. Recent Developments
- 14.2.8.5. Financials (Based on Availability)
- 14.2.9 Bird Rides Inc
- 14.2.9.1. Overview
- 14.2.9.2. Products
- 14.2.9.3. SWOT Analysis
- 14.2.9.4. Recent Developments
- 14.2.9.5. Financials (Based on Availability)
- 14.2.10 Neutron Holdings Inc
- 14.2.10.1. Overview
- 14.2.10.2. Products
- 14.2.10.3. SWOT Analysis
- 14.2.10.4. Recent Developments
- 14.2.10.5. Financials (Based on Availability)
- 14.2.1 JCDecaux Group
List of Figures
- Figure 1: Global Bike Sharing Industry Revenue Breakdown (Million, %) by Region 2024 & 2032
- Figure 2: North America Bike Sharing Industry Revenue (Million), by Country 2024 & 2032
- Figure 3: North America Bike Sharing Industry Revenue Share (%), by Country 2024 & 2032
- Figure 4: Europe Bike Sharing Industry Revenue (Million), by Country 2024 & 2032
- Figure 5: Europe Bike Sharing Industry Revenue Share (%), by Country 2024 & 2032
- Figure 6: Asia Pacific Bike Sharing Industry Revenue (Million), by Country 2024 & 2032
- Figure 7: Asia Pacific Bike Sharing Industry Revenue Share (%), by Country 2024 & 2032
- Figure 8: Rest of the World Bike Sharing Industry Revenue (Million), by Country 2024 & 2032
- Figure 9: Rest of the World Bike Sharing Industry Revenue Share (%), by Country 2024 & 2032
- Figure 10: North America Bike Sharing Industry Revenue (Million), by Bike 2024 & 2032
- Figure 11: North America Bike Sharing Industry Revenue Share (%), by Bike 2024 & 2032
- Figure 12: North America Bike Sharing Industry Revenue (Million), by Sharing System 2024 & 2032
- Figure 13: North America Bike Sharing Industry Revenue Share (%), by Sharing System 2024 & 2032
- Figure 14: North America Bike Sharing Industry Revenue (Million), by Country 2024 & 2032
- Figure 15: North America Bike Sharing Industry Revenue Share (%), by Country 2024 & 2032
- Figure 16: Europe Bike Sharing Industry Revenue (Million), by Bike 2024 & 2032
- Figure 17: Europe Bike Sharing Industry Revenue Share (%), by Bike 2024 & 2032
- Figure 18: Europe Bike Sharing Industry Revenue (Million), by Sharing System 2024 & 2032
- Figure 19: Europe Bike Sharing Industry Revenue Share (%), by Sharing System 2024 & 2032
- Figure 20: Europe Bike Sharing Industry Revenue (Million), by Country 2024 & 2032
- Figure 21: Europe Bike Sharing Industry Revenue Share (%), by Country 2024 & 2032
- Figure 22: Asia Pacific Bike Sharing Industry Revenue (Million), by Bike 2024 & 2032
- Figure 23: Asia Pacific Bike Sharing Industry Revenue Share (%), by Bike 2024 & 2032
- Figure 24: Asia Pacific Bike Sharing Industry Revenue (Million), by Sharing System 2024 & 2032
- Figure 25: Asia Pacific Bike Sharing Industry Revenue Share (%), by Sharing System 2024 & 2032
- Figure 26: Asia Pacific Bike Sharing Industry Revenue (Million), by Country 2024 & 2032
- Figure 27: Asia Pacific Bike Sharing Industry Revenue Share (%), by Country 2024 & 2032
- Figure 28: Rest of the World Bike Sharing Industry Revenue (Million), by Bike 2024 & 2032
- Figure 29: Rest of the World Bike Sharing Industry Revenue Share (%), by Bike 2024 & 2032
- Figure 30: Rest of the World Bike Sharing Industry Revenue (Million), by Sharing System 2024 & 2032
- Figure 31: Rest of the World Bike Sharing Industry Revenue Share (%), by Sharing System 2024 & 2032
- Figure 32: Rest of the World Bike Sharing Industry Revenue (Million), by Country 2024 & 2032
- Figure 33: Rest of the World Bike Sharing Industry Revenue Share (%), by Country 2024 & 2032
List of Tables
- Table 1: Global Bike Sharing Industry Revenue Million Forecast, by Region 2019 & 2032
- Table 2: Global Bike Sharing Industry Revenue Million Forecast, by Bike 2019 & 2032
- Table 3: Global Bike Sharing Industry Revenue Million Forecast, by Sharing System 2019 & 2032
- Table 4: Global Bike Sharing Industry Revenue Million Forecast, by Region 2019 & 2032
- Table 5: Global Bike Sharing Industry Revenue Million Forecast, by Country 2019 & 2032
- Table 6: Bike Sharing Industry Revenue (Million) Forecast, by Application 2019 & 2032
- Table 7: Global Bike Sharing Industry Revenue Million Forecast, by Country 2019 & 2032
- Table 8: Bike Sharing Industry Revenue (Million) Forecast, by Application 2019 & 2032
- Table 9: Global Bike Sharing Industry Revenue Million Forecast, by Country 2019 & 2032
- Table 10: Bike Sharing Industry Revenue (Million) Forecast, by Application 2019 & 2032
- Table 11: Global Bike Sharing Industry Revenue Million Forecast, by Country 2019 & 2032
- Table 12: Bike Sharing Industry Revenue (Million) Forecast, by Application 2019 & 2032
- Table 13: Global Bike Sharing Industry Revenue Million Forecast, by Bike 2019 & 2032
- Table 14: Global Bike Sharing Industry Revenue Million Forecast, by Sharing System 2019 & 2032
- Table 15: Global Bike Sharing Industry Revenue Million Forecast, by Country 2019 & 2032
- Table 16: Global Bike Sharing Industry Revenue Million Forecast, by Bike 2019 & 2032
- Table 17: Global Bike Sharing Industry Revenue Million Forecast, by Sharing System 2019 & 2032
- Table 18: Global Bike Sharing Industry Revenue Million Forecast, by Country 2019 & 2032
- Table 19: Global Bike Sharing Industry Revenue Million Forecast, by Bike 2019 & 2032
- Table 20: Global Bike Sharing Industry Revenue Million Forecast, by Sharing System 2019 & 2032
- Table 21: Global Bike Sharing Industry Revenue Million Forecast, by Country 2019 & 2032
- Table 22: Global Bike Sharing Industry Revenue Million Forecast, by Bike 2019 & 2032
- Table 23: Global Bike Sharing Industry Revenue Million Forecast, by Sharing System 2019 & 2032
- Table 24: Global Bike Sharing Industry Revenue Million Forecast, by Country 2019 & 2032
Frequently Asked Questions
1. What is the projected Compound Annual Growth Rate (CAGR) of the Bike Sharing Industry?
The projected CAGR is approximately 9.65%.
2. Which companies are prominent players in the Bike Sharing Industry?
Key companies in the market include JCDecaux Group, Youon Bike, Didi Chuxing Technology Co, Uber Technologies Inc, Lyft Inc, Bluegogo, Hellobike, Meituan Bik, Bird Rides Inc, Neutron Holdings Inc.
3. What are the main segments of the Bike Sharing Industry?
The market segments include Bike, Sharing System.
4. Can you provide details about the market size?
The market size is estimated to be USD 7.85 Million as of 2022.
5. What are some drivers contributing to market growth?
Increasing Inclusion of E-bikes in the Sharing Fleet.
6. What are the notable trends driving market growth?
E-bike Segment Expected to be the Fastest-growing Segment Over the Forecast Period.
7. Are there any restraints impacting market growth?
Limited Infrastructure May Hinder Market Growth.
8. Can you provide examples of recent developments in the market?
December 2023: The US International Development Finance Corporation (DFC) and IDB Invest announced that they were co-investing a combined USD 23 million in equity in micro-mobility platform Tembici to support the expansion of bicycle-sharing services in Latin America.
9. What pricing options are available for accessing the report?
Pricing options include single-user, multi-user, and enterprise licenses priced at USD 4750, USD 5250, and USD 8750 respectively.
10. Is the market size provided in terms of value or volume?
The market size is provided in terms of value, measured in Million.
11. Are there any specific market keywords associated with the report?
Yes, the market keyword associated with the report is "Bike Sharing Industry," which aids in identifying and referencing the specific market segment covered.
12. How do I determine which pricing option suits my needs best?
The pricing options vary based on user requirements and access needs. Individual users may opt for single-user licenses, while businesses requiring broader access may choose multi-user or enterprise licenses for cost-effective access to the report.
13. Are there any additional resources or data provided in the Bike Sharing Industry report?
While the report offers comprehensive insights, it's advisable to review the specific contents or supplementary materials provided to ascertain if additional resources or data are available.
14. How can I stay updated on further developments or reports in the Bike Sharing Industry?
To stay informed about further developments, trends, and reports in the Bike Sharing Industry, consider subscribing to industry newsletters, following relevant companies and organizations, or regularly checking reputable industry news sources and publications.
Methodology
Step 1 - Identification of Relevant Samples Size from Population Database


Step 2 - Approaches for Defining Global Market Size (Value, Volume* & Price*)

Note*: In applicable scenarios
Step 3 - Data Sources
Primary Research
- Web Analytics
- Survey Reports
- Research Institute
- Latest Research Reports
- Opinion Leaders
Secondary Research
- Annual Reports
- White Paper
- Latest Press Release
- Industry Association
- Paid Database
- Investor Presentations

Step 4 - Data Triangulation
Involves using different sources of information in order to increase the validity of a study
These sources are likely to be stakeholders in a program - participants, other researchers, program staff, other community members, and so on.
Then we put all data in single framework & apply various statistical tools to find out the dynamic on the market.
During the analysis stage, feedback from the stakeholder groups would be compared to determine areas of agreement as well as areas of divergence
