

Key Insights
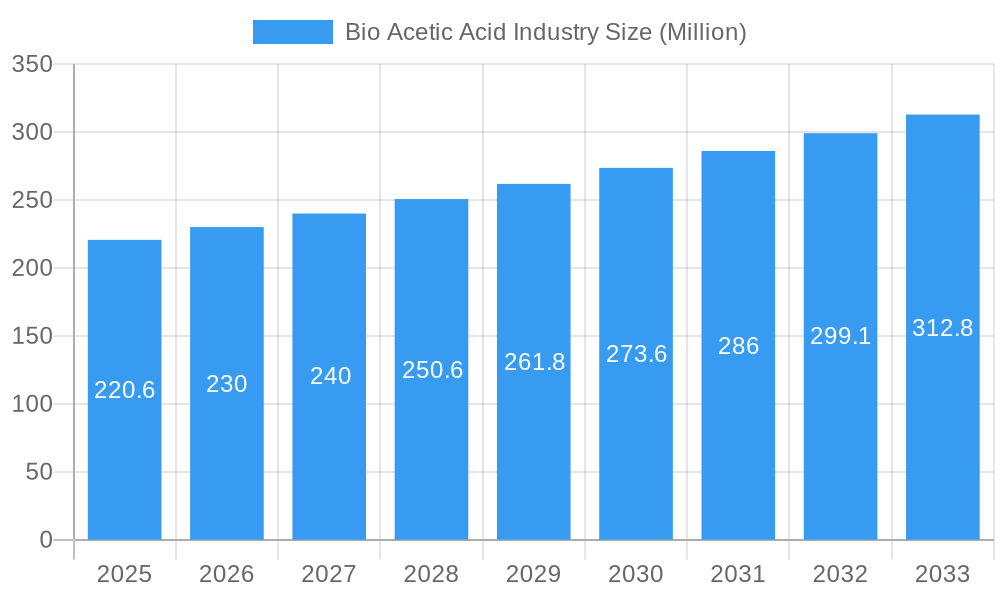
The global bio-acetic acid market, valued at $220.6 million in 2025, is projected for robust growth, exhibiting a Compound Annual Growth Rate (CAGR) exceeding 4.00% from 2025 to 2033. This expansion is fueled by increasing demand for sustainable and eco-friendly alternatives to petrochemical-based acetic acid, particularly within key application areas like Vinyl Acetate Monomer (VAM) production, acetate esters manufacturing, and the burgeoning purified terephthalic acid (PTA) sector. The rising awareness of environmental concerns and stringent regulations regarding carbon emissions are significant drivers, pushing industries to adopt bio-based solutions. Furthermore, advancements in biotechnology and fermentation processes are leading to increased efficiency and reduced production costs, making bio-acetic acid a more competitive option. The market's segmentation highlights the diverse raw material sources, including biomass, corn, maize, and sugar, reflecting the adaptability and potential for further diversification. Key players such as AFYREN SA, Sucroal SA, and Cargill Incorporated are actively contributing to market growth through innovation and strategic expansions. The Asia-Pacific region, driven by strong economic growth and increasing industrial activity in countries like China and India, is expected to dominate the market, although North America and Europe will maintain significant shares.
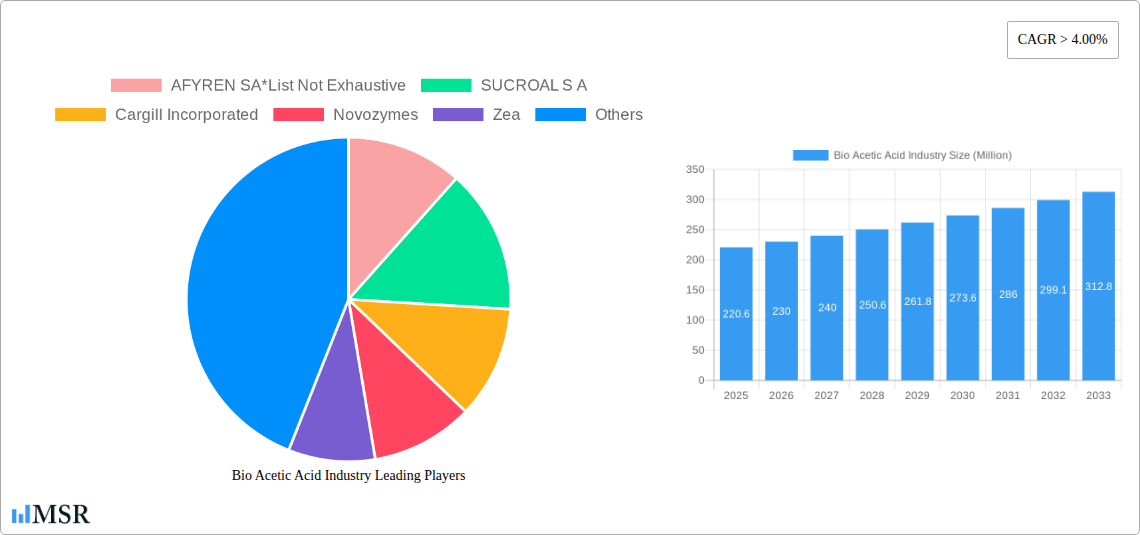
Bio Acetic Acid Industry Market Size (In Million)
Despite the positive outlook, the market faces certain challenges. Fluctuations in raw material prices and the potential for competition from established petrochemical-based acetic acid producers could impact growth trajectories. However, ongoing research and development efforts focused on improving process efficiency and reducing production costs, coupled with government incentives supporting bio-based industries, are likely to mitigate these restraints. The long-term outlook remains optimistic, with the bio-acetic acid market poised for substantial growth driven by sustainability concerns and technological advancements throughout the forecast period. The continued diversification of applications and raw material sources will further fuel market expansion and enhance resilience to external factors.
Bio Acetic Acid Industry Company Market Share
Bio Acetic Acid Industry: A Comprehensive Market Report (2019-2033)
This comprehensive report provides an in-depth analysis of the Bio Acetic Acid industry, offering crucial insights for stakeholders seeking to navigate this dynamic market. Covering the period from 2019 to 2033, with a base year of 2025 and a forecast period spanning 2025-2033, this report unveils market trends, key players, and future opportunities within the Bio Acetic Acid sector. The report analyzes market size, CAGR, and market share, offering actionable intelligence for strategic decision-making. The study delves into various segments, including raw materials (Biomass, Corn, Maize, Sugar, Other Raw Materials) and applications (Vinyl Acetate Monomer (VAM), Acetate Esters, Purified Terephthalic Acid (PTA), Acetic Anhydride, Other Applications).
Bio Acetic Acid Industry Market Concentration & Dynamics
This section analyzes the competitive landscape of the bio acetic acid market, encompassing market concentration, innovation, regulatory aspects, substitute products, end-user trends, and mergers & acquisitions (M&A) activity. The global bio acetic acid market is moderately concentrated, with a few major players holding significant market share. However, the emergence of innovative startups and the increasing interest from larger chemical companies suggest a dynamic and evolving competitive landscape.
- Market Concentration: xx% of the market is controlled by the top 5 players in 2025, with projections suggesting a xx% increase or decrease by 2033.
- Innovation Ecosystem: Significant investments in research and development are driving innovation in bio-based acetic acid production, focusing on improving efficiency and reducing production costs.
- Regulatory Frameworks: Government regulations and policies related to bio-based chemicals and sustainable manufacturing influence market growth. Fluctuations in these regulations can impact investment decisions and market trajectory.
- Substitute Products: Petrochemically derived acetic acid remains a major competitor. However, increasing environmental concerns and government incentives for bio-based solutions are driving shifts toward bio-acetic acid.
- End-User Trends: The growing demand for bio-based products across various end-use industries, such as textiles, food and beverage, and pharmaceuticals, fuels the growth of the bio acetic acid market.
- M&A Activities: The number of M&A deals in the bio acetic acid industry between 2019 and 2024 totalled xx deals, highlighting consolidation and strategic partnerships within the sector. This number is predicted to reach xx by 2033.
Bio Acetic Acid Industry Insights & Trends
This section presents a comprehensive overview of market size, growth drivers, technological disruptions, and evolving consumer preferences shaping the bio acetic acid market. The global market size for bio acetic acid was valued at $xx Million in 2024 and is projected to reach $xx Million by 2033, exhibiting a CAGR of xx% during the forecast period. Several factors contribute to this growth trajectory.
The increased demand for sustainable and environmentally friendly alternatives to petrochemical-based acetic acid is a significant driver. Technological advancements in fermentation processes, improving efficiency and reducing costs, further contribute to market expansion. Growing consumer awareness of environmental issues and a preference for bio-based products are also driving this transition. Furthermore, government support and policies promoting sustainable manufacturing and bio-based solutions are boosting market growth.
Key Markets & Segments Leading Bio Acetic Acid Industry
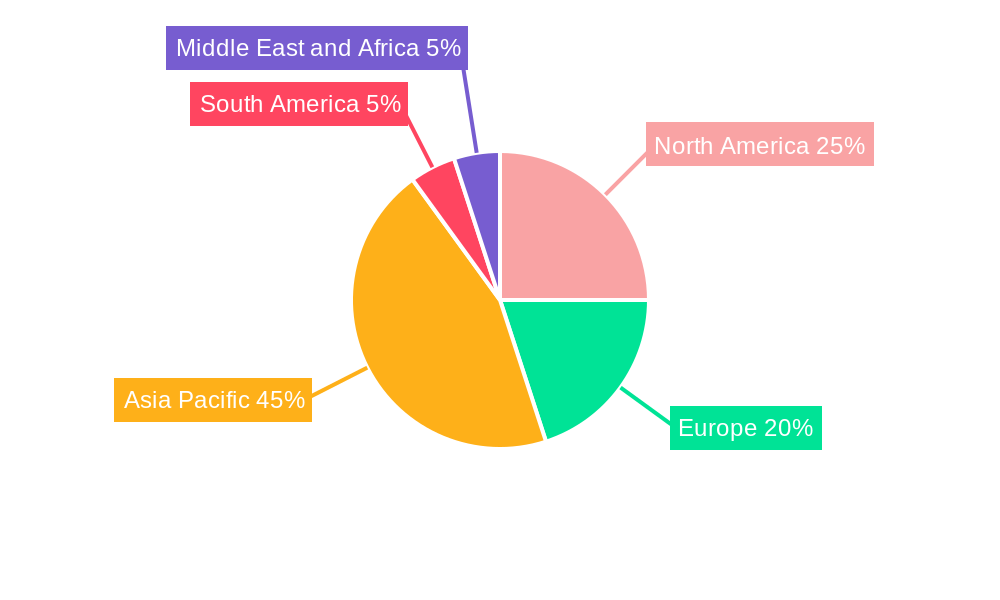
This section highlights the leading regions, countries, and segments within the bio acetic acid market. While data availability limits precise quantification, the Asia-Pacific region shows considerable growth potential, driven by factors such as expanding industrialization, rising demand for various applications, and government support for bio-based industries. Europe and North America also hold significant market share, driven by existing infrastructure and strong consumer demand for sustainable products.
Raw Material Segments:
- Biomass: Biomass, including agricultural residues and forestry byproducts, provides a renewable and cost-effective feedstock for bio acetic acid production.
- Corn/Maize: Corn and maize are widely utilized for bio-acetic acid production, benefiting from established agricultural infrastructure and readily available supplies.
- Sugar: Sugarcane and other sugar crops offer an attractive feedstock, especially in regions with robust sugar production.
- Other Raw Materials: Ongoing research explores novel raw materials, such as lignocellulosic biomass, to further diversify feedstock sources and enhance sustainability.
Application Segments:
- Vinyl Acetate Monomer (VAM): VAM remains a major application area for bio-acetic acid, driven by the growing demand for polymers and adhesives.
- Acetate Esters: Acetate esters are used widely in solvents, coatings, and other applications, signifying another key market segment for bio acetic acid.
- Purified Terephthalic Acid (PTA): PTA is a crucial component in the production of polyethylene terephthalate (PET), used extensively in packaging and textiles.
- Acetic Anhydride: This is used as an important chemical intermediate across various industries.
- Other Applications: Emerging applications continue to open up new market avenues for bio-acetic acid, further reinforcing its growth potential.
Market Drivers:
- Economic Growth: Economic growth in developing countries, particularly in Asia, drives increasing demand for bio acetic acid across several applications.
- Infrastructure Development: Investments in infrastructure, such as biorefineries and related facilities, contribute to a more robust and efficient bio acetic acid supply chain.
Bio Acetic Acid Industry Product Developments
Recent advancements in bio-acetic acid production include the development of more efficient fermentation processes using advanced yeast strains, reducing production costs and improving yields. These developments enhance the competitiveness of bio-acetic acid compared to its petrochemical counterpart. Innovation in downstream processing techniques also plays a crucial role in optimizing product quality and cost-effectiveness. Companies are also exploring novel applications of bio-acetic acid to broaden its market reach and increase its overall value proposition.
Challenges in the Bio Acetic Acid Industry Market
The bio acetic acid industry faces various challenges, including the high initial capital investment required for biorefinery construction and operation. Competition from petrochemically derived acetic acid, which often benefits from economies of scale, presents another significant hurdle. Furthermore, the availability of suitable feedstock and variability in feedstock quality can disrupt production and impact cost-efficiency. Regulatory uncertainties and evolving government policies can also influence market stability and investment decisions. Finally, managing the complexities associated with scaling up bio-based production from pilot-scale to commercial-scale operations remains a key challenge.
Forces Driving Bio Acetic Acid Industry Growth
Technological advancements, specifically in fermentation processes and downstream processing techniques, are critical drivers of market expansion. Government incentives and policies supporting sustainable and bio-based solutions stimulate further growth. The rising consumer demand for eco-friendly products and increasing environmental awareness further reinforce market expansion. Furthermore, cost reductions achieved through process optimization and economies of scale will contribute to the growth of this sector.
Challenges in the Bio Acetic Acid Industry Market
Long-term growth will depend on overcoming several challenges. Addressing feedstock variability and ensuring consistent raw material supply is vital. Continued innovation in fermentation technologies and downstream processing is critical to further reduce costs and improve efficiency. Strategic collaborations and partnerships among stakeholders, including research institutions, technology providers, and end-users, are essential for driving innovation and market expansion.
Emerging Opportunities in Bio Acetic Acid Industry
Emerging opportunities exist in developing new applications for bio-acetic acid, including exploring its use in novel materials, chemicals, and bio-based products. Expanding into new geographic markets, particularly in rapidly developing economies, offers substantial growth potential. Utilizing novel and diverse feedstocks further enhances the sustainability and resilience of the industry. Research into advanced fermentation technologies and process intensification holds the key to unlocking significant cost reductions and efficiency gains.
Key Milestones in Bio Acetic Acid Industry Industry
- July 2022: Novozymes launched Innova Apex and Innova Turbo, advanced yeast solutions enhancing ethanol production efficiency. This significantly impacts the bio-acetic acid market by improving the viability of utilizing fermentation byproducts.
- February 2022: The Indian Government proposed reducing customs duty on critical chemicals, including acetic acid, boosting domestic value addition and fostering market growth within India.
Strategic Outlook for Bio Acetic Acid Industry Market
The future of the bio acetic acid market looks promising, driven by increasing demand for sustainable solutions and technological advancements. Strategic partnerships, innovation in feedstock utilization, and expansion into new applications will be critical for long-term success. Companies focusing on cost reduction and process optimization are poised to capture a larger market share. The bio acetic acid industry is expected to witness significant growth over the next decade, driven by a combination of technological breakthroughs, supportive government policies, and a growing awareness of the environmental benefits of sustainable chemical production.
Bio Acetic Acid Industry Segmentation
-
1. Raw Material
- 1.1. Biomass
- 1.2. Corn
- 1.3. Maize
- 1.4. Sugar
- 1.5. Other Raw Materials
-
2. Application
- 2.1. Vinyl Acetate Monomer (VAM)
- 2.2. Acetate Esters
- 2.3. Purified Terephthalic Acid (PTA)
- 2.4. Acetic Anhydride
- 2.5. Other Applications
Bio Acetic Acid Industry Segmentation By Geography
-
1. Asia Pacific
- 1.1. China
- 1.2. India
- 1.3. Japan
- 1.4. South Korea
- 1.5. Malaysia
- 1.6. Thailand
- 1.7. Indonesia
- 1.8. Vietnam
- 1.9. Rest of Asia Pacific
-
2. North America
- 2.1. United States
- 2.2. Canada
- 2.3. Mexico
-
3. Europe
- 3.1. Germany
- 3.2. United Kingdom
- 3.3. Italy
- 3.4. France
- 3.5. Spain
- 3.6. NORDIC Countries
- 3.7. Turkey
- 3.8. Russia
- 3.9. Rest of Europe
-
4. South America
- 4.1. Brazil
- 4.2. Argentina
- 4.3. Colombia
- 4.4. Rest of South America
-
5. Middle East and Africa
- 5.1. Qatar
- 5.2. United Arab Emirates
- 5.3. Nigeria
- 5.4. Egypt
- 5.5. South Africa
- 5.6. Rest of Middle East and Africa
-
6. Middle East and Africa
- 6.1. Saudi Arabia
- 6.2. South Africa
- 6.3. Rest of Middle East and Africa
Bio Acetic Acid Industry Regional Market Share
Geographic Coverage of Bio Acetic Acid Industry
Bio Acetic Acid Industry REPORT HIGHLIGHTS
| Aspects | Details |
|---|---|
| Study Period | 2020-2034 |
| Base Year | 2025 |
| Estimated Year | 2026 |
| Forecast Period | 2026-2034 |
| Historical Period | 2020-2025 |
| Growth Rate | CAGR of > 4.00% from 2020-2034 |
| Segmentation |
|
Table of Contents
- 1. Introduction
- 1.1. Research Scope
- 1.2. Market Segmentation
- 1.3. Research Objective
- 1.4. Definitions and Assumptions
- 2. Executive Summary
- 2.1. Market Snapshot
- 3. Market Dynamics
- 3.1. Market Drivers
- 3.2. Market Restrains
- 3.3. Market Trends
- 3.4. Market Opportunities
- 4. Market Factor Analysis
- 4.1. Porters Five Forces
- 4.1.1. Bargaining Power of Suppliers
- 4.1.2. Bargaining Power of Buyers
- 4.1.3. Threat of New Entrants
- 4.1.4. Threat of Substitutes
- 4.1.5. Competitive Rivalry
- 4.2. PESTEL analysis
- 4.3. BCG Analysis
- 4.3.1. Stars (High Growth, High Market Share)
- 4.3.2. Cash Cows (Low Growth, High Market Share)
- 4.3.3. Question Mark (High Growth, Low Market Share)
- 4.3.4. Dogs (Low Growth, Low Market Share)
- 4.4. Ansoff Matrix Analysis
- 4.5. Supply Chain Analysis
- 4.6. Regulatory Landscape
- 4.7. Current Market Potential and Opportunity Assessment (TAM–SAM–SOM Framework)
- 4.8. MSR Analyst Note
- 4.1. Porters Five Forces
- 5. Market Analysis, Insights and Forecast 2021-2033
- 5.1. Market Analysis, Insights and Forecast - by Raw Material
- 5.1.1. Biomass
- 5.1.2. Corn
- 5.1.3. Maize
- 5.1.4. Sugar
- 5.1.5. Other Raw Materials
- 5.2. Market Analysis, Insights and Forecast - by Application
- 5.2.1. Vinyl Acetate Monomer (VAM)
- 5.2.2. Acetate Esters
- 5.2.3. Purified Terephthalic Acid (PTA)
- 5.2.4. Acetic Anhydride
- 5.2.5. Other Applications
- 5.3. Market Analysis, Insights and Forecast - by Region
- 5.3.1. Asia Pacific
- 5.3.2. North America
- 5.3.3. Europe
- 5.3.4. South America
- 5.3.5. Middle East and Africa
- 5.3.6. Middle East and Africa
- 5.1. Market Analysis, Insights and Forecast - by Raw Material
- 6. Global Bio Acetic Acid Industry Analysis, Insights and Forecast, 2021-2033
- 6.1. Market Analysis, Insights and Forecast - by Raw Material
- 6.1.1. Biomass
- 6.1.2. Corn
- 6.1.3. Maize
- 6.1.4. Sugar
- 6.1.5. Other Raw Materials
- 6.2. Market Analysis, Insights and Forecast - by Application
- 6.2.1. Vinyl Acetate Monomer (VAM)
- 6.2.2. Acetate Esters
- 6.2.3. Purified Terephthalic Acid (PTA)
- 6.2.4. Acetic Anhydride
- 6.2.5. Other Applications
- 6.1. Market Analysis, Insights and Forecast - by Raw Material
- 7. Asia Pacific Bio Acetic Acid Industry Analysis, Insights and Forecast, 2020-2032
- 7.1. Market Analysis, Insights and Forecast - by Raw Material
- 7.1.1. Biomass
- 7.1.2. Corn
- 7.1.3. Maize
- 7.1.4. Sugar
- 7.1.5. Other Raw Materials
- 7.2. Market Analysis, Insights and Forecast - by Application
- 7.2.1. Vinyl Acetate Monomer (VAM)
- 7.2.2. Acetate Esters
- 7.2.3. Purified Terephthalic Acid (PTA)
- 7.2.4. Acetic Anhydride
- 7.2.5. Other Applications
- 7.1. Market Analysis, Insights and Forecast - by Raw Material
- 8. North America Bio Acetic Acid Industry Analysis, Insights and Forecast, 2020-2032
- 8.1. Market Analysis, Insights and Forecast - by Raw Material
- 8.1.1. Biomass
- 8.1.2. Corn
- 8.1.3. Maize
- 8.1.4. Sugar
- 8.1.5. Other Raw Materials
- 8.2. Market Analysis, Insights and Forecast - by Application
- 8.2.1. Vinyl Acetate Monomer (VAM)
- 8.2.2. Acetate Esters
- 8.2.3. Purified Terephthalic Acid (PTA)
- 8.2.4. Acetic Anhydride
- 8.2.5. Other Applications
- 8.1. Market Analysis, Insights and Forecast - by Raw Material
- 9. Europe Bio Acetic Acid Industry Analysis, Insights and Forecast, 2020-2032
- 9.1. Market Analysis, Insights and Forecast - by Raw Material
- 9.1.1. Biomass
- 9.1.2. Corn
- 9.1.3. Maize
- 9.1.4. Sugar
- 9.1.5. Other Raw Materials
- 9.2. Market Analysis, Insights and Forecast - by Application
- 9.2.1. Vinyl Acetate Monomer (VAM)
- 9.2.2. Acetate Esters
- 9.2.3. Purified Terephthalic Acid (PTA)
- 9.2.4. Acetic Anhydride
- 9.2.5. Other Applications
- 9.1. Market Analysis, Insights and Forecast - by Raw Material
- 10. South America Bio Acetic Acid Industry Analysis, Insights and Forecast, 2020-2032
- 10.1. Market Analysis, Insights and Forecast - by Raw Material
- 10.1.1. Biomass
- 10.1.2. Corn
- 10.1.3. Maize
- 10.1.4. Sugar
- 10.1.5. Other Raw Materials
- 10.2. Market Analysis, Insights and Forecast - by Application
- 10.2.1. Vinyl Acetate Monomer (VAM)
- 10.2.2. Acetate Esters
- 10.2.3. Purified Terephthalic Acid (PTA)
- 10.2.4. Acetic Anhydride
- 10.2.5. Other Applications
- 10.1. Market Analysis, Insights and Forecast - by Raw Material
- 11. Middle East and Africa Bio Acetic Acid Industry Analysis, Insights and Forecast, 2020-2032
- 11.1. Market Analysis, Insights and Forecast - by Raw Material
- 11.1.1. Biomass
- 11.1.2. Corn
- 11.1.3. Maize
- 11.1.4. Sugar
- 11.1.5. Other Raw Materials
- 11.2. Market Analysis, Insights and Forecast - by Application
- 11.2.1. Vinyl Acetate Monomer (VAM)
- 11.2.2. Acetate Esters
- 11.2.3. Purified Terephthalic Acid (PTA)
- 11.2.4. Acetic Anhydride
- 11.2.5. Other Applications
- 11.1. Market Analysis, Insights and Forecast - by Raw Material
- 12. Middle East and Africa Bio Acetic Acid Industry Analysis, Insights and Forecast, 2020-2032
- 12.1. Market Analysis, Insights and Forecast - by Raw Material
- 12.1.1. Biomass
- 12.1.2. Corn
- 12.1.3. Maize
- 12.1.4. Sugar
- 12.1.5. Other Raw Materials
- 12.2. Market Analysis, Insights and Forecast - by Application
- 12.2.1. Vinyl Acetate Monomer (VAM)
- 12.2.2. Acetate Esters
- 12.2.3. Purified Terephthalic Acid (PTA)
- 12.2.4. Acetic Anhydride
- 12.2.5. Other Applications
- 12.1. Market Analysis, Insights and Forecast - by Raw Material
- 13. Competitive Analysis
- 13.1. Company Profiles
- 13.1.1 AFYREN SA*List Not Exhaustive
- 13.1.1.1. Company Overview
- 13.1.1.2. Products
- 13.1.1.3. Company Financials
- 13.1.1.4. SWOT Analysis
- 13.1.2 SUCROAL S A
- 13.1.2.1. Company Overview
- 13.1.2.2. Products
- 13.1.2.3. Company Financials
- 13.1.2.4. SWOT Analysis
- 13.1.3 Cargill Incorporated
- 13.1.3.1. Company Overview
- 13.1.3.2. Products
- 13.1.3.3. Company Financials
- 13.1.3.4. SWOT Analysis
- 13.1.4 Novozymes
- 13.1.4.1. Company Overview
- 13.1.4.2. Products
- 13.1.4.3. Company Financials
- 13.1.4.4. SWOT Analysis
- 13.1.5 Zea
- 13.1.5.1. Company Overview
- 13.1.5.2. Products
- 13.1.5.3. Company Financials
- 13.1.5.4. SWOT Analysis
- 13.1.6 LanzaTech
- 13.1.6.1. Company Overview
- 13.1.6.2. Products
- 13.1.6.3. Company Financials
- 13.1.6.4. SWOT Analysis
- 13.1.7 GODAVARI BIOREFINERIES LTD
- 13.1.7.1. Company Overview
- 13.1.7.2. Products
- 13.1.7.3. Company Financials
- 13.1.7.4. SWOT Analysis
- 13.1.8 btgbioliquids
- 13.1.8.1. Company Overview
- 13.1.8.2. Products
- 13.1.8.3. Company Financials
- 13.1.8.4. SWOT Analysis
- 13.1.9 Airedale Chemical Company Limited
- 13.1.9.1. Company Overview
- 13.1.9.2. Products
- 13.1.9.3. Company Financials
- 13.1.9.4. SWOT Analysis
- 13.1.10 BASF SE
- 13.1.10.1. Company Overview
- 13.1.10.2. Products
- 13.1.10.3. Company Financials
- 13.1.10.4. SWOT Analysis
- 13.1.1 AFYREN SA*List Not Exhaustive
- 13.2. Market Entropy
- 13.2.1 Company's Key Areas Served
- 13.2.2 Recent Developments
- 13.3. Company Market Share Analysis 2025
- 13.3.1 Top 5 Companies Market Share Analysis
- 13.3.2 Top 3 Companies Market Share Analysis
- 13.4. List of Potential Customers
- 14. Research Methodology
List of Figures
- Figure 1: Global Bio Acetic Acid Industry Revenue Breakdown (Million, %) by Region 2025 & 2033
- Figure 2: Global Bio Acetic Acid Industry Volume Breakdown (K Tons, %) by Region 2025 & 2033
- Figure 3: Asia Pacific Bio Acetic Acid Industry Revenue (Million), by Raw Material 2025 & 2033
- Figure 4: Asia Pacific Bio Acetic Acid Industry Volume (K Tons), by Raw Material 2025 & 2033
- Figure 5: Asia Pacific Bio Acetic Acid Industry Revenue Share (%), by Raw Material 2025 & 2033
- Figure 6: Asia Pacific Bio Acetic Acid Industry Volume Share (%), by Raw Material 2025 & 2033
- Figure 7: Asia Pacific Bio Acetic Acid Industry Revenue (Million), by Application 2025 & 2033
- Figure 8: Asia Pacific Bio Acetic Acid Industry Volume (K Tons), by Application 2025 & 2033
- Figure 9: Asia Pacific Bio Acetic Acid Industry Revenue Share (%), by Application 2025 & 2033
- Figure 10: Asia Pacific Bio Acetic Acid Industry Volume Share (%), by Application 2025 & 2033
- Figure 11: Asia Pacific Bio Acetic Acid Industry Revenue (Million), by Country 2025 & 2033
- Figure 12: Asia Pacific Bio Acetic Acid Industry Volume (K Tons), by Country 2025 & 2033
- Figure 13: Asia Pacific Bio Acetic Acid Industry Revenue Share (%), by Country 2025 & 2033
- Figure 14: Asia Pacific Bio Acetic Acid Industry Volume Share (%), by Country 2025 & 2033
- Figure 15: North America Bio Acetic Acid Industry Revenue (Million), by Raw Material 2025 & 2033
- Figure 16: North America Bio Acetic Acid Industry Volume (K Tons), by Raw Material 2025 & 2033
- Figure 17: North America Bio Acetic Acid Industry Revenue Share (%), by Raw Material 2025 & 2033
- Figure 18: North America Bio Acetic Acid Industry Volume Share (%), by Raw Material 2025 & 2033
- Figure 19: North America Bio Acetic Acid Industry Revenue (Million), by Application 2025 & 2033
- Figure 20: North America Bio Acetic Acid Industry Volume (K Tons), by Application 2025 & 2033
- Figure 21: North America Bio Acetic Acid Industry Revenue Share (%), by Application 2025 & 2033
- Figure 22: North America Bio Acetic Acid Industry Volume Share (%), by Application 2025 & 2033
- Figure 23: North America Bio Acetic Acid Industry Revenue (Million), by Country 2025 & 2033
- Figure 24: North America Bio Acetic Acid Industry Volume (K Tons), by Country 2025 & 2033
- Figure 25: North America Bio Acetic Acid Industry Revenue Share (%), by Country 2025 & 2033
- Figure 26: North America Bio Acetic Acid Industry Volume Share (%), by Country 2025 & 2033
- Figure 27: Europe Bio Acetic Acid Industry Revenue (Million), by Raw Material 2025 & 2033
- Figure 28: Europe Bio Acetic Acid Industry Volume (K Tons), by Raw Material 2025 & 2033
- Figure 29: Europe Bio Acetic Acid Industry Revenue Share (%), by Raw Material 2025 & 2033
- Figure 30: Europe Bio Acetic Acid Industry Volume Share (%), by Raw Material 2025 & 2033
- Figure 31: Europe Bio Acetic Acid Industry Revenue (Million), by Application 2025 & 2033
- Figure 32: Europe Bio Acetic Acid Industry Volume (K Tons), by Application 2025 & 2033
- Figure 33: Europe Bio Acetic Acid Industry Revenue Share (%), by Application 2025 & 2033
- Figure 34: Europe Bio Acetic Acid Industry Volume Share (%), by Application 2025 & 2033
- Figure 35: Europe Bio Acetic Acid Industry Revenue (Million), by Country 2025 & 2033
- Figure 36: Europe Bio Acetic Acid Industry Volume (K Tons), by Country 2025 & 2033
- Figure 37: Europe Bio Acetic Acid Industry Revenue Share (%), by Country 2025 & 2033
- Figure 38: Europe Bio Acetic Acid Industry Volume Share (%), by Country 2025 & 2033
- Figure 39: South America Bio Acetic Acid Industry Revenue (Million), by Raw Material 2025 & 2033
- Figure 40: South America Bio Acetic Acid Industry Volume (K Tons), by Raw Material 2025 & 2033
- Figure 41: South America Bio Acetic Acid Industry Revenue Share (%), by Raw Material 2025 & 2033
- Figure 42: South America Bio Acetic Acid Industry Volume Share (%), by Raw Material 2025 & 2033
- Figure 43: South America Bio Acetic Acid Industry Revenue (Million), by Application 2025 & 2033
- Figure 44: South America Bio Acetic Acid Industry Volume (K Tons), by Application 2025 & 2033
- Figure 45: South America Bio Acetic Acid Industry Revenue Share (%), by Application 2025 & 2033
- Figure 46: South America Bio Acetic Acid Industry Volume Share (%), by Application 2025 & 2033
- Figure 47: South America Bio Acetic Acid Industry Revenue (Million), by Country 2025 & 2033
- Figure 48: South America Bio Acetic Acid Industry Volume (K Tons), by Country 2025 & 2033
- Figure 49: South America Bio Acetic Acid Industry Revenue Share (%), by Country 2025 & 2033
- Figure 50: South America Bio Acetic Acid Industry Volume Share (%), by Country 2025 & 2033
- Figure 51: Middle East and Africa Bio Acetic Acid Industry Revenue (Million), by Raw Material 2025 & 2033
- Figure 52: Middle East and Africa Bio Acetic Acid Industry Volume (K Tons), by Raw Material 2025 & 2033
- Figure 53: Middle East and Africa Bio Acetic Acid Industry Revenue Share (%), by Raw Material 2025 & 2033
- Figure 54: Middle East and Africa Bio Acetic Acid Industry Volume Share (%), by Raw Material 2025 & 2033
- Figure 55: Middle East and Africa Bio Acetic Acid Industry Revenue (Million), by Application 2025 & 2033
- Figure 56: Middle East and Africa Bio Acetic Acid Industry Volume (K Tons), by Application 2025 & 2033
- Figure 57: Middle East and Africa Bio Acetic Acid Industry Revenue Share (%), by Application 2025 & 2033
- Figure 58: Middle East and Africa Bio Acetic Acid Industry Volume Share (%), by Application 2025 & 2033
- Figure 59: Middle East and Africa Bio Acetic Acid Industry Revenue (Million), by Country 2025 & 2033
- Figure 60: Middle East and Africa Bio Acetic Acid Industry Volume (K Tons), by Country 2025 & 2033
- Figure 61: Middle East and Africa Bio Acetic Acid Industry Revenue Share (%), by Country 2025 & 2033
- Figure 62: Middle East and Africa Bio Acetic Acid Industry Volume Share (%), by Country 2025 & 2033
- Figure 63: Middle East and Africa Bio Acetic Acid Industry Revenue (Million), by Raw Material 2025 & 2033
- Figure 64: Middle East and Africa Bio Acetic Acid Industry Volume (K Tons), by Raw Material 2025 & 2033
- Figure 65: Middle East and Africa Bio Acetic Acid Industry Revenue Share (%), by Raw Material 2025 & 2033
- Figure 66: Middle East and Africa Bio Acetic Acid Industry Volume Share (%), by Raw Material 2025 & 2033
- Figure 67: Middle East and Africa Bio Acetic Acid Industry Revenue (Million), by Application 2025 & 2033
- Figure 68: Middle East and Africa Bio Acetic Acid Industry Volume (K Tons), by Application 2025 & 2033
- Figure 69: Middle East and Africa Bio Acetic Acid Industry Revenue Share (%), by Application 2025 & 2033
- Figure 70: Middle East and Africa Bio Acetic Acid Industry Volume Share (%), by Application 2025 & 2033
- Figure 71: Middle East and Africa Bio Acetic Acid Industry Revenue (Million), by Country 2025 & 2033
- Figure 72: Middle East and Africa Bio Acetic Acid Industry Volume (K Tons), by Country 2025 & 2033
- Figure 73: Middle East and Africa Bio Acetic Acid Industry Revenue Share (%), by Country 2025 & 2033
- Figure 74: Middle East and Africa Bio Acetic Acid Industry Volume Share (%), by Country 2025 & 2033
List of Tables
- Table 1: Global Bio Acetic Acid Industry Revenue Million Forecast, by Raw Material 2020 & 2033
- Table 2: Global Bio Acetic Acid Industry Volume K Tons Forecast, by Raw Material 2020 & 2033
- Table 3: Global Bio Acetic Acid Industry Revenue Million Forecast, by Application 2020 & 2033
- Table 4: Global Bio Acetic Acid Industry Volume K Tons Forecast, by Application 2020 & 2033
- Table 5: Global Bio Acetic Acid Industry Revenue Million Forecast, by Region 2020 & 2033
- Table 6: Global Bio Acetic Acid Industry Volume K Tons Forecast, by Region 2020 & 2033
- Table 7: Global Bio Acetic Acid Industry Revenue Million Forecast, by Raw Material 2020 & 2033
- Table 8: Global Bio Acetic Acid Industry Volume K Tons Forecast, by Raw Material 2020 & 2033
- Table 9: Global Bio Acetic Acid Industry Revenue Million Forecast, by Application 2020 & 2033
- Table 10: Global Bio Acetic Acid Industry Volume K Tons Forecast, by Application 2020 & 2033
- Table 11: Global Bio Acetic Acid Industry Revenue Million Forecast, by Country 2020 & 2033
- Table 12: Global Bio Acetic Acid Industry Volume K Tons Forecast, by Country 2020 & 2033
- Table 13: China Bio Acetic Acid Industry Revenue (Million) Forecast, by Application 2020 & 2033
- Table 14: China Bio Acetic Acid Industry Volume (K Tons) Forecast, by Application 2020 & 2033
- Table 15: India Bio Acetic Acid Industry Revenue (Million) Forecast, by Application 2020 & 2033
- Table 16: India Bio Acetic Acid Industry Volume (K Tons) Forecast, by Application 2020 & 2033
- Table 17: Japan Bio Acetic Acid Industry Revenue (Million) Forecast, by Application 2020 & 2033
- Table 18: Japan Bio Acetic Acid Industry Volume (K Tons) Forecast, by Application 2020 & 2033
- Table 19: South Korea Bio Acetic Acid Industry Revenue (Million) Forecast, by Application 2020 & 2033
- Table 20: South Korea Bio Acetic Acid Industry Volume (K Tons) Forecast, by Application 2020 & 2033
- Table 21: Malaysia Bio Acetic Acid Industry Revenue (Million) Forecast, by Application 2020 & 2033
- Table 22: Malaysia Bio Acetic Acid Industry Volume (K Tons) Forecast, by Application 2020 & 2033
- Table 23: Thailand Bio Acetic Acid Industry Revenue (Million) Forecast, by Application 2020 & 2033
- Table 24: Thailand Bio Acetic Acid Industry Volume (K Tons) Forecast, by Application 2020 & 2033
- Table 25: Indonesia Bio Acetic Acid Industry Revenue (Million) Forecast, by Application 2020 & 2033
- Table 26: Indonesia Bio Acetic Acid Industry Volume (K Tons) Forecast, by Application 2020 & 2033
- Table 27: Vietnam Bio Acetic Acid Industry Revenue (Million) Forecast, by Application 2020 & 2033
- Table 28: Vietnam Bio Acetic Acid Industry Volume (K Tons) Forecast, by Application 2020 & 2033
- Table 29: Rest of Asia Pacific Bio Acetic Acid Industry Revenue (Million) Forecast, by Application 2020 & 2033
- Table 30: Rest of Asia Pacific Bio Acetic Acid Industry Volume (K Tons) Forecast, by Application 2020 & 2033
- Table 31: Global Bio Acetic Acid Industry Revenue Million Forecast, by Raw Material 2020 & 2033
- Table 32: Global Bio Acetic Acid Industry Volume K Tons Forecast, by Raw Material 2020 & 2033
- Table 33: Global Bio Acetic Acid Industry Revenue Million Forecast, by Application 2020 & 2033
- Table 34: Global Bio Acetic Acid Industry Volume K Tons Forecast, by Application 2020 & 2033
- Table 35: Global Bio Acetic Acid Industry Revenue Million Forecast, by Country 2020 & 2033
- Table 36: Global Bio Acetic Acid Industry Volume K Tons Forecast, by Country 2020 & 2033
- Table 37: United States Bio Acetic Acid Industry Revenue (Million) Forecast, by Application 2020 & 2033
- Table 38: United States Bio Acetic Acid Industry Volume (K Tons) Forecast, by Application 2020 & 2033
- Table 39: Canada Bio Acetic Acid Industry Revenue (Million) Forecast, by Application 2020 & 2033
- Table 40: Canada Bio Acetic Acid Industry Volume (K Tons) Forecast, by Application 2020 & 2033
- Table 41: Mexico Bio Acetic Acid Industry Revenue (Million) Forecast, by Application 2020 & 2033
- Table 42: Mexico Bio Acetic Acid Industry Volume (K Tons) Forecast, by Application 2020 & 2033
- Table 43: Global Bio Acetic Acid Industry Revenue Million Forecast, by Raw Material 2020 & 2033
- Table 44: Global Bio Acetic Acid Industry Volume K Tons Forecast, by Raw Material 2020 & 2033
- Table 45: Global Bio Acetic Acid Industry Revenue Million Forecast, by Application 2020 & 2033
- Table 46: Global Bio Acetic Acid Industry Volume K Tons Forecast, by Application 2020 & 2033
- Table 47: Global Bio Acetic Acid Industry Revenue Million Forecast, by Country 2020 & 2033
- Table 48: Global Bio Acetic Acid Industry Volume K Tons Forecast, by Country 2020 & 2033
- Table 49: Germany Bio Acetic Acid Industry Revenue (Million) Forecast, by Application 2020 & 2033
- Table 50: Germany Bio Acetic Acid Industry Volume (K Tons) Forecast, by Application 2020 & 2033
- Table 51: United Kingdom Bio Acetic Acid Industry Revenue (Million) Forecast, by Application 2020 & 2033
- Table 52: United Kingdom Bio Acetic Acid Industry Volume (K Tons) Forecast, by Application 2020 & 2033
- Table 53: Italy Bio Acetic Acid Industry Revenue (Million) Forecast, by Application 2020 & 2033
- Table 54: Italy Bio Acetic Acid Industry Volume (K Tons) Forecast, by Application 2020 & 2033
- Table 55: France Bio Acetic Acid Industry Revenue (Million) Forecast, by Application 2020 & 2033
- Table 56: France Bio Acetic Acid Industry Volume (K Tons) Forecast, by Application 2020 & 2033
- Table 57: Spain Bio Acetic Acid Industry Revenue (Million) Forecast, by Application 2020 & 2033
- Table 58: Spain Bio Acetic Acid Industry Volume (K Tons) Forecast, by Application 2020 & 2033
- Table 59: NORDIC Countries Bio Acetic Acid Industry Revenue (Million) Forecast, by Application 2020 & 2033
- Table 60: NORDIC Countries Bio Acetic Acid Industry Volume (K Tons) Forecast, by Application 2020 & 2033
- Table 61: Turkey Bio Acetic Acid Industry Revenue (Million) Forecast, by Application 2020 & 2033
- Table 62: Turkey Bio Acetic Acid Industry Volume (K Tons) Forecast, by Application 2020 & 2033
- Table 63: Russia Bio Acetic Acid Industry Revenue (Million) Forecast, by Application 2020 & 2033
- Table 64: Russia Bio Acetic Acid Industry Volume (K Tons) Forecast, by Application 2020 & 2033
- Table 65: Rest of Europe Bio Acetic Acid Industry Revenue (Million) Forecast, by Application 2020 & 2033
- Table 66: Rest of Europe Bio Acetic Acid Industry Volume (K Tons) Forecast, by Application 2020 & 2033
- Table 67: Global Bio Acetic Acid Industry Revenue Million Forecast, by Raw Material 2020 & 2033
- Table 68: Global Bio Acetic Acid Industry Volume K Tons Forecast, by Raw Material 2020 & 2033
- Table 69: Global Bio Acetic Acid Industry Revenue Million Forecast, by Application 2020 & 2033
- Table 70: Global Bio Acetic Acid Industry Volume K Tons Forecast, by Application 2020 & 2033
- Table 71: Global Bio Acetic Acid Industry Revenue Million Forecast, by Country 2020 & 2033
- Table 72: Global Bio Acetic Acid Industry Volume K Tons Forecast, by Country 2020 & 2033
- Table 73: Brazil Bio Acetic Acid Industry Revenue (Million) Forecast, by Application 2020 & 2033
- Table 74: Brazil Bio Acetic Acid Industry Volume (K Tons) Forecast, by Application 2020 & 2033
- Table 75: Argentina Bio Acetic Acid Industry Revenue (Million) Forecast, by Application 2020 & 2033
- Table 76: Argentina Bio Acetic Acid Industry Volume (K Tons) Forecast, by Application 2020 & 2033
- Table 77: Colombia Bio Acetic Acid Industry Revenue (Million) Forecast, by Application 2020 & 2033
- Table 78: Colombia Bio Acetic Acid Industry Volume (K Tons) Forecast, by Application 2020 & 2033
- Table 79: Rest of South America Bio Acetic Acid Industry Revenue (Million) Forecast, by Application 2020 & 2033
- Table 80: Rest of South America Bio Acetic Acid Industry Volume (K Tons) Forecast, by Application 2020 & 2033
- Table 81: Global Bio Acetic Acid Industry Revenue Million Forecast, by Raw Material 2020 & 2033
- Table 82: Global Bio Acetic Acid Industry Volume K Tons Forecast, by Raw Material 2020 & 2033
- Table 83: Global Bio Acetic Acid Industry Revenue Million Forecast, by Application 2020 & 2033
- Table 84: Global Bio Acetic Acid Industry Volume K Tons Forecast, by Application 2020 & 2033
- Table 85: Global Bio Acetic Acid Industry Revenue Million Forecast, by Country 2020 & 2033
- Table 86: Global Bio Acetic Acid Industry Volume K Tons Forecast, by Country 2020 & 2033
- Table 87: Qatar Bio Acetic Acid Industry Revenue (Million) Forecast, by Application 2020 & 2033
- Table 88: Qatar Bio Acetic Acid Industry Volume (K Tons) Forecast, by Application 2020 & 2033
- Table 89: United Arab Emirates Bio Acetic Acid Industry Revenue (Million) Forecast, by Application 2020 & 2033
- Table 90: United Arab Emirates Bio Acetic Acid Industry Volume (K Tons) Forecast, by Application 2020 & 2033
- Table 91: Nigeria Bio Acetic Acid Industry Revenue (Million) Forecast, by Application 2020 & 2033
- Table 92: Nigeria Bio Acetic Acid Industry Volume (K Tons) Forecast, by Application 2020 & 2033
- Table 93: Egypt Bio Acetic Acid Industry Revenue (Million) Forecast, by Application 2020 & 2033
- Table 94: Egypt Bio Acetic Acid Industry Volume (K Tons) Forecast, by Application 2020 & 2033
- Table 95: South Africa Bio Acetic Acid Industry Revenue (Million) Forecast, by Application 2020 & 2033
- Table 96: South Africa Bio Acetic Acid Industry Volume (K Tons) Forecast, by Application 2020 & 2033
- Table 97: Rest of Middle East and Africa Bio Acetic Acid Industry Revenue (Million) Forecast, by Application 2020 & 2033
- Table 98: Rest of Middle East and Africa Bio Acetic Acid Industry Volume (K Tons) Forecast, by Application 2020 & 2033
- Table 99: Global Bio Acetic Acid Industry Revenue Million Forecast, by Raw Material 2020 & 2033
- Table 100: Global Bio Acetic Acid Industry Volume K Tons Forecast, by Raw Material 2020 & 2033
- Table 101: Global Bio Acetic Acid Industry Revenue Million Forecast, by Application 2020 & 2033
- Table 102: Global Bio Acetic Acid Industry Volume K Tons Forecast, by Application 2020 & 2033
- Table 103: Global Bio Acetic Acid Industry Revenue Million Forecast, by Country 2020 & 2033
- Table 104: Global Bio Acetic Acid Industry Volume K Tons Forecast, by Country 2020 & 2033
- Table 105: Saudi Arabia Bio Acetic Acid Industry Revenue (Million) Forecast, by Application 2020 & 2033
- Table 106: Saudi Arabia Bio Acetic Acid Industry Volume (K Tons) Forecast, by Application 2020 & 2033
- Table 107: South Africa Bio Acetic Acid Industry Revenue (Million) Forecast, by Application 2020 & 2033
- Table 108: South Africa Bio Acetic Acid Industry Volume (K Tons) Forecast, by Application 2020 & 2033
- Table 109: Rest of Middle East and Africa Bio Acetic Acid Industry Revenue (Million) Forecast, by Application 2020 & 2033
- Table 110: Rest of Middle East and Africa Bio Acetic Acid Industry Volume (K Tons) Forecast, by Application 2020 & 2033
Frequently Asked Questions
1. What is the projected Compound Annual Growth Rate (CAGR) of the Bio Acetic Acid Industry?
The projected CAGR is approximately > 4.00%.
2. Which companies are prominent players in the Bio Acetic Acid Industry?
Key companies in the market include AFYREN SA*List Not Exhaustive, SUCROAL S A, Cargill Incorporated, Novozymes, Zea, LanzaTech, GODAVARI BIOREFINERIES LTD, btgbioliquids, Airedale Chemical Company Limited, BASF SE.
3. What are the main segments of the Bio Acetic Acid Industry?
The market segments include Raw Material, Application.
4. Can you provide details about the market size?
The market size is estimated to be USD 220.6 Million as of 2022.
5. What are some drivers contributing to market growth?
Rising Crude Oil Prices; Increasing Demand for Vinyl Acetate Monomer (VAM).
6. What are the notable trends driving market growth?
Vinyl Acetate Monomer (VAM) Segment to Dominate the Market.
7. Are there any restraints impacting market growth?
Scarcity and Social Constraints for Raw Materials; Environmental Concerns Regarding the Harmful Effects.
8. Can you provide examples of recent developments in the market?
July 2022: Novozymes launched Innova Apex and Innova Turbo, advanced yeast solutions that can tolerate up to 0.6% lactic acid and 0.4% acetic acid and 0.8% lactic acid, and 0.4% acetic acid, respectively. The solutions are tailored to work in specific fermentation times, enabling ethanol producers to maximize their fermentation process to achieve their desired production targets.
9. What pricing options are available for accessing the report?
Pricing options include single-user, multi-user, and enterprise licenses priced at USD 4750, USD 5250, and USD 8750 respectively.
10. Is the market size provided in terms of value or volume?
The market size is provided in terms of value, measured in Million and volume, measured in K Tons.
11. Are there any specific market keywords associated with the report?
Yes, the market keyword associated with the report is "Bio Acetic Acid Industry," which aids in identifying and referencing the specific market segment covered.
12. How do I determine which pricing option suits my needs best?
The pricing options vary based on user requirements and access needs. Individual users may opt for single-user licenses, while businesses requiring broader access may choose multi-user or enterprise licenses for cost-effective access to the report.
13. Are there any additional resources or data provided in the Bio Acetic Acid Industry report?
While the report offers comprehensive insights, it's advisable to review the specific contents or supplementary materials provided to ascertain if additional resources or data are available.
14. How can I stay updated on further developments or reports in the Bio Acetic Acid Industry?
To stay informed about further developments, trends, and reports in the Bio Acetic Acid Industry, consider subscribing to industry newsletters, following relevant companies and organizations, or regularly checking reputable industry news sources and publications.
Methodology
Step 1 - Identification of Relevant Samples Size from Population Database


Step 2 - Approaches for Defining Global Market Size (Value, Volume* & Price*)

Note*: In applicable scenarios
Step 3 - Data Sources
Primary Research
- Web Analytics
- Survey Reports
- Research Institute
- Latest Research Reports
- Opinion Leaders
Secondary Research
- Annual Reports
- White Paper
- Latest Press Release
- Industry Association
- Paid Database
- Investor Presentations

Step 4 - Data Triangulation
Involves using different sources of information in order to increase the validity of a study
These sources are likely to be stakeholders in a program - participants, other researchers, program staff, other community members, and so on.
Then we put all data in single framework & apply various statistical tools to find out the dynamic on the market.
During the analysis stage, feedback from the stakeholder groups would be compared to determine areas of agreement as well as areas of divergence