

Key Insights
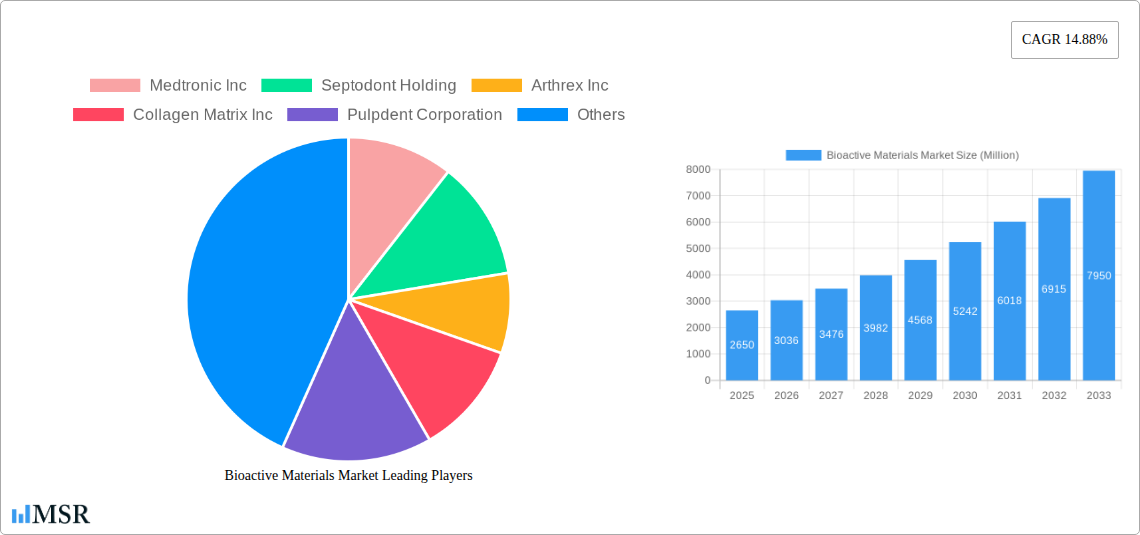
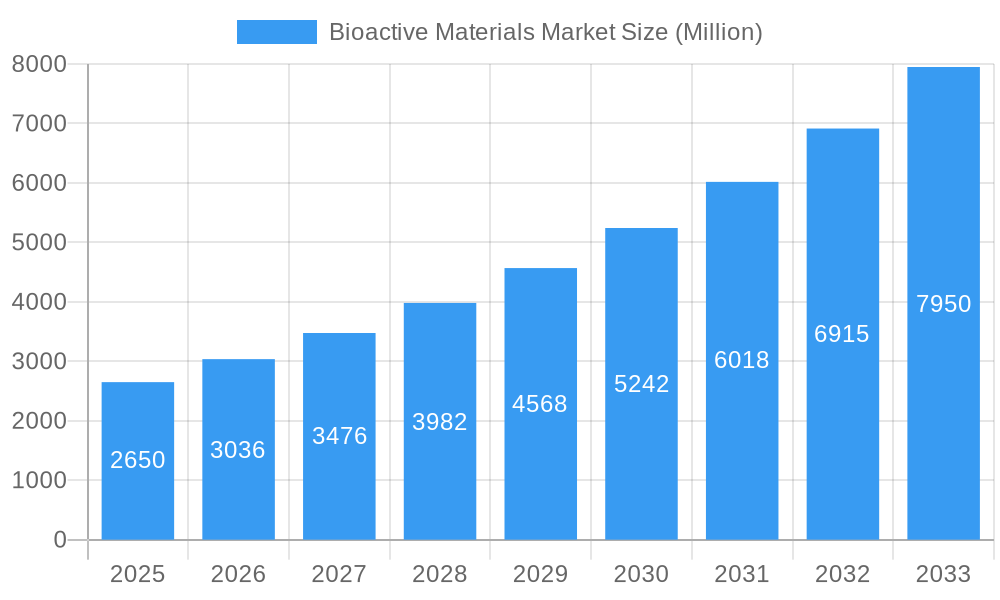
The bioactive materials market, valued at $2.65 billion in 2025, is projected to experience robust growth, driven by a Compound Annual Growth Rate (CAGR) of 14.88% from 2025 to 2033. This expansion is fueled by several key factors. Firstly, the increasing prevalence of orthopedic and dental procedures globally, coupled with advancements in minimally invasive surgical techniques, is significantly boosting demand for bioactive materials. These materials offer superior biocompatibility and osseointegration properties, leading to faster healing times and improved patient outcomes. Secondly, the burgeoning nanomedicine and biotechnology sectors are driving innovation in drug delivery systems and tissue engineering, creating new applications for bioactive materials. The development of novel bioactive composites and ceramics with enhanced mechanical strength and tailored functionalities further contributes to market growth. Finally, supportive government initiatives and increasing healthcare expenditure in developing economies like those in the Asia-Pacific region are further accelerating market expansion.
Bioactive Materials Market Market Size (In Billion)
However, certain challenges may hinder market growth. The high cost of bioactive materials compared to traditional alternatives can limit accessibility, particularly in low- and middle-income countries. Moreover, the regulatory complexities associated with the approval and commercialization of novel bioactive materials can create barriers to entry for smaller companies. Despite these limitations, the long-term outlook for the bioactive materials market remains positive, driven by continuous technological advancements, expanding application areas, and a growing aging population requiring orthopedic and dental interventions. The market segmentation, with strong growth expected in bioactive composites and applications within orthopedics and nanomedicine, presents significant opportunities for strategic market players. Competition is expected to intensify amongst established players and emerging companies striving for market share in this dynamic and rapidly evolving field.
Bioactive Materials Market Company Market Share
Bioactive Materials Market: A Comprehensive Report (2019-2033)
This comprehensive report provides an in-depth analysis of the Bioactive Materials market, offering actionable insights for stakeholders across the value chain. With a study period spanning 2019-2033, a base year of 2025, and a forecast period of 2025-2033, this report leverages rigorous research to illuminate market dynamics, growth drivers, and emerging opportunities. The market is segmented by Material Type (Bioactive Glass, Bioactive Ceramics, Bioactive Composites, Other Material Types) and Application (Orthopedics, Dental Care, Nanomedicines and Biotechnology, Other Applications), providing granular insights into key market segments. The report also profiles leading players such as Medtronic Inc, Septodont Holding, Arthrex Inc, and more, highlighting their strategies and market positions. Expect detailed analysis of market size (in Millions), CAGR, and key trends shaping this rapidly evolving sector.
Bioactive Materials Market Concentration & Dynamics
The Bioactive Materials market exhibits a moderately concentrated landscape, with a few major players holding significant market share. However, the presence of numerous smaller companies and startups indicates a dynamic competitive environment. Innovation is a key driver, with companies constantly developing new materials and applications. Regulatory frameworks, particularly those related to medical devices and pharmaceuticals, play a crucial role in shaping market access and product development. Substitute products, such as traditional biomaterials, pose a competitive challenge, while evolving end-user trends, particularly in the medical and dental sectors, are driving demand for advanced bioactive materials. The historical period (2019-2024) witnessed approximately xx M&A deals, with a projected increase to xx deals during the forecast period (2025-2033). Key market share holders include (data in Millions):
- Medtronic Inc: xx%
- Zimmer Holdings Inc: xx%
- Stryker Corporation: xx%
- DePuy Synthes (Johnson and Johnson): xx%
- Others: xx%
Bioactive Materials Market Industry Insights & Trends
The Bioactive Materials market is experiencing robust growth, with a projected CAGR of xx% during the forecast period (2025-2033). This growth is fueled by several factors, including the increasing prevalence of chronic diseases requiring orthopedic and dental implants, the rising demand for advanced drug delivery systems, and advancements in nanotechnology. Technological disruptions, such as the development of novel biocompatible materials and 3D printing techniques, are revolutionizing the manufacturing and application of bioactive materials. Evolving consumer behaviors, including a greater emphasis on minimally invasive procedures and personalized medicine, are further driving market expansion. The market size in 2025 is estimated to be xx Million, expected to reach xx Million by 2033.
Key Markets & Segments Leading Bioactive Materials Market
The orthopedics segment currently dominates the Bioactive Materials market, driven by the increasing prevalence of musculoskeletal disorders and the growing demand for advanced implants and bone grafts. The dental care segment is also experiencing significant growth, fueled by the increasing adoption of dental implants and the growing awareness of oral health. Within material types, bioactive ceramics hold the largest market share due to their biocompatibility, strength, and versatility.
- Dominant Region: North America
- Drivers: High healthcare expenditure, advanced medical infrastructure, and strong regulatory support.
- Dominant Segment (Material Type): Bioactive Ceramics
- Drivers: Superior biocompatibility, mechanical properties, and versatility in applications.
- Dominant Segment (Application): Orthopedics
- Drivers: High incidence of musculoskeletal disorders, growing demand for joint replacements, and bone grafts.
Bioactive Materials Market Product Developments
Recent years have witnessed significant advancements in bioactive material technology, including the development of novel biocompatible materials with enhanced mechanical properties and improved bioactivity. These advancements have led to the creation of innovative products with improved efficacy and reduced side effects. The incorporation of nanotechnology has further enhanced the performance and versatility of bioactive materials, enabling the development of targeted drug delivery systems and advanced tissue engineering scaffolds.
Challenges in the Bioactive Materials Market Market
The Bioactive Materials market faces several challenges, including stringent regulatory requirements for medical devices, supply chain disruptions affecting raw material availability, and intense competition from established players and emerging companies. These factors can impact production costs, timelines, and market entry strategies, potentially hindering overall market growth. The regulatory landscape's complexity also adds to the time and cost of bringing new products to market.
Forces Driving Bioactive Materials Market Growth
Key growth drivers include the rising prevalence of chronic diseases necessitating implants and grafts, technological advancements in biomaterial design and manufacturing, and supportive government initiatives promoting healthcare infrastructure development. Specifically, the increasing adoption of minimally invasive surgical techniques and personalized medicine is contributing significantly to market growth.
Long-Term Growth Catalysts in the Bioactive Materials Market
Continued innovation in materials science, strategic partnerships for research and development, and expansion into emerging markets are expected to drive long-term growth in the bioactive materials sector. The development of bioresorbable materials and the integration of advanced technologies like 3D printing will create new avenues for market expansion.
Emerging Opportunities in Bioactive Materials Market
Emerging opportunities lie in the development of novel bioactive materials for regenerative medicine, personalized medicine applications, and expansion into untapped markets in developing economies. The growing focus on sustainable and biodegradable materials presents additional avenues for growth.
Leading Players in the Bioactive Materials Market Sector
- Medtronic Inc
- Septodont Holding
- Arthrex Inc
- Collagen Matrix Inc
- Pulpdent Corporation
- Biomatlante
- Ceraver
- Bioactive Bone Substitutes OyJ
- DSM
- Cam Bioceramics
- Zimmer Holdings Inc
- BTG (Boston Scientific)
- OSARTIS GmbH
- Stryker Corporation
- DePuy Synthes (Johnson and Johnson)
- Evonik Industries
- Noraker
Key Milestones in Bioactive Materials Market Industry
- September 2022: DSM partnered with NutriLeads to develop BeniCaros, a bioactive polysaccharide ingredient, expanding DSM's product portfolio in supplement ingredients. This partnership highlights the growing interest in bioactive materials across various sectors beyond traditional medical applications.
Strategic Outlook for Bioactive Materials Market Market
The future of the Bioactive Materials market is bright, with significant growth potential driven by technological advancements, expanding applications, and increasing demand for innovative healthcare solutions. Strategic partnerships, investments in research and development, and a focus on sustainable and biocompatible materials will be key to success in this dynamic market.
Bioactive Materials Market Segmentation
-
1. Material Type
- 1.1. Bioactive Glass
- 1.2. Bioactive Ceramics
- 1.3. Bioactive Composites
- 1.4. Other Material Types
-
2. Application
- 2.1. Orthopedics
- 2.2. Dental Care
- 2.3. Nanomedicines and Biotechnology
- 2.4. Other Applications
Bioactive Materials Market Segmentation By Geography
-
1. Asia Pacific
- 1.1. China
- 1.2. India
- 1.3. Japan
- 1.4. South Korea
- 1.5. Rest of Asia Pacific
-
2. North America
- 2.1. United States
- 2.2. Canada
- 2.3. Mexico
-
3. Europe
- 3.1. Germany
- 3.2. United Kingdom
- 3.3. France
- 3.4. Italy
- 3.5. Rest of Europe
-
4. South America
- 4.1. Brazil
- 4.2. Argentina
- 4.3. Rest of South America
-
5. Middle East and Africa
- 5.1. Saudi Arabia
- 5.2. South Africa
- 5.3. Rest of Middle East and Africa
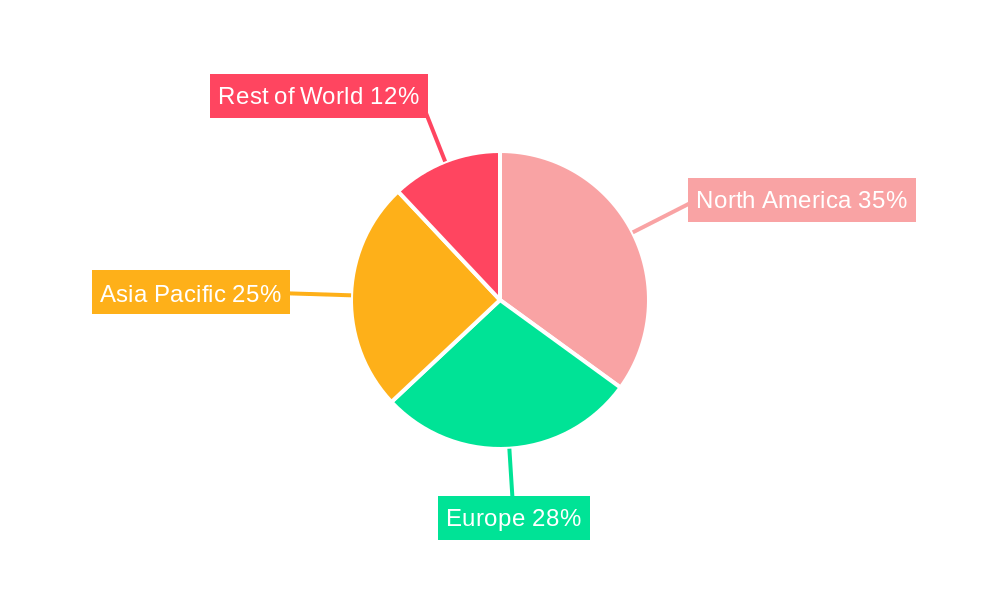
Bioactive Materials Market Regional Market Share
Geographic Coverage of Bioactive Materials Market
Bioactive Materials Market REPORT HIGHLIGHTS
| Aspects | Details |
|---|---|
| Study Period | 2020-2034 |
| Base Year | 2025 |
| Estimated Year | 2026 |
| Forecast Period | 2026-2034 |
| Historical Period | 2020-2025 |
| Growth Rate | CAGR of 14.88% from 2020-2034 |
| Segmentation |
|
Table of Contents
- 1. Introduction
- 1.1. Research Scope
- 1.2. Market Segmentation
- 1.3. Research Objective
- 1.4. Definitions and Assumptions
- 2. Executive Summary
- 2.1. Market Snapshot
- 3. Market Dynamics
- 3.1. Market Drivers
- 3.2. Market Restrains
- 3.3. Market Trends
- 3.4. Market Opportunities
- 4. Market Factor Analysis
- 4.1. Porters Five Forces
- 4.1.1. Bargaining Power of Suppliers
- 4.1.2. Bargaining Power of Buyers
- 4.1.3. Threat of New Entrants
- 4.1.4. Threat of Substitutes
- 4.1.5. Competitive Rivalry
- 4.2. PESTEL analysis
- 4.3. BCG Analysis
- 4.3.1. Stars (High Growth, High Market Share)
- 4.3.2. Cash Cows (Low Growth, High Market Share)
- 4.3.3. Question Mark (High Growth, Low Market Share)
- 4.3.4. Dogs (Low Growth, Low Market Share)
- 4.4. Ansoff Matrix Analysis
- 4.5. Supply Chain Analysis
- 4.6. Regulatory Landscape
- 4.7. Current Market Potential and Opportunity Assessment (TAM–SAM–SOM Framework)
- 4.8. MSR Analyst Note
- 4.1. Porters Five Forces
- 5. Market Analysis, Insights and Forecast 2021-2033
- 5.1. Market Analysis, Insights and Forecast - by Material Type
- 5.1.1. Bioactive Glass
- 5.1.2. Bioactive Ceramics
- 5.1.3. Bioactive Composites
- 5.1.4. Other Material Types
- 5.2. Market Analysis, Insights and Forecast - by Application
- 5.2.1. Orthopedics
- 5.2.2. Dental Care
- 5.2.3. Nanomedicines and Biotechnology
- 5.2.4. Other Applications
- 5.3. Market Analysis, Insights and Forecast - by Region
- 5.3.1. Asia Pacific
- 5.3.2. North America
- 5.3.3. Europe
- 5.3.4. South America
- 5.3.5. Middle East and Africa
- 5.1. Market Analysis, Insights and Forecast - by Material Type
- 6. Global Bioactive Materials Market Analysis, Insights and Forecast, 2021-2033
- 6.1. Market Analysis, Insights and Forecast - by Material Type
- 6.1.1. Bioactive Glass
- 6.1.2. Bioactive Ceramics
- 6.1.3. Bioactive Composites
- 6.1.4. Other Material Types
- 6.2. Market Analysis, Insights and Forecast - by Application
- 6.2.1. Orthopedics
- 6.2.2. Dental Care
- 6.2.3. Nanomedicines and Biotechnology
- 6.2.4. Other Applications
- 6.1. Market Analysis, Insights and Forecast - by Material Type
- 7. Asia Pacific Bioactive Materials Market Analysis, Insights and Forecast, 2020-2032
- 7.1. Market Analysis, Insights and Forecast - by Material Type
- 7.1.1. Bioactive Glass
- 7.1.2. Bioactive Ceramics
- 7.1.3. Bioactive Composites
- 7.1.4. Other Material Types
- 7.2. Market Analysis, Insights and Forecast - by Application
- 7.2.1. Orthopedics
- 7.2.2. Dental Care
- 7.2.3. Nanomedicines and Biotechnology
- 7.2.4. Other Applications
- 7.1. Market Analysis, Insights and Forecast - by Material Type
- 8. North America Bioactive Materials Market Analysis, Insights and Forecast, 2020-2032
- 8.1. Market Analysis, Insights and Forecast - by Material Type
- 8.1.1. Bioactive Glass
- 8.1.2. Bioactive Ceramics
- 8.1.3. Bioactive Composites
- 8.1.4. Other Material Types
- 8.2. Market Analysis, Insights and Forecast - by Application
- 8.2.1. Orthopedics
- 8.2.2. Dental Care
- 8.2.3. Nanomedicines and Biotechnology
- 8.2.4. Other Applications
- 8.1. Market Analysis, Insights and Forecast - by Material Type
- 9. Europe Bioactive Materials Market Analysis, Insights and Forecast, 2020-2032
- 9.1. Market Analysis, Insights and Forecast - by Material Type
- 9.1.1. Bioactive Glass
- 9.1.2. Bioactive Ceramics
- 9.1.3. Bioactive Composites
- 9.1.4. Other Material Types
- 9.2. Market Analysis, Insights and Forecast - by Application
- 9.2.1. Orthopedics
- 9.2.2. Dental Care
- 9.2.3. Nanomedicines and Biotechnology
- 9.2.4. Other Applications
- 9.1. Market Analysis, Insights and Forecast - by Material Type
- 10. South America Bioactive Materials Market Analysis, Insights and Forecast, 2020-2032
- 10.1. Market Analysis, Insights and Forecast - by Material Type
- 10.1.1. Bioactive Glass
- 10.1.2. Bioactive Ceramics
- 10.1.3. Bioactive Composites
- 10.1.4. Other Material Types
- 10.2. Market Analysis, Insights and Forecast - by Application
- 10.2.1. Orthopedics
- 10.2.2. Dental Care
- 10.2.3. Nanomedicines and Biotechnology
- 10.2.4. Other Applications
- 10.1. Market Analysis, Insights and Forecast - by Material Type
- 11. Middle East and Africa Bioactive Materials Market Analysis, Insights and Forecast, 2020-2032
- 11.1. Market Analysis, Insights and Forecast - by Material Type
- 11.1.1. Bioactive Glass
- 11.1.2. Bioactive Ceramics
- 11.1.3. Bioactive Composites
- 11.1.4. Other Material Types
- 11.2. Market Analysis, Insights and Forecast - by Application
- 11.2.1. Orthopedics
- 11.2.2. Dental Care
- 11.2.3. Nanomedicines and Biotechnology
- 11.2.4. Other Applications
- 11.1. Market Analysis, Insights and Forecast - by Material Type
- 12. Competitive Analysis
- 12.1. Company Profiles
- 12.1.1 Medtronic Inc
- 12.1.1.1. Company Overview
- 12.1.1.2. Products
- 12.1.1.3. Company Financials
- 12.1.1.4. SWOT Analysis
- 12.1.2 Septodont Holding
- 12.1.2.1. Company Overview
- 12.1.2.2. Products
- 12.1.2.3. Company Financials
- 12.1.2.4. SWOT Analysis
- 12.1.3 Arthrex Inc
- 12.1.3.1. Company Overview
- 12.1.3.2. Products
- 12.1.3.3. Company Financials
- 12.1.3.4. SWOT Analysis
- 12.1.4 Collagen Matrix Inc
- 12.1.4.1. Company Overview
- 12.1.4.2. Products
- 12.1.4.3. Company Financials
- 12.1.4.4. SWOT Analysis
- 12.1.5 Pulpdent Corporation
- 12.1.5.1. Company Overview
- 12.1.5.2. Products
- 12.1.5.3. Company Financials
- 12.1.5.4. SWOT Analysis
- 12.1.6 Biomatlante
- 12.1.6.1. Company Overview
- 12.1.6.2. Products
- 12.1.6.3. Company Financials
- 12.1.6.4. SWOT Analysis
- 12.1.7 Ceraver
- 12.1.7.1. Company Overview
- 12.1.7.2. Products
- 12.1.7.3. Company Financials
- 12.1.7.4. SWOT Analysis
- 12.1.8 Bioactive Bone Substitutes OyJ
- 12.1.8.1. Company Overview
- 12.1.8.2. Products
- 12.1.8.3. Company Financials
- 12.1.8.4. SWOT Analysis
- 12.1.9 DSM
- 12.1.9.1. Company Overview
- 12.1.9.2. Products
- 12.1.9.3. Company Financials
- 12.1.9.4. SWOT Analysis
- 12.1.10 Cam Bioceramics
- 12.1.10.1. Company Overview
- 12.1.10.2. Products
- 12.1.10.3. Company Financials
- 12.1.10.4. SWOT Analysis
- 12.1.11 Zimmer Holdings Inc *List Not Exhaustive
- 12.1.11.1. Company Overview
- 12.1.11.2. Products
- 12.1.11.3. Company Financials
- 12.1.11.4. SWOT Analysis
- 12.1.12 BTG (Boston Scientific)
- 12.1.12.1. Company Overview
- 12.1.12.2. Products
- 12.1.12.3. Company Financials
- 12.1.12.4. SWOT Analysis
- 12.1.13 OSARTIS GmbH
- 12.1.13.1. Company Overview
- 12.1.13.2. Products
- 12.1.13.3. Company Financials
- 12.1.13.4. SWOT Analysis
- 12.1.14 Stryker Corporation
- 12.1.14.1. Company Overview
- 12.1.14.2. Products
- 12.1.14.3. Company Financials
- 12.1.14.4. SWOT Analysis
- 12.1.15 DePuy Synthes (Johnson and Johnson)
- 12.1.15.1. Company Overview
- 12.1.15.2. Products
- 12.1.15.3. Company Financials
- 12.1.15.4. SWOT Analysis
- 12.1.16 Evonik Industries
- 12.1.16.1. Company Overview
- 12.1.16.2. Products
- 12.1.16.3. Company Financials
- 12.1.16.4. SWOT Analysis
- 12.1.17 Noraker
- 12.1.17.1. Company Overview
- 12.1.17.2. Products
- 12.1.17.3. Company Financials
- 12.1.17.4. SWOT Analysis
- 12.1.1 Medtronic Inc
- 12.2. Market Entropy
- 12.2.1 Company's Key Areas Served
- 12.2.2 Recent Developments
- 12.3. Company Market Share Analysis 2025
- 12.3.1 Top 5 Companies Market Share Analysis
- 12.3.2 Top 3 Companies Market Share Analysis
- 12.4. List of Potential Customers
- 13. Research Methodology
List of Figures
- Figure 1: Global Bioactive Materials Market Revenue Breakdown (Million, %) by Region 2025 & 2033
- Figure 2: Asia Pacific Bioactive Materials Market Revenue (Million), by Material Type 2025 & 2033
- Figure 3: Asia Pacific Bioactive Materials Market Revenue Share (%), by Material Type 2025 & 2033
- Figure 4: Asia Pacific Bioactive Materials Market Revenue (Million), by Application 2025 & 2033
- Figure 5: Asia Pacific Bioactive Materials Market Revenue Share (%), by Application 2025 & 2033
- Figure 6: Asia Pacific Bioactive Materials Market Revenue (Million), by Country 2025 & 2033
- Figure 7: Asia Pacific Bioactive Materials Market Revenue Share (%), by Country 2025 & 2033
- Figure 8: North America Bioactive Materials Market Revenue (Million), by Material Type 2025 & 2033
- Figure 9: North America Bioactive Materials Market Revenue Share (%), by Material Type 2025 & 2033
- Figure 10: North America Bioactive Materials Market Revenue (Million), by Application 2025 & 2033
- Figure 11: North America Bioactive Materials Market Revenue Share (%), by Application 2025 & 2033
- Figure 12: North America Bioactive Materials Market Revenue (Million), by Country 2025 & 2033
- Figure 13: North America Bioactive Materials Market Revenue Share (%), by Country 2025 & 2033
- Figure 14: Europe Bioactive Materials Market Revenue (Million), by Material Type 2025 & 2033
- Figure 15: Europe Bioactive Materials Market Revenue Share (%), by Material Type 2025 & 2033
- Figure 16: Europe Bioactive Materials Market Revenue (Million), by Application 2025 & 2033
- Figure 17: Europe Bioactive Materials Market Revenue Share (%), by Application 2025 & 2033
- Figure 18: Europe Bioactive Materials Market Revenue (Million), by Country 2025 & 2033
- Figure 19: Europe Bioactive Materials Market Revenue Share (%), by Country 2025 & 2033
- Figure 20: South America Bioactive Materials Market Revenue (Million), by Material Type 2025 & 2033
- Figure 21: South America Bioactive Materials Market Revenue Share (%), by Material Type 2025 & 2033
- Figure 22: South America Bioactive Materials Market Revenue (Million), by Application 2025 & 2033
- Figure 23: South America Bioactive Materials Market Revenue Share (%), by Application 2025 & 2033
- Figure 24: South America Bioactive Materials Market Revenue (Million), by Country 2025 & 2033
- Figure 25: South America Bioactive Materials Market Revenue Share (%), by Country 2025 & 2033
- Figure 26: Middle East and Africa Bioactive Materials Market Revenue (Million), by Material Type 2025 & 2033
- Figure 27: Middle East and Africa Bioactive Materials Market Revenue Share (%), by Material Type 2025 & 2033
- Figure 28: Middle East and Africa Bioactive Materials Market Revenue (Million), by Application 2025 & 2033
- Figure 29: Middle East and Africa Bioactive Materials Market Revenue Share (%), by Application 2025 & 2033
- Figure 30: Middle East and Africa Bioactive Materials Market Revenue (Million), by Country 2025 & 2033
- Figure 31: Middle East and Africa Bioactive Materials Market Revenue Share (%), by Country 2025 & 2033
List of Tables
- Table 1: Global Bioactive Materials Market Revenue Million Forecast, by Material Type 2020 & 2033
- Table 2: Global Bioactive Materials Market Revenue Million Forecast, by Application 2020 & 2033
- Table 3: Global Bioactive Materials Market Revenue Million Forecast, by Region 2020 & 2033
- Table 4: Global Bioactive Materials Market Revenue Million Forecast, by Material Type 2020 & 2033
- Table 5: Global Bioactive Materials Market Revenue Million Forecast, by Application 2020 & 2033
- Table 6: Global Bioactive Materials Market Revenue Million Forecast, by Country 2020 & 2033
- Table 7: China Bioactive Materials Market Revenue (Million) Forecast, by Application 2020 & 2033
- Table 8: India Bioactive Materials Market Revenue (Million) Forecast, by Application 2020 & 2033
- Table 9: Japan Bioactive Materials Market Revenue (Million) Forecast, by Application 2020 & 2033
- Table 10: South Korea Bioactive Materials Market Revenue (Million) Forecast, by Application 2020 & 2033
- Table 11: Rest of Asia Pacific Bioactive Materials Market Revenue (Million) Forecast, by Application 2020 & 2033
- Table 12: Global Bioactive Materials Market Revenue Million Forecast, by Material Type 2020 & 2033
- Table 13: Global Bioactive Materials Market Revenue Million Forecast, by Application 2020 & 2033
- Table 14: Global Bioactive Materials Market Revenue Million Forecast, by Country 2020 & 2033
- Table 15: United States Bioactive Materials Market Revenue (Million) Forecast, by Application 2020 & 2033
- Table 16: Canada Bioactive Materials Market Revenue (Million) Forecast, by Application 2020 & 2033
- Table 17: Mexico Bioactive Materials Market Revenue (Million) Forecast, by Application 2020 & 2033
- Table 18: Global Bioactive Materials Market Revenue Million Forecast, by Material Type 2020 & 2033
- Table 19: Global Bioactive Materials Market Revenue Million Forecast, by Application 2020 & 2033
- Table 20: Global Bioactive Materials Market Revenue Million Forecast, by Country 2020 & 2033
- Table 21: Germany Bioactive Materials Market Revenue (Million) Forecast, by Application 2020 & 2033
- Table 22: United Kingdom Bioactive Materials Market Revenue (Million) Forecast, by Application 2020 & 2033
- Table 23: France Bioactive Materials Market Revenue (Million) Forecast, by Application 2020 & 2033
- Table 24: Italy Bioactive Materials Market Revenue (Million) Forecast, by Application 2020 & 2033
- Table 25: Rest of Europe Bioactive Materials Market Revenue (Million) Forecast, by Application 2020 & 2033
- Table 26: Global Bioactive Materials Market Revenue Million Forecast, by Material Type 2020 & 2033
- Table 27: Global Bioactive Materials Market Revenue Million Forecast, by Application 2020 & 2033
- Table 28: Global Bioactive Materials Market Revenue Million Forecast, by Country 2020 & 2033
- Table 29: Brazil Bioactive Materials Market Revenue (Million) Forecast, by Application 2020 & 2033
- Table 30: Argentina Bioactive Materials Market Revenue (Million) Forecast, by Application 2020 & 2033
- Table 31: Rest of South America Bioactive Materials Market Revenue (Million) Forecast, by Application 2020 & 2033
- Table 32: Global Bioactive Materials Market Revenue Million Forecast, by Material Type 2020 & 2033
- Table 33: Global Bioactive Materials Market Revenue Million Forecast, by Application 2020 & 2033
- Table 34: Global Bioactive Materials Market Revenue Million Forecast, by Country 2020 & 2033
- Table 35: Saudi Arabia Bioactive Materials Market Revenue (Million) Forecast, by Application 2020 & 2033
- Table 36: South Africa Bioactive Materials Market Revenue (Million) Forecast, by Application 2020 & 2033
- Table 37: Rest of Middle East and Africa Bioactive Materials Market Revenue (Million) Forecast, by Application 2020 & 2033
Frequently Asked Questions
1. What is the projected Compound Annual Growth Rate (CAGR) of the Bioactive Materials Market?
The projected CAGR is approximately 14.88%.
2. Which companies are prominent players in the Bioactive Materials Market?
Key companies in the market include Medtronic Inc, Septodont Holding, Arthrex Inc, Collagen Matrix Inc, Pulpdent Corporation, Biomatlante, Ceraver, Bioactive Bone Substitutes OyJ, DSM, Cam Bioceramics, Zimmer Holdings Inc *List Not Exhaustive, BTG (Boston Scientific), OSARTIS GmbH, Stryker Corporation, DePuy Synthes (Johnson and Johnson), Evonik Industries, Noraker.
3. What are the main segments of the Bioactive Materials Market?
The market segments include Material Type, Application.
4. Can you provide details about the market size?
The market size is estimated to be USD 2.65 Million as of 2022.
5. What are some drivers contributing to market growth?
Growing Demand for Dental Care and Root Canal Treatment; Increasing Applications in Medical Industry.
6. What are the notable trends driving market growth?
Growing Demand from Orthopedics.
7. Are there any restraints impacting market growth?
High Cost. Regulations. and Probable Toxicity.
8. Can you provide examples of recent developments in the market?
In September 2022, DSM partnered with NutriLeads to develop BeniCaros, a bioactive polysaccharide ingredient that will expand DSM's product portfolio in the supplement ingredient manufacturing market.
9. What pricing options are available for accessing the report?
Pricing options include single-user, multi-user, and enterprise licenses priced at USD 4750, USD 5250, and USD 8750 respectively.
10. Is the market size provided in terms of value or volume?
The market size is provided in terms of value, measured in Million.
11. Are there any specific market keywords associated with the report?
Yes, the market keyword associated with the report is "Bioactive Materials Market," which aids in identifying and referencing the specific market segment covered.
12. How do I determine which pricing option suits my needs best?
The pricing options vary based on user requirements and access needs. Individual users may opt for single-user licenses, while businesses requiring broader access may choose multi-user or enterprise licenses for cost-effective access to the report.
13. Are there any additional resources or data provided in the Bioactive Materials Market report?
While the report offers comprehensive insights, it's advisable to review the specific contents or supplementary materials provided to ascertain if additional resources or data are available.
14. How can I stay updated on further developments or reports in the Bioactive Materials Market?
To stay informed about further developments, trends, and reports in the Bioactive Materials Market, consider subscribing to industry newsletters, following relevant companies and organizations, or regularly checking reputable industry news sources and publications.
Methodology
Step 1 - Identification of Relevant Samples Size from Population Database


Step 2 - Approaches for Defining Global Market Size (Value, Volume* & Price*)

Note*: In applicable scenarios
Step 3 - Data Sources
Primary Research
- Web Analytics
- Survey Reports
- Research Institute
- Latest Research Reports
- Opinion Leaders
Secondary Research
- Annual Reports
- White Paper
- Latest Press Release
- Industry Association
- Paid Database
- Investor Presentations

Step 4 - Data Triangulation
Involves using different sources of information in order to increase the validity of a study
These sources are likely to be stakeholders in a program - participants, other researchers, program staff, other community members, and so on.
Then we put all data in single framework & apply various statistical tools to find out the dynamic on the market.
During the analysis stage, feedback from the stakeholder groups would be compared to determine areas of agreement as well as areas of divergence