

Key Insights
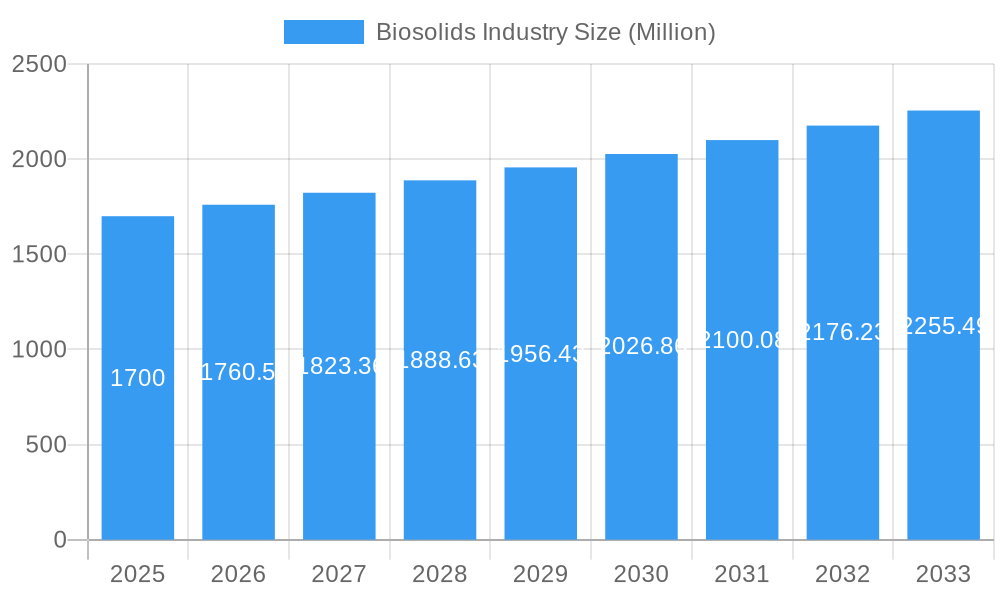
The biosolids market, valued at $1.7 billion in 2025, is projected to experience robust growth, exhibiting a Compound Annual Growth Rate (CAGR) exceeding 3.5% from 2025 to 2033. This expansion is driven by several key factors. Increasing environmental regulations aimed at reducing landfill waste and promoting sustainable waste management practices are significantly boosting the adoption of biosolids as a valuable resource. The rising demand for organic fertilizers in agriculture, particularly for crop production and pastureland improvement, fuels market growth. Furthermore, the energy recovery potential of biosolids, through processes like anaerobic digestion, is attracting investment and creating new revenue streams, particularly in regions with stringent energy policies. Different forms of biosolids, including cakes, liquids, and pellets, cater to diverse applications, adding further complexity and opportunity to this expanding market. The segmentation by application (agricultural, non-agricultural, energy recovery) and type (Class A, Class A EQ, Class B) reflects the market's nuanced structure and the varying quality requirements across different end-use sectors.
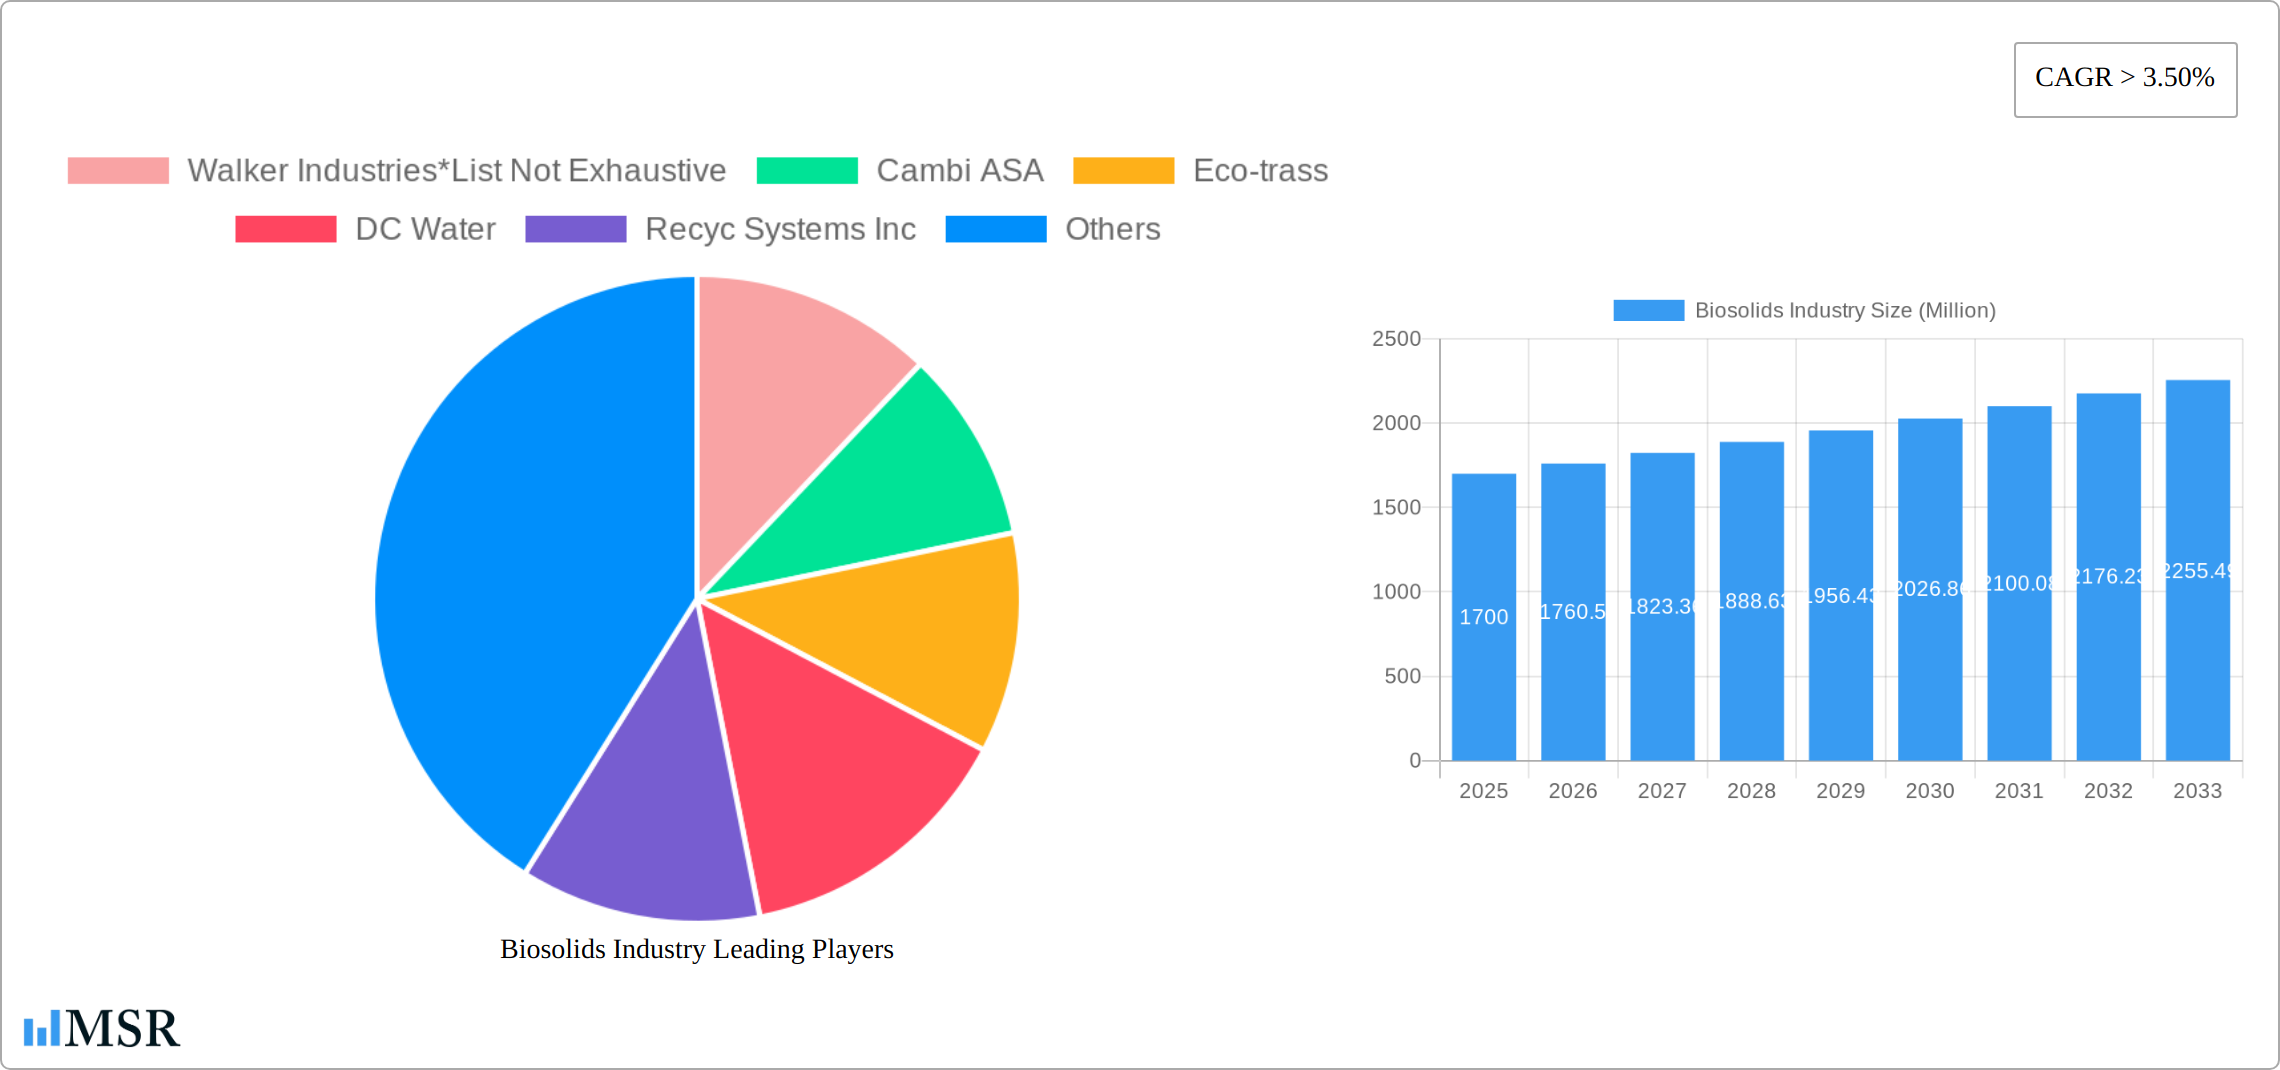
Biosolids Industry Market Size (In Billion)
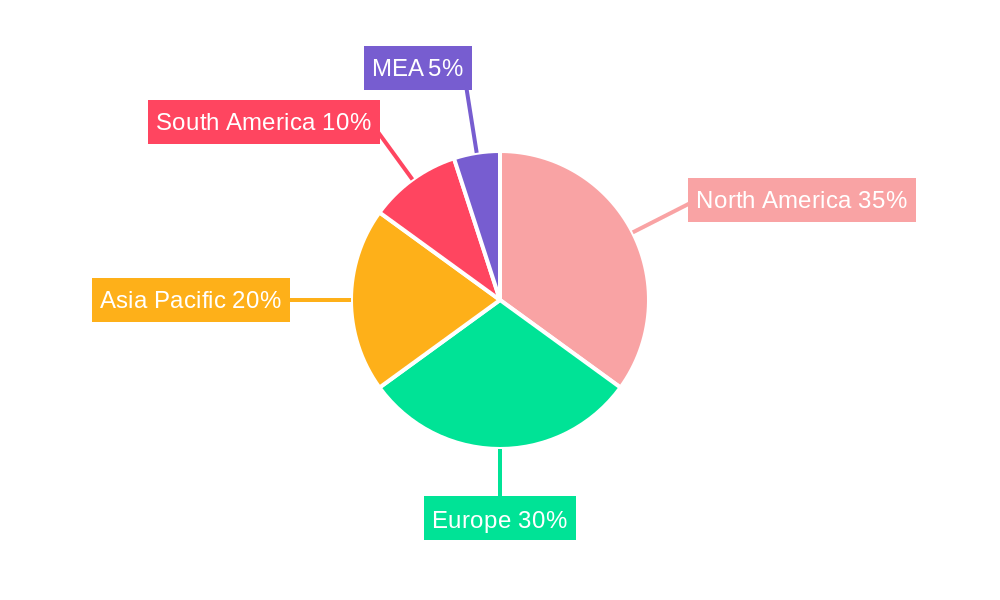
Geographic distribution of the biosolids market reveals significant regional variations. North America, with its established infrastructure and stringent environmental regulations, holds a substantial market share. Europe follows closely, driven by similar regulatory pressures and a focus on sustainable agriculture. The Asia-Pacific region is expected to experience considerable growth, fueled by rapid urbanization, industrialization, and increasing awareness of sustainable waste management practices. While the provided data doesn't offer precise regional breakdowns, it's evident that North America and Europe represent mature markets, while Asia-Pacific, South America, and the Middle East and Africa present significant growth potential as their economies develop and environmental regulations tighten. The presence of numerous players like Walker Industries, Cambi ASA, and Lystek International underscores the competitive landscape, encouraging innovation and efficiency improvements within the industry.
Biosolids Industry Company Market Share
Biosolids Industry Market Report: 2019-2033
This comprehensive report provides a detailed analysis of the global biosolids industry, offering actionable insights for stakeholders across the value chain. With a study period spanning 2019-2033, a base year of 2025, and a forecast period of 2025-2033, this report leverages historical data (2019-2024) to project future market trends and opportunities. The report examines a market valued at xx Million USD in 2025, projecting substantial growth by 2033. Discover key trends, challenges, and opportunities within segments including Class A, Class A EQ, and Class B biosolids, encompassing various forms (cakes, liquid, pellets) and applications (agriculture, landscaping, energy recovery).
Biosolids Industry Market Concentration & Dynamics
The global biosolids market exhibits a moderately concentrated structure, with several key players commanding significant market share. However, the landscape is dynamic, characterized by ongoing innovation, evolving regulatory frameworks, and a growing number of mergers and acquisitions (M&A). Market leaders like Synagro Technologies and Walker Industries influence market dynamics significantly, while smaller players focus on niche applications and geographical regions. The M&A activity is driven by several factors, including the pursuit of economies of scale, expansion into new markets, and access to advanced technologies. For example, the acquisition of Burch Hydro Inc. by Synagro Technologies in January 2023 strengthened its market position.
- Market Concentration: The top 5 players hold an estimated xx% market share in 2025.
- M&A Activity: An estimated xx M&A deals occurred between 2019 and 2024, with an anticipated xx deals annually during the forecast period.
- Innovation: Focus areas include improved biosolids processing technologies and enhanced applications for sustainable agriculture and energy production.
- Regulatory Landscape: Stringent environmental regulations and evolving standards for biosolids application are shaping market practices and driving technological advancements.
- Substitute Products: Competition from alternative fertilizers and waste management solutions influences market growth.
Biosolids Industry Industry Insights & Trends
The biosolids market is experiencing robust growth, driven by increasing urbanization, stringent environmental regulations promoting sustainable waste management, and the growing demand for eco-friendly fertilizers and energy sources. The market size is projected to reach xx Million USD by 2033, exhibiting a compound annual growth rate (CAGR) of xx% during the forecast period. Technological advancements, particularly in thermal hydrolysis and anaerobic digestion, are improving the quality and usability of biosolids, opening up new application opportunities. Evolving consumer preferences towards sustainable and environmentally friendly practices are further boosting demand for biosolids-based products.
Key Markets & Segments Leading Biosolids Industry
The North American market currently dominates the global biosolids industry, driven by robust infrastructure, stringent environmental regulations, and a well-established waste management sector. However, other regions, particularly Europe and Asia-Pacific, are witnessing significant growth due to increasing investments in wastewater treatment infrastructure and rising awareness of sustainable waste management practices.
- Dominant Region: North America (xx Million USD in 2025).
- Leading Segment (Form): Liquid biosolids currently hold the largest market share due to its ease of application, followed by cakes and pellets.
- Leading Segment (Application): Agriculture land application remains the primary application, followed by landscaping and recreational fields.
- Growth Drivers:
- Stringent environmental regulations mandating sustainable waste management.
- Increasing urbanization leading to higher volumes of wastewater.
- Growing demand for eco-friendly fertilizers and soil amendments.
- Technological advancements resulting in higher-quality biosolids.
- Government incentives and subsidies promoting biosolids utilization.
Biosolids Industry Product Developments
The biosolids industry is experiencing a surge in innovative processing technologies, significantly improving the quality and applications of biosolids. Advanced anaerobic digestion and thermal hydrolysis are leading the charge, yielding higher-quality biosolids with enhanced nutrient content and drastically reduced pathogen levels. This advancement opens doors to a wider range of applications, including sustainable agriculture, landscaping enhancements, and even bioenergy production. Furthermore, companies are actively developing specialized biosolids products tailored to meet the precise needs of various sectors, boosting market relevance and driving stronger competitiveness. This targeted approach is paving the way for greater market penetration and wider acceptance.
Challenges in the Biosolids Industry Market
Despite significant advancements, the biosolids industry faces considerable hurdles. Stringent regulatory compliance demands substantial investments and ongoing costs, impacting profitability. Supply chain disruptions, including raw material scarcity and transportation bottlenecks, further complicate operations. Intense competition from alternative waste management solutions and fertilizers adds pressure. Public perception and concerns surrounding biosolids application in specific contexts also present a challenge to market expansion. These factors cumulatively affect market growth, with the estimated impact in 2025 projected at xx Million USD. Addressing these challenges requires a multi-faceted approach, including innovative solutions for cost-effective compliance, resilient supply chains, and targeted public education campaigns.
Forces Driving Biosolids Industry Growth
Several factors are driving the growth of the biosolids industry, including technological advancements that improve biosolids quality and expand applications, supportive government policies and regulations promoting sustainable waste management, and increasing demand for environmentally friendly and cost-effective fertilizers and soil amendments. The growing awareness of the environmental and economic benefits of biosolids utilization further fuels market expansion.
Long-Term Growth Catalysts in the Biosolids Industry
Long-term growth will be driven by continuous innovation in biosolids processing technologies, strategic partnerships between wastewater treatment plants and agricultural/energy companies, and expansion into new and emerging markets. This includes exploring opportunities in biosolids-based biofuel production and advanced nutrient recovery techniques.
Emerging Opportunities in Biosolids Industry
The biosolids industry is brimming with exciting opportunities for growth and innovation. The potential for bioenergy production from biosolids is rapidly gaining traction, offering a sustainable energy source. The development of value-added products such as biochar, a highly effective soil amendment, and biostimulants, which enhance plant growth, are attracting significant investment. Expansion into new geographical markets, particularly regions with developing wastewater treatment infrastructure, presents substantial untapped potential. Moreover, pioneering applications, such as integrating biosolids into sustainable construction materials, offer promising avenues for future growth. These emerging opportunities represent significant pathways for industry expansion and diversification.
Leading Players in the Biosolids Industry Sector
- Walker Industries
- Cambi ASA
- Eco-trass
- DC Water
- Recyc Systems Inc
- BCR Environmental
- Aguas Andinas SA
- Cleanaway
- SYLVIS
- Casella Waste Systems Inc
- Englobe
- Agrivert Ltd
- Saur
- Alan Srl
- Lystek International
- REMONDIS SE & Co KG
- FCC Group
- Synagro Technologies
- C R E - Centro di Ricerche Ecologiche
- Parker Ag Services LLC
- Terrapure BR Ltd
- Merrell Bros Inc
- Allevi Srl
Key Milestones in Biosolids Industry Industry
- January 2023: Synagro Technologies Inc. acquired Burch Hydro Inc., expanding its market reach and service offerings. This deal significantly impacted the market share dynamics of the biosolids management segment in Ohio.
- November 2022: The San Francisco Public Utilities Commission (SFPUC) and Cambi partnered to install thermal hydrolysis systems, representing a significant investment in advanced biosolids processing technology and signaling a shift towards higher-quality biosolids production. This USD 3 Billion investment is expected to significantly impact the market by creating a new benchmark in biosolids treatment.
Strategic Outlook for Biosolids Industry Market
The biosolids industry is poised for continued growth, driven by technological advancements, supportive regulatory frameworks, and increasing demand for sustainable solutions. Companies that invest in innovation, strategic partnerships, and expansion into new markets are expected to capitalize on the significant growth potential within this sector. The focus on developing higher-value products from biosolids, such as biofuels and bio-based materials, will further drive market expansion in the coming years.
Biosolids Industry Segmentation
-
1. Type
- 1.1. Class A
- 1.2. Class A EQ (Exceptional Quality)
- 1.3. Class B
-
2. Form
- 2.1. Cakes
- 2.2. Liquid
- 2.3. Pellet
-
3. Application
-
3.1. Agriculture land Application
- 3.1.1. Fertiliz
- 3.1.2. Fertilizer for Animal Crop Production - Pastures
-
3.2. Non-agricultural Land Application
- 3.2.1. Forest Crops (Land Restoration and Forestry)
- 3.2.2. Land Reclamation (Roads and Urban Wetlands)
- 3.2.3. Reclaiming Mining Sites
- 3.2.4. Landscaping, Recreational Fields, and Domestic Use
-
3.3. Energy Recovery Energy Production
- 3.3.1. Heat Generation, Incineration, and Gasification
- 3.3.2. Oil and Cement Production
- 3.3.3. Commercial Uses
-
3.1. Agriculture land Application
Biosolids Industry Segmentation By Geography
-
1. Asia Pacific
- 1.1. China
- 1.2. India
- 1.3. Japan
- 1.4. South Korea
- 1.5. Malaysia
- 1.6. Thailand
- 1.7. Indonesia
- 1.8. Vietnam
- 1.9. Rest of Asia Pacific
-
2. North America
- 2.1. United States
- 2.2. Canada
- 2.3. Mexico
-
3. Europe
- 3.1. Germany
- 3.2. United Kingdom
- 3.3. Italy
- 3.4. France
- 3.5. Spain
- 3.6. NORDIC
- 3.7. Turkey
- 3.8. Russia
- 3.9. Rest of Europe
-
4. South America
- 4.1. Brazil
- 4.2. Argentina
- 4.3. Colombia
- 4.4. Rest of South America
-
5. Middle East and Africa
- 5.1. Saudi Arabia
- 5.2. South Africa
- 5.3. Nigeria
- 5.4. Qatar
- 5.5. Egypt
- 5.6. United Arab Emirates
- 5.7. Rest of Middle East and Africa
Biosolids Industry Regional Market Share
Geographic Coverage of Biosolids Industry
Biosolids Industry REPORT HIGHLIGHTS
| Aspects | Details |
|---|---|
| Study Period | 2020-2034 |
| Base Year | 2025 |
| Estimated Year | 2026 |
| Forecast Period | 2026-2034 |
| Historical Period | 2020-2025 |
| Growth Rate | CAGR of > 3.50% from 2020-2034 |
| Segmentation |
|
Table of Contents
- 1. Introduction
- 1.1. Research Scope
- 1.2. Market Segmentation
- 1.3. Research Objective
- 1.4. Definitions and Assumptions
- 2. Executive Summary
- 2.1. Market Snapshot
- 3. Market Dynamics
- 3.1. Market Drivers
- 3.2. Market Restrains
- 3.3. Market Trends
- 3.4. Market Opportunities
- 4. Market Factor Analysis
- 4.1. Porters Five Forces
- 4.1.1. Bargaining Power of Suppliers
- 4.1.2. Bargaining Power of Buyers
- 4.1.3. Threat of New Entrants
- 4.1.4. Threat of Substitutes
- 4.1.5. Competitive Rivalry
- 4.2. PESTEL analysis
- 4.3. BCG Analysis
- 4.3.1. Stars (High Growth, High Market Share)
- 4.3.2. Cash Cows (Low Growth, High Market Share)
- 4.3.3. Question Mark (High Growth, Low Market Share)
- 4.3.4. Dogs (Low Growth, Low Market Share)
- 4.4. Ansoff Matrix Analysis
- 4.5. Supply Chain Analysis
- 4.6. Regulatory Landscape
- 4.7. Current Market Potential and Opportunity Assessment (TAM–SAM–SOM Framework)
- 4.8. MSR Analyst Note
- 4.1. Porters Five Forces
- 5. Market Analysis, Insights and Forecast 2021-2033
- 5.1. Market Analysis, Insights and Forecast - by Type
- 5.1.1. Class A
- 5.1.2. Class A EQ (Exceptional Quality)
- 5.1.3. Class B
- 5.2. Market Analysis, Insights and Forecast - by Form
- 5.2.1. Cakes
- 5.2.2. Liquid
- 5.2.3. Pellet
- 5.3. Market Analysis, Insights and Forecast - by Application
- 5.3.1. Agriculture land Application
- 5.3.1.1. Fertiliz
- 5.3.1.2. Fertilizer for Animal Crop Production - Pastures
- 5.3.2. Non-agricultural Land Application
- 5.3.2.1. Forest Crops (Land Restoration and Forestry)
- 5.3.2.2. Land Reclamation (Roads and Urban Wetlands)
- 5.3.2.3. Reclaiming Mining Sites
- 5.3.2.4. Landscaping, Recreational Fields, and Domestic Use
- 5.3.3. Energy Recovery Energy Production
- 5.3.3.1. Heat Generation, Incineration, and Gasification
- 5.3.3.2. Oil and Cement Production
- 5.3.3.3. Commercial Uses
- 5.3.1. Agriculture land Application
- 5.4. Market Analysis, Insights and Forecast - by Region
- 5.4.1. Asia Pacific
- 5.4.2. North America
- 5.4.3. Europe
- 5.4.4. South America
- 5.4.5. Middle East and Africa
- 5.1. Market Analysis, Insights and Forecast - by Type
- 6. Global Biosolids Industry Analysis, Insights and Forecast, 2021-2033
- 6.1. Market Analysis, Insights and Forecast - by Type
- 6.1.1. Class A
- 6.1.2. Class A EQ (Exceptional Quality)
- 6.1.3. Class B
- 6.2. Market Analysis, Insights and Forecast - by Form
- 6.2.1. Cakes
- 6.2.2. Liquid
- 6.2.3. Pellet
- 6.3. Market Analysis, Insights and Forecast - by Application
- 6.3.1. Agriculture land Application
- 6.3.1.1. Fertiliz
- 6.3.1.2. Fertilizer for Animal Crop Production - Pastures
- 6.3.2. Non-agricultural Land Application
- 6.3.2.1. Forest Crops (Land Restoration and Forestry)
- 6.3.2.2. Land Reclamation (Roads and Urban Wetlands)
- 6.3.2.3. Reclaiming Mining Sites
- 6.3.2.4. Landscaping, Recreational Fields, and Domestic Use
- 6.3.3. Energy Recovery Energy Production
- 6.3.3.1. Heat Generation, Incineration, and Gasification
- 6.3.3.2. Oil and Cement Production
- 6.3.3.3. Commercial Uses
- 6.3.1. Agriculture land Application
- 6.1. Market Analysis, Insights and Forecast - by Type
- 7. Asia Pacific Biosolids Industry Analysis, Insights and Forecast, 2020-2032
- 7.1. Market Analysis, Insights and Forecast - by Type
- 7.1.1. Class A
- 7.1.2. Class A EQ (Exceptional Quality)
- 7.1.3. Class B
- 7.2. Market Analysis, Insights and Forecast - by Form
- 7.2.1. Cakes
- 7.2.2. Liquid
- 7.2.3. Pellet
- 7.3. Market Analysis, Insights and Forecast - by Application
- 7.3.1. Agriculture land Application
- 7.3.1.1. Fertiliz
- 7.3.1.2. Fertilizer for Animal Crop Production - Pastures
- 7.3.2. Non-agricultural Land Application
- 7.3.2.1. Forest Crops (Land Restoration and Forestry)
- 7.3.2.2. Land Reclamation (Roads and Urban Wetlands)
- 7.3.2.3. Reclaiming Mining Sites
- 7.3.2.4. Landscaping, Recreational Fields, and Domestic Use
- 7.3.3. Energy Recovery Energy Production
- 7.3.3.1. Heat Generation, Incineration, and Gasification
- 7.3.3.2. Oil and Cement Production
- 7.3.3.3. Commercial Uses
- 7.3.1. Agriculture land Application
- 7.1. Market Analysis, Insights and Forecast - by Type
- 8. North America Biosolids Industry Analysis, Insights and Forecast, 2020-2032
- 8.1. Market Analysis, Insights and Forecast - by Type
- 8.1.1. Class A
- 8.1.2. Class A EQ (Exceptional Quality)
- 8.1.3. Class B
- 8.2. Market Analysis, Insights and Forecast - by Form
- 8.2.1. Cakes
- 8.2.2. Liquid
- 8.2.3. Pellet
- 8.3. Market Analysis, Insights and Forecast - by Application
- 8.3.1. Agriculture land Application
- 8.3.1.1. Fertiliz
- 8.3.1.2. Fertilizer for Animal Crop Production - Pastures
- 8.3.2. Non-agricultural Land Application
- 8.3.2.1. Forest Crops (Land Restoration and Forestry)
- 8.3.2.2. Land Reclamation (Roads and Urban Wetlands)
- 8.3.2.3. Reclaiming Mining Sites
- 8.3.2.4. Landscaping, Recreational Fields, and Domestic Use
- 8.3.3. Energy Recovery Energy Production
- 8.3.3.1. Heat Generation, Incineration, and Gasification
- 8.3.3.2. Oil and Cement Production
- 8.3.3.3. Commercial Uses
- 8.3.1. Agriculture land Application
- 8.1. Market Analysis, Insights and Forecast - by Type
- 9. Europe Biosolids Industry Analysis, Insights and Forecast, 2020-2032
- 9.1. Market Analysis, Insights and Forecast - by Type
- 9.1.1. Class A
- 9.1.2. Class A EQ (Exceptional Quality)
- 9.1.3. Class B
- 9.2. Market Analysis, Insights and Forecast - by Form
- 9.2.1. Cakes
- 9.2.2. Liquid
- 9.2.3. Pellet
- 9.3. Market Analysis, Insights and Forecast - by Application
- 9.3.1. Agriculture land Application
- 9.3.1.1. Fertiliz
- 9.3.1.2. Fertilizer for Animal Crop Production - Pastures
- 9.3.2. Non-agricultural Land Application
- 9.3.2.1. Forest Crops (Land Restoration and Forestry)
- 9.3.2.2. Land Reclamation (Roads and Urban Wetlands)
- 9.3.2.3. Reclaiming Mining Sites
- 9.3.2.4. Landscaping, Recreational Fields, and Domestic Use
- 9.3.3. Energy Recovery Energy Production
- 9.3.3.1. Heat Generation, Incineration, and Gasification
- 9.3.3.2. Oil and Cement Production
- 9.3.3.3. Commercial Uses
- 9.3.1. Agriculture land Application
- 9.1. Market Analysis, Insights and Forecast - by Type
- 10. South America Biosolids Industry Analysis, Insights and Forecast, 2020-2032
- 10.1. Market Analysis, Insights and Forecast - by Type
- 10.1.1. Class A
- 10.1.2. Class A EQ (Exceptional Quality)
- 10.1.3. Class B
- 10.2. Market Analysis, Insights and Forecast - by Form
- 10.2.1. Cakes
- 10.2.2. Liquid
- 10.2.3. Pellet
- 10.3. Market Analysis, Insights and Forecast - by Application
- 10.3.1. Agriculture land Application
- 10.3.1.1. Fertiliz
- 10.3.1.2. Fertilizer for Animal Crop Production - Pastures
- 10.3.2. Non-agricultural Land Application
- 10.3.2.1. Forest Crops (Land Restoration and Forestry)
- 10.3.2.2. Land Reclamation (Roads and Urban Wetlands)
- 10.3.2.3. Reclaiming Mining Sites
- 10.3.2.4. Landscaping, Recreational Fields, and Domestic Use
- 10.3.3. Energy Recovery Energy Production
- 10.3.3.1. Heat Generation, Incineration, and Gasification
- 10.3.3.2. Oil and Cement Production
- 10.3.3.3. Commercial Uses
- 10.3.1. Agriculture land Application
- 10.1. Market Analysis, Insights and Forecast - by Type
- 11. Middle East and Africa Biosolids Industry Analysis, Insights and Forecast, 2020-2032
- 11.1. Market Analysis, Insights and Forecast - by Type
- 11.1.1. Class A
- 11.1.2. Class A EQ (Exceptional Quality)
- 11.1.3. Class B
- 11.2. Market Analysis, Insights and Forecast - by Form
- 11.2.1. Cakes
- 11.2.2. Liquid
- 11.2.3. Pellet
- 11.3. Market Analysis, Insights and Forecast - by Application
- 11.3.1. Agriculture land Application
- 11.3.1.1. Fertiliz
- 11.3.1.2. Fertilizer for Animal Crop Production - Pastures
- 11.3.2. Non-agricultural Land Application
- 11.3.2.1. Forest Crops (Land Restoration and Forestry)
- 11.3.2.2. Land Reclamation (Roads and Urban Wetlands)
- 11.3.2.3. Reclaiming Mining Sites
- 11.3.2.4. Landscaping, Recreational Fields, and Domestic Use
- 11.3.3. Energy Recovery Energy Production
- 11.3.3.1. Heat Generation, Incineration, and Gasification
- 11.3.3.2. Oil and Cement Production
- 11.3.3.3. Commercial Uses
- 11.3.1. Agriculture land Application
- 11.1. Market Analysis, Insights and Forecast - by Type
- 12. Competitive Analysis
- 12.1. Company Profiles
- 12.1.1 Walker Industries*List Not Exhaustive
- 12.1.1.1. Company Overview
- 12.1.1.2. Products
- 12.1.1.3. Company Financials
- 12.1.1.4. SWOT Analysis
- 12.1.2 Cambi ASA
- 12.1.2.1. Company Overview
- 12.1.2.2. Products
- 12.1.2.3. Company Financials
- 12.1.2.4. SWOT Analysis
- 12.1.3 Eco-trass
- 12.1.3.1. Company Overview
- 12.1.3.2. Products
- 12.1.3.3. Company Financials
- 12.1.3.4. SWOT Analysis
- 12.1.4 DC Water
- 12.1.4.1. Company Overview
- 12.1.4.2. Products
- 12.1.4.3. Company Financials
- 12.1.4.4. SWOT Analysis
- 12.1.5 Recyc Systems Inc
- 12.1.5.1. Company Overview
- 12.1.5.2. Products
- 12.1.5.3. Company Financials
- 12.1.5.4. SWOT Analysis
- 12.1.6 BCR Environmental
- 12.1.6.1. Company Overview
- 12.1.6.2. Products
- 12.1.6.3. Company Financials
- 12.1.6.4. SWOT Analysis
- 12.1.7 Aguas Andinas SA
- 12.1.7.1. Company Overview
- 12.1.7.2. Products
- 12.1.7.3. Company Financials
- 12.1.7.4. SWOT Analysis
- 12.1.8 Cleanaway
- 12.1.8.1. Company Overview
- 12.1.8.2. Products
- 12.1.8.3. Company Financials
- 12.1.8.4. SWOT Analysis
- 12.1.9 SYLVIS
- 12.1.9.1. Company Overview
- 12.1.9.2. Products
- 12.1.9.3. Company Financials
- 12.1.9.4. SWOT Analysis
- 12.1.10 Casella Waste Systems Inc
- 12.1.10.1. Company Overview
- 12.1.10.2. Products
- 12.1.10.3. Company Financials
- 12.1.10.4. SWOT Analysis
- 12.1.11 Englobe
- 12.1.11.1. Company Overview
- 12.1.11.2. Products
- 12.1.11.3. Company Financials
- 12.1.11.4. SWOT Analysis
- 12.1.12 Agrivert Ltd
- 12.1.12.1. Company Overview
- 12.1.12.2. Products
- 12.1.12.3. Company Financials
- 12.1.12.4. SWOT Analysis
- 12.1.13 Saur
- 12.1.13.1. Company Overview
- 12.1.13.2. Products
- 12.1.13.3. Company Financials
- 12.1.13.4. SWOT Analysis
- 12.1.14 Alan Srl
- 12.1.14.1. Company Overview
- 12.1.14.2. Products
- 12.1.14.3. Company Financials
- 12.1.14.4. SWOT Analysis
- 12.1.15 Lystek International
- 12.1.15.1. Company Overview
- 12.1.15.2. Products
- 12.1.15.3. Company Financials
- 12.1.15.4. SWOT Analysis
- 12.1.16 REMONDIS SE & Co KG
- 12.1.16.1. Company Overview
- 12.1.16.2. Products
- 12.1.16.3. Company Financials
- 12.1.16.4. SWOT Analysis
- 12.1.17 FCC Group
- 12.1.17.1. Company Overview
- 12.1.17.2. Products
- 12.1.17.3. Company Financials
- 12.1.17.4. SWOT Analysis
- 12.1.18 Synagro Technologies
- 12.1.18.1. Company Overview
- 12.1.18.2. Products
- 12.1.18.3. Company Financials
- 12.1.18.4. SWOT Analysis
- 12.1.19 C R E - Centro di Ricerche Ecologiche
- 12.1.19.1. Company Overview
- 12.1.19.2. Products
- 12.1.19.3. Company Financials
- 12.1.19.4. SWOT Analysis
- 12.1.20 Parker Ag Services LLC
- 12.1.20.1. Company Overview
- 12.1.20.2. Products
- 12.1.20.3. Company Financials
- 12.1.20.4. SWOT Analysis
- 12.1.21 Terrapure BR Ltd
- 12.1.21.1. Company Overview
- 12.1.21.2. Products
- 12.1.21.3. Company Financials
- 12.1.21.4. SWOT Analysis
- 12.1.22 Merrell Bros Inc
- 12.1.22.1. Company Overview
- 12.1.22.2. Products
- 12.1.22.3. Company Financials
- 12.1.22.4. SWOT Analysis
- 12.1.23 Allevi Srl
- 12.1.23.1. Company Overview
- 12.1.23.2. Products
- 12.1.23.3. Company Financials
- 12.1.23.4. SWOT Analysis
- 12.1.1 Walker Industries*List Not Exhaustive
- 12.2. Market Entropy
- 12.2.1 Company's Key Areas Served
- 12.2.2 Recent Developments
- 12.3. Company Market Share Analysis 2025
- 12.3.1 Top 5 Companies Market Share Analysis
- 12.3.2 Top 3 Companies Market Share Analysis
- 12.4. List of Potential Customers
- 13. Research Methodology
List of Figures
- Figure 1: Global Biosolids Industry Revenue Breakdown (Million, %) by Region 2025 & 2033
- Figure 2: Global Biosolids Industry Volume Breakdown (liter , %) by Region 2025 & 2033
- Figure 3: Asia Pacific Biosolids Industry Revenue (Million), by Type 2025 & 2033
- Figure 4: Asia Pacific Biosolids Industry Volume (liter ), by Type 2025 & 2033
- Figure 5: Asia Pacific Biosolids Industry Revenue Share (%), by Type 2025 & 2033
- Figure 6: Asia Pacific Biosolids Industry Volume Share (%), by Type 2025 & 2033
- Figure 7: Asia Pacific Biosolids Industry Revenue (Million), by Form 2025 & 2033
- Figure 8: Asia Pacific Biosolids Industry Volume (liter ), by Form 2025 & 2033
- Figure 9: Asia Pacific Biosolids Industry Revenue Share (%), by Form 2025 & 2033
- Figure 10: Asia Pacific Biosolids Industry Volume Share (%), by Form 2025 & 2033
- Figure 11: Asia Pacific Biosolids Industry Revenue (Million), by Application 2025 & 2033
- Figure 12: Asia Pacific Biosolids Industry Volume (liter ), by Application 2025 & 2033
- Figure 13: Asia Pacific Biosolids Industry Revenue Share (%), by Application 2025 & 2033
- Figure 14: Asia Pacific Biosolids Industry Volume Share (%), by Application 2025 & 2033
- Figure 15: Asia Pacific Biosolids Industry Revenue (Million), by Country 2025 & 2033
- Figure 16: Asia Pacific Biosolids Industry Volume (liter ), by Country 2025 & 2033
- Figure 17: Asia Pacific Biosolids Industry Revenue Share (%), by Country 2025 & 2033
- Figure 18: Asia Pacific Biosolids Industry Volume Share (%), by Country 2025 & 2033
- Figure 19: North America Biosolids Industry Revenue (Million), by Type 2025 & 2033
- Figure 20: North America Biosolids Industry Volume (liter ), by Type 2025 & 2033
- Figure 21: North America Biosolids Industry Revenue Share (%), by Type 2025 & 2033
- Figure 22: North America Biosolids Industry Volume Share (%), by Type 2025 & 2033
- Figure 23: North America Biosolids Industry Revenue (Million), by Form 2025 & 2033
- Figure 24: North America Biosolids Industry Volume (liter ), by Form 2025 & 2033
- Figure 25: North America Biosolids Industry Revenue Share (%), by Form 2025 & 2033
- Figure 26: North America Biosolids Industry Volume Share (%), by Form 2025 & 2033
- Figure 27: North America Biosolids Industry Revenue (Million), by Application 2025 & 2033
- Figure 28: North America Biosolids Industry Volume (liter ), by Application 2025 & 2033
- Figure 29: North America Biosolids Industry Revenue Share (%), by Application 2025 & 2033
- Figure 30: North America Biosolids Industry Volume Share (%), by Application 2025 & 2033
- Figure 31: North America Biosolids Industry Revenue (Million), by Country 2025 & 2033
- Figure 32: North America Biosolids Industry Volume (liter ), by Country 2025 & 2033
- Figure 33: North America Biosolids Industry Revenue Share (%), by Country 2025 & 2033
- Figure 34: North America Biosolids Industry Volume Share (%), by Country 2025 & 2033
- Figure 35: Europe Biosolids Industry Revenue (Million), by Type 2025 & 2033
- Figure 36: Europe Biosolids Industry Volume (liter ), by Type 2025 & 2033
- Figure 37: Europe Biosolids Industry Revenue Share (%), by Type 2025 & 2033
- Figure 38: Europe Biosolids Industry Volume Share (%), by Type 2025 & 2033
- Figure 39: Europe Biosolids Industry Revenue (Million), by Form 2025 & 2033
- Figure 40: Europe Biosolids Industry Volume (liter ), by Form 2025 & 2033
- Figure 41: Europe Biosolids Industry Revenue Share (%), by Form 2025 & 2033
- Figure 42: Europe Biosolids Industry Volume Share (%), by Form 2025 & 2033
- Figure 43: Europe Biosolids Industry Revenue (Million), by Application 2025 & 2033
- Figure 44: Europe Biosolids Industry Volume (liter ), by Application 2025 & 2033
- Figure 45: Europe Biosolids Industry Revenue Share (%), by Application 2025 & 2033
- Figure 46: Europe Biosolids Industry Volume Share (%), by Application 2025 & 2033
- Figure 47: Europe Biosolids Industry Revenue (Million), by Country 2025 & 2033
- Figure 48: Europe Biosolids Industry Volume (liter ), by Country 2025 & 2033
- Figure 49: Europe Biosolids Industry Revenue Share (%), by Country 2025 & 2033
- Figure 50: Europe Biosolids Industry Volume Share (%), by Country 2025 & 2033
- Figure 51: South America Biosolids Industry Revenue (Million), by Type 2025 & 2033
- Figure 52: South America Biosolids Industry Volume (liter ), by Type 2025 & 2033
- Figure 53: South America Biosolids Industry Revenue Share (%), by Type 2025 & 2033
- Figure 54: South America Biosolids Industry Volume Share (%), by Type 2025 & 2033
- Figure 55: South America Biosolids Industry Revenue (Million), by Form 2025 & 2033
- Figure 56: South America Biosolids Industry Volume (liter ), by Form 2025 & 2033
- Figure 57: South America Biosolids Industry Revenue Share (%), by Form 2025 & 2033
- Figure 58: South America Biosolids Industry Volume Share (%), by Form 2025 & 2033
- Figure 59: South America Biosolids Industry Revenue (Million), by Application 2025 & 2033
- Figure 60: South America Biosolids Industry Volume (liter ), by Application 2025 & 2033
- Figure 61: South America Biosolids Industry Revenue Share (%), by Application 2025 & 2033
- Figure 62: South America Biosolids Industry Volume Share (%), by Application 2025 & 2033
- Figure 63: South America Biosolids Industry Revenue (Million), by Country 2025 & 2033
- Figure 64: South America Biosolids Industry Volume (liter ), by Country 2025 & 2033
- Figure 65: South America Biosolids Industry Revenue Share (%), by Country 2025 & 2033
- Figure 66: South America Biosolids Industry Volume Share (%), by Country 2025 & 2033
- Figure 67: Middle East and Africa Biosolids Industry Revenue (Million), by Type 2025 & 2033
- Figure 68: Middle East and Africa Biosolids Industry Volume (liter ), by Type 2025 & 2033
- Figure 69: Middle East and Africa Biosolids Industry Revenue Share (%), by Type 2025 & 2033
- Figure 70: Middle East and Africa Biosolids Industry Volume Share (%), by Type 2025 & 2033
- Figure 71: Middle East and Africa Biosolids Industry Revenue (Million), by Form 2025 & 2033
- Figure 72: Middle East and Africa Biosolids Industry Volume (liter ), by Form 2025 & 2033
- Figure 73: Middle East and Africa Biosolids Industry Revenue Share (%), by Form 2025 & 2033
- Figure 74: Middle East and Africa Biosolids Industry Volume Share (%), by Form 2025 & 2033
- Figure 75: Middle East and Africa Biosolids Industry Revenue (Million), by Application 2025 & 2033
- Figure 76: Middle East and Africa Biosolids Industry Volume (liter ), by Application 2025 & 2033
- Figure 77: Middle East and Africa Biosolids Industry Revenue Share (%), by Application 2025 & 2033
- Figure 78: Middle East and Africa Biosolids Industry Volume Share (%), by Application 2025 & 2033
- Figure 79: Middle East and Africa Biosolids Industry Revenue (Million), by Country 2025 & 2033
- Figure 80: Middle East and Africa Biosolids Industry Volume (liter ), by Country 2025 & 2033
- Figure 81: Middle East and Africa Biosolids Industry Revenue Share (%), by Country 2025 & 2033
- Figure 82: Middle East and Africa Biosolids Industry Volume Share (%), by Country 2025 & 2033
List of Tables
- Table 1: Global Biosolids Industry Revenue Million Forecast, by Type 2020 & 2033
- Table 2: Global Biosolids Industry Volume liter Forecast, by Type 2020 & 2033
- Table 3: Global Biosolids Industry Revenue Million Forecast, by Form 2020 & 2033
- Table 4: Global Biosolids Industry Volume liter Forecast, by Form 2020 & 2033
- Table 5: Global Biosolids Industry Revenue Million Forecast, by Application 2020 & 2033
- Table 6: Global Biosolids Industry Volume liter Forecast, by Application 2020 & 2033
- Table 7: Global Biosolids Industry Revenue Million Forecast, by Region 2020 & 2033
- Table 8: Global Biosolids Industry Volume liter Forecast, by Region 2020 & 2033
- Table 9: Global Biosolids Industry Revenue Million Forecast, by Type 2020 & 2033
- Table 10: Global Biosolids Industry Volume liter Forecast, by Type 2020 & 2033
- Table 11: Global Biosolids Industry Revenue Million Forecast, by Form 2020 & 2033
- Table 12: Global Biosolids Industry Volume liter Forecast, by Form 2020 & 2033
- Table 13: Global Biosolids Industry Revenue Million Forecast, by Application 2020 & 2033
- Table 14: Global Biosolids Industry Volume liter Forecast, by Application 2020 & 2033
- Table 15: Global Biosolids Industry Revenue Million Forecast, by Country 2020 & 2033
- Table 16: Global Biosolids Industry Volume liter Forecast, by Country 2020 & 2033
- Table 17: China Biosolids Industry Revenue (Million) Forecast, by Application 2020 & 2033
- Table 18: China Biosolids Industry Volume (liter ) Forecast, by Application 2020 & 2033
- Table 19: India Biosolids Industry Revenue (Million) Forecast, by Application 2020 & 2033
- Table 20: India Biosolids Industry Volume (liter ) Forecast, by Application 2020 & 2033
- Table 21: Japan Biosolids Industry Revenue (Million) Forecast, by Application 2020 & 2033
- Table 22: Japan Biosolids Industry Volume (liter ) Forecast, by Application 2020 & 2033
- Table 23: South Korea Biosolids Industry Revenue (Million) Forecast, by Application 2020 & 2033
- Table 24: South Korea Biosolids Industry Volume (liter ) Forecast, by Application 2020 & 2033
- Table 25: Malaysia Biosolids Industry Revenue (Million) Forecast, by Application 2020 & 2033
- Table 26: Malaysia Biosolids Industry Volume (liter ) Forecast, by Application 2020 & 2033
- Table 27: Thailand Biosolids Industry Revenue (Million) Forecast, by Application 2020 & 2033
- Table 28: Thailand Biosolids Industry Volume (liter ) Forecast, by Application 2020 & 2033
- Table 29: Indonesia Biosolids Industry Revenue (Million) Forecast, by Application 2020 & 2033
- Table 30: Indonesia Biosolids Industry Volume (liter ) Forecast, by Application 2020 & 2033
- Table 31: Vietnam Biosolids Industry Revenue (Million) Forecast, by Application 2020 & 2033
- Table 32: Vietnam Biosolids Industry Volume (liter ) Forecast, by Application 2020 & 2033
- Table 33: Rest of Asia Pacific Biosolids Industry Revenue (Million) Forecast, by Application 2020 & 2033
- Table 34: Rest of Asia Pacific Biosolids Industry Volume (liter ) Forecast, by Application 2020 & 2033
- Table 35: Global Biosolids Industry Revenue Million Forecast, by Type 2020 & 2033
- Table 36: Global Biosolids Industry Volume liter Forecast, by Type 2020 & 2033
- Table 37: Global Biosolids Industry Revenue Million Forecast, by Form 2020 & 2033
- Table 38: Global Biosolids Industry Volume liter Forecast, by Form 2020 & 2033
- Table 39: Global Biosolids Industry Revenue Million Forecast, by Application 2020 & 2033
- Table 40: Global Biosolids Industry Volume liter Forecast, by Application 2020 & 2033
- Table 41: Global Biosolids Industry Revenue Million Forecast, by Country 2020 & 2033
- Table 42: Global Biosolids Industry Volume liter Forecast, by Country 2020 & 2033
- Table 43: United States Biosolids Industry Revenue (Million) Forecast, by Application 2020 & 2033
- Table 44: United States Biosolids Industry Volume (liter ) Forecast, by Application 2020 & 2033
- Table 45: Canada Biosolids Industry Revenue (Million) Forecast, by Application 2020 & 2033
- Table 46: Canada Biosolids Industry Volume (liter ) Forecast, by Application 2020 & 2033
- Table 47: Mexico Biosolids Industry Revenue (Million) Forecast, by Application 2020 & 2033
- Table 48: Mexico Biosolids Industry Volume (liter ) Forecast, by Application 2020 & 2033
- Table 49: Global Biosolids Industry Revenue Million Forecast, by Type 2020 & 2033
- Table 50: Global Biosolids Industry Volume liter Forecast, by Type 2020 & 2033
- Table 51: Global Biosolids Industry Revenue Million Forecast, by Form 2020 & 2033
- Table 52: Global Biosolids Industry Volume liter Forecast, by Form 2020 & 2033
- Table 53: Global Biosolids Industry Revenue Million Forecast, by Application 2020 & 2033
- Table 54: Global Biosolids Industry Volume liter Forecast, by Application 2020 & 2033
- Table 55: Global Biosolids Industry Revenue Million Forecast, by Country 2020 & 2033
- Table 56: Global Biosolids Industry Volume liter Forecast, by Country 2020 & 2033
- Table 57: Germany Biosolids Industry Revenue (Million) Forecast, by Application 2020 & 2033
- Table 58: Germany Biosolids Industry Volume (liter ) Forecast, by Application 2020 & 2033
- Table 59: United Kingdom Biosolids Industry Revenue (Million) Forecast, by Application 2020 & 2033
- Table 60: United Kingdom Biosolids Industry Volume (liter ) Forecast, by Application 2020 & 2033
- Table 61: Italy Biosolids Industry Revenue (Million) Forecast, by Application 2020 & 2033
- Table 62: Italy Biosolids Industry Volume (liter ) Forecast, by Application 2020 & 2033
- Table 63: France Biosolids Industry Revenue (Million) Forecast, by Application 2020 & 2033
- Table 64: France Biosolids Industry Volume (liter ) Forecast, by Application 2020 & 2033
- Table 65: Spain Biosolids Industry Revenue (Million) Forecast, by Application 2020 & 2033
- Table 66: Spain Biosolids Industry Volume (liter ) Forecast, by Application 2020 & 2033
- Table 67: NORDIC Biosolids Industry Revenue (Million) Forecast, by Application 2020 & 2033
- Table 68: NORDIC Biosolids Industry Volume (liter ) Forecast, by Application 2020 & 2033
- Table 69: Turkey Biosolids Industry Revenue (Million) Forecast, by Application 2020 & 2033
- Table 70: Turkey Biosolids Industry Volume (liter ) Forecast, by Application 2020 & 2033
- Table 71: Russia Biosolids Industry Revenue (Million) Forecast, by Application 2020 & 2033
- Table 72: Russia Biosolids Industry Volume (liter ) Forecast, by Application 2020 & 2033
- Table 73: Rest of Europe Biosolids Industry Revenue (Million) Forecast, by Application 2020 & 2033
- Table 74: Rest of Europe Biosolids Industry Volume (liter ) Forecast, by Application 2020 & 2033
- Table 75: Global Biosolids Industry Revenue Million Forecast, by Type 2020 & 2033
- Table 76: Global Biosolids Industry Volume liter Forecast, by Type 2020 & 2033
- Table 77: Global Biosolids Industry Revenue Million Forecast, by Form 2020 & 2033
- Table 78: Global Biosolids Industry Volume liter Forecast, by Form 2020 & 2033
- Table 79: Global Biosolids Industry Revenue Million Forecast, by Application 2020 & 2033
- Table 80: Global Biosolids Industry Volume liter Forecast, by Application 2020 & 2033
- Table 81: Global Biosolids Industry Revenue Million Forecast, by Country 2020 & 2033
- Table 82: Global Biosolids Industry Volume liter Forecast, by Country 2020 & 2033
- Table 83: Brazil Biosolids Industry Revenue (Million) Forecast, by Application 2020 & 2033
- Table 84: Brazil Biosolids Industry Volume (liter ) Forecast, by Application 2020 & 2033
- Table 85: Argentina Biosolids Industry Revenue (Million) Forecast, by Application 2020 & 2033
- Table 86: Argentina Biosolids Industry Volume (liter ) Forecast, by Application 2020 & 2033
- Table 87: Colombia Biosolids Industry Revenue (Million) Forecast, by Application 2020 & 2033
- Table 88: Colombia Biosolids Industry Volume (liter ) Forecast, by Application 2020 & 2033
- Table 89: Rest of South America Biosolids Industry Revenue (Million) Forecast, by Application 2020 & 2033
- Table 90: Rest of South America Biosolids Industry Volume (liter ) Forecast, by Application 2020 & 2033
- Table 91: Global Biosolids Industry Revenue Million Forecast, by Type 2020 & 2033
- Table 92: Global Biosolids Industry Volume liter Forecast, by Type 2020 & 2033
- Table 93: Global Biosolids Industry Revenue Million Forecast, by Form 2020 & 2033
- Table 94: Global Biosolids Industry Volume liter Forecast, by Form 2020 & 2033
- Table 95: Global Biosolids Industry Revenue Million Forecast, by Application 2020 & 2033
- Table 96: Global Biosolids Industry Volume liter Forecast, by Application 2020 & 2033
- Table 97: Global Biosolids Industry Revenue Million Forecast, by Country 2020 & 2033
- Table 98: Global Biosolids Industry Volume liter Forecast, by Country 2020 & 2033
- Table 99: Saudi Arabia Biosolids Industry Revenue (Million) Forecast, by Application 2020 & 2033
- Table 100: Saudi Arabia Biosolids Industry Volume (liter ) Forecast, by Application 2020 & 2033
- Table 101: South Africa Biosolids Industry Revenue (Million) Forecast, by Application 2020 & 2033
- Table 102: South Africa Biosolids Industry Volume (liter ) Forecast, by Application 2020 & 2033
- Table 103: Nigeria Biosolids Industry Revenue (Million) Forecast, by Application 2020 & 2033
- Table 104: Nigeria Biosolids Industry Volume (liter ) Forecast, by Application 2020 & 2033
- Table 105: Qatar Biosolids Industry Revenue (Million) Forecast, by Application 2020 & 2033
- Table 106: Qatar Biosolids Industry Volume (liter ) Forecast, by Application 2020 & 2033
- Table 107: Egypt Biosolids Industry Revenue (Million) Forecast, by Application 2020 & 2033
- Table 108: Egypt Biosolids Industry Volume (liter ) Forecast, by Application 2020 & 2033
- Table 109: United Arab Emirates Biosolids Industry Revenue (Million) Forecast, by Application 2020 & 2033
- Table 110: United Arab Emirates Biosolids Industry Volume (liter ) Forecast, by Application 2020 & 2033
- Table 111: Rest of Middle East and Africa Biosolids Industry Revenue (Million) Forecast, by Application 2020 & 2033
- Table 112: Rest of Middle East and Africa Biosolids Industry Volume (liter ) Forecast, by Application 2020 & 2033
Frequently Asked Questions
1. What is the projected Compound Annual Growth Rate (CAGR) of the Biosolids Industry?
The projected CAGR is approximately > 3.50%.
2. Which companies are prominent players in the Biosolids Industry?
Key companies in the market include Walker Industries*List Not Exhaustive, Cambi ASA, Eco-trass, DC Water, Recyc Systems Inc, BCR Environmental, Aguas Andinas SA, Cleanaway, SYLVIS, Casella Waste Systems Inc, Englobe, Agrivert Ltd, Saur, Alan Srl, Lystek International, REMONDIS SE & Co KG, FCC Group, Synagro Technologies, C R E - Centro di Ricerche Ecologiche, Parker Ag Services LLC, Terrapure BR Ltd, Merrell Bros Inc, Allevi Srl.
3. What are the main segments of the Biosolids Industry?
The market segments include Type, Form, Application.
4. Can you provide details about the market size?
The market size is estimated to be USD 1700 Million as of 2022.
5. What are some drivers contributing to market growth?
Replacing Hazardous Chemical Fertilizers in North America; Stringent Government Emission Laws; Other Drivers.
6. What are the notable trends driving market growth?
Agricultural Land Application to Dominate the Market.
7. Are there any restraints impacting market growth?
Lack of Proper Knowledge and Awareness on Biosolids; Other Restraints.
8. Can you provide examples of recent developments in the market?
January 2023: Synagro Technologies Inc., a provider of biosolids and residual solutions, acquired Burch Hydro Inc., an Ohio-based premier provider of biosolids and lime-residuals management and land application.
9. What pricing options are available for accessing the report?
Pricing options include single-user, multi-user, and enterprise licenses priced at USD 4750, USD 5250, and USD 8750 respectively.
10. Is the market size provided in terms of value or volume?
The market size is provided in terms of value, measured in Million and volume, measured in liter .
11. Are there any specific market keywords associated with the report?
Yes, the market keyword associated with the report is "Biosolids Industry," which aids in identifying and referencing the specific market segment covered.
12. How do I determine which pricing option suits my needs best?
The pricing options vary based on user requirements and access needs. Individual users may opt for single-user licenses, while businesses requiring broader access may choose multi-user or enterprise licenses for cost-effective access to the report.
13. Are there any additional resources or data provided in the Biosolids Industry report?
While the report offers comprehensive insights, it's advisable to review the specific contents or supplementary materials provided to ascertain if additional resources or data are available.
14. How can I stay updated on further developments or reports in the Biosolids Industry?
To stay informed about further developments, trends, and reports in the Biosolids Industry, consider subscribing to industry newsletters, following relevant companies and organizations, or regularly checking reputable industry news sources and publications.
Methodology
Step 1 - Identification of Relevant Samples Size from Population Database


Step 2 - Approaches for Defining Global Market Size (Value, Volume* & Price*)

Note*: In applicable scenarios
Step 3 - Data Sources
Primary Research
- Web Analytics
- Survey Reports
- Research Institute
- Latest Research Reports
- Opinion Leaders
Secondary Research
- Annual Reports
- White Paper
- Latest Press Release
- Industry Association
- Paid Database
- Investor Presentations

Step 4 - Data Triangulation
Involves using different sources of information in order to increase the validity of a study
These sources are likely to be stakeholders in a program - participants, other researchers, program staff, other community members, and so on.
Then we put all data in single framework & apply various statistical tools to find out the dynamic on the market.
During the analysis stage, feedback from the stakeholder groups would be compared to determine areas of agreement as well as areas of divergence