

Key Insights
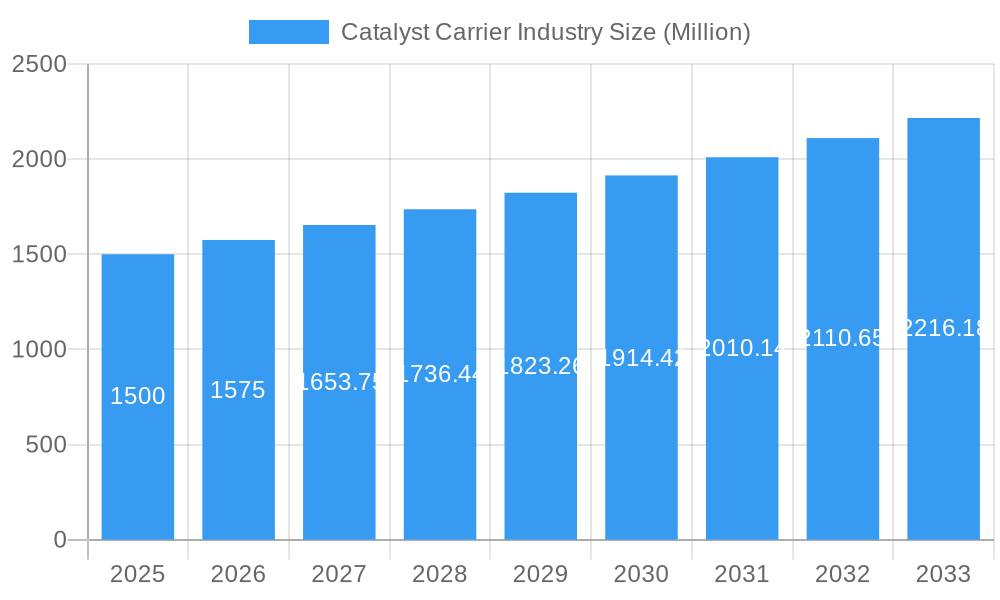
The global catalyst carrier market is experiencing robust growth, fueled by increasing demand across various industrial sectors. The market, valued at approximately $1.5 billion in 2025, is projected to maintain a Compound Annual Growth Rate (CAGR) exceeding 5% through 2033. This expansion is primarily driven by the burgeoning chemical and petrochemical industries, which rely heavily on catalysts for efficient and cost-effective production processes. Furthermore, the growing emphasis on environmental sustainability is prompting the adoption of more efficient and selective catalysts, further stimulating demand for high-performance carrier materials. Key trends shaping the market include the development of innovative carrier materials with enhanced properties like improved surface area, pore size distribution, and thermal stability. These advancements enable the creation of more effective catalysts, leading to improved process yields and reduced environmental impact. While the market faces challenges such as fluctuating raw material prices and potential supply chain disruptions, the overall outlook remains positive, driven by continuous technological advancements and increasing global industrial activity.
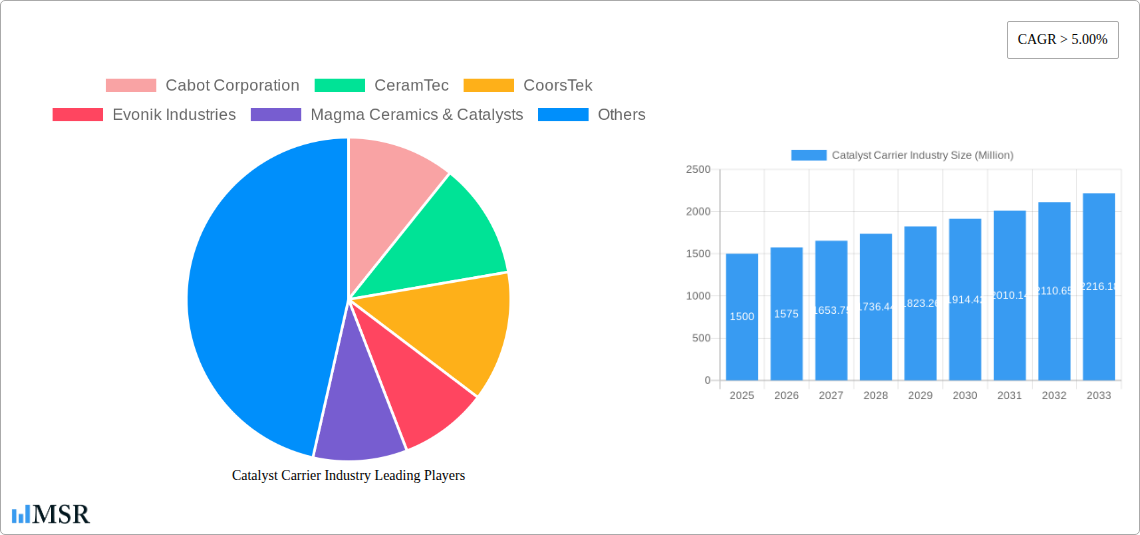
Catalyst Carrier Industry Market Size (In Billion)
The competitive landscape is characterized by a mix of large multinational corporations and specialized manufacturers. Companies like Cabot Corporation, Saint-Gobain, and Evonik Industries hold significant market shares, leveraging their established manufacturing capabilities and extensive R&D efforts. However, smaller, specialized players are also making inroads by focusing on niche applications and innovative product development. Regional variations in market growth are expected, with regions experiencing rapid industrialization and economic growth likely to show higher demand. The forecast period of 2025-2033 is poised for considerable expansion, driven by the factors mentioned above, although specific regional breakdowns would require more detailed data. Strategic partnerships, mergers, and acquisitions are anticipated to further shape the competitive dynamics within the industry.
Catalyst Carrier Industry Company Market Share
Catalyst Carrier Industry Market Report: 2019-2033
This comprehensive report provides a detailed analysis of the Catalyst Carrier Industry, offering invaluable insights for stakeholders, investors, and industry professionals. The report covers market dynamics, leading players, emerging trends, and future growth projections, leveraging data from 2019-2024 (Historical Period) with a forecast spanning 2025-2033 (Forecast Period), using 2025 as the base and estimated year. The global market size is estimated at $XX Million in 2025, showcasing a robust CAGR of XX% during the forecast period.
Catalyst Carrier Industry Market Concentration & Dynamics
The Catalyst Carrier Industry exhibits a moderately concentrated market structure, with key players such as Cabot Corporation, CeramTec, CoorsTek, Evonik Industries, Magma Ceramics & Catalysts, Noritake Co Limited, Saint-Gobain, Sasol Performance Chemicals, ALMATIS AN OYAK GROUP COMPANY, and W R Grace & Co -Conn holding significant market share. However, the presence of numerous smaller players indicates a dynamic competitive landscape.
- Market Share: The top five players collectively hold an estimated XX% market share in 2025.
- Innovation Ecosystems: Significant R&D investments drive innovation in materials science and manufacturing processes.
- Regulatory Frameworks: Stringent environmental regulations impact manufacturing and product development.
- Substitute Products: Limited readily available substitutes exist, creating a relatively stable market.
- End-User Trends: Growing demand from the chemical and petrochemical industries fuels market expansion.
- M&A Activities: Over the period 2019-2024, approximately XX M&A deals were recorded in the Catalyst Carrier Industry, signifying consolidation trends.
Catalyst Carrier Industry Insights & Trends
The Catalyst Carrier Industry is experiencing robust growth, driven by increasing demand from various sectors, including petroleum refining, chemical production, and environmental remediation. Technological advancements in material science and manufacturing processes are enhancing product performance and efficiency. The market size is projected to reach $XX Million by 2033, driven by factors such as expanding industrial capacity, stringent emission regulations, and the growing adoption of advanced catalysts in various applications. This growth is further fueled by evolving consumer preferences towards sustainable and efficient industrial processes. The overall market growth trajectory showcases significant potential, promising significant returns for investors and market participants.
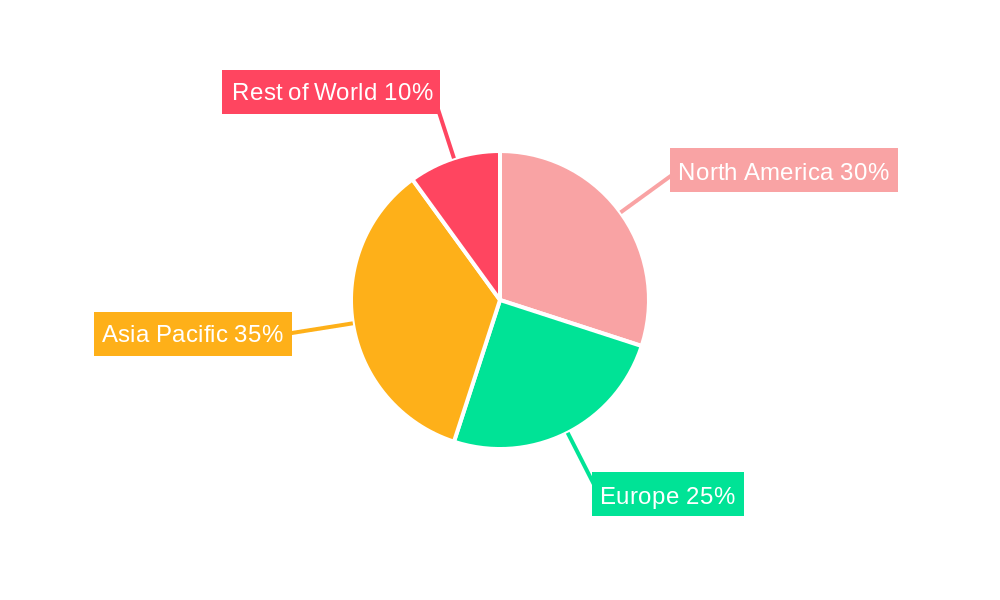
Key Markets & Segments Leading Catalyst Carrier Industry
The Asia-Pacific region holds the dominant position in the Catalyst Carrier Industry, accounting for approximately XX% of the global market in 2025. This dominance is attributed to the region's substantial industrial growth, rapid urbanization, and increasing investments in manufacturing infrastructure.
- Growth Drivers in Asia-Pacific:
- Rapid industrialization and economic expansion.
- Significant investments in infrastructure development.
- Growing demand for chemicals and petrochemicals.
- Favorable government policies supporting industrial growth.
The dominance of the Asia-Pacific region is primarily fueled by robust economic growth, extensive industrial capacity, and government initiatives promoting the development of environmentally friendly technologies. The region is also a major hub for the production and consumption of various chemicals and petrochemicals, driving high demand for catalyst carriers.
Catalyst Carrier Industry Product Developments
Recent product innovations focus on enhancing catalytic activity, improving durability, and reducing environmental impact. Advancements in material science are leading to the development of high-performance catalyst carriers with tailored properties. These innovations provide manufacturers with a competitive edge, enabling them to cater to the specific needs of various industrial applications. The development of more sustainable and efficient catalyst carriers is also a key focus, driven by stringent environmental regulations and increasing consumer demand for greener solutions.
Challenges in the Catalyst Carrier Industry Market
The Catalyst Carrier Industry faces several challenges, including fluctuations in raw material prices, stringent regulatory compliance requirements, and intense competition among established players. These factors can impact profitability and limit market growth, potentially creating uncertainty for businesses operating in this sector. Supply chain disruptions and geopolitical instability are also contributing to the challenges faced by the industry. For instance, a XX% increase in raw material costs in 2024 led to a projected XX% decrease in profit margins for some major players.
Forces Driving Catalyst Carrier Industry Growth
Key growth drivers include increasing demand from downstream industries, technological advancements resulting in enhanced product performance, and supportive government policies promoting environmental sustainability. The rising adoption of advanced catalysts across various applications, such as petroleum refining and chemical production, significantly fuels market growth. These catalysts require high-performance carriers, creating a surge in demand for this critical component of the catalytic process.
Long-Term Growth Catalysts in Catalyst Carrier Industry
Long-term growth will be fueled by continuous innovation in material science, leading to the development of advanced catalyst carriers with superior properties. Strategic partnerships and collaborations between manufacturers and end-users are also expected to drive market expansion. Furthermore, the exploration of new markets and applications for catalyst carriers will contribute to sustained long-term growth.
Emerging Opportunities in Catalyst Carrier Industry
Emerging opportunities include the development of specialized catalyst carriers for emerging applications in renewable energy, green chemistry, and environmental remediation. The expansion into new geographic markets and the utilization of advanced manufacturing technologies also offer significant growth potential. Growing focus on sustainability will also unlock opportunities for eco-friendly catalyst carrier solutions.
Leading Players in the Catalyst Carrier Industry Sector
- Cabot Corporation
- CeramTec
- CoorsTek
- Evonik Industries
- Magma Ceramics & Catalysts
- Noritake Co Limited
- Saint-Gobain
- Sasol Performance Chemicals
- ALMATIS AN OYAK GROUP COMPANY
- W R Grace & Co -Conn
Key Milestones in Catalyst Carrier Industry Industry
- 2020: Introduction of a new generation of high-performance alumina catalyst carriers by Cabot Corporation.
- 2022: Merger between two leading catalyst carrier manufacturers resulting in increased market share.
- 2023: Launch of a novel catalyst carrier material with enhanced thermal stability by CoorsTek.
- 2024: Significant investments in R&D by Evonik Industries focusing on sustainable catalyst carrier development.
Strategic Outlook for Catalyst Carrier Industry Market
The Catalyst Carrier Industry is poised for continued growth, driven by technological advancements, expanding applications, and a focus on sustainable solutions. Strategic partnerships, R&D investments, and expansion into new markets will be crucial for success in this dynamic industry. The long-term outlook remains positive, presenting significant opportunities for established players and new entrants alike.
Catalyst Carrier Industry Segmentation
-
1. Product Type
- 1.1. Ceramics
- 1.2. Activated Carbon
- 1.3. Zeolites
- 1.4. Other Product Types
-
2. Material Type
- 2.1. Alumina
- 2.2. Titania
- 2.3. Zirconia
- 2.4. Silica
- 2.5. Other Material Types
-
3. Shape
- 3.1. Sphere
- 3.2. Ring
- 3.3. Honeycomb
- 3.4. Other Shapes
-
4. End-user Industry
- 4.1. Oil and Gas
- 4.2. Chemical Manufacturing
- 4.3. Automotive
- 4.4. Pharmaceuticals
- 4.5. Other End-user Industries
Catalyst Carrier Industry Segmentation By Geography
-
1. Asia Pacific
- 1.1. China
- 1.2. India
- 1.3. Japan
- 1.4. South Korea
- 1.5. Rest of Asia Pacific
-
2. North America
- 2.1. United States
- 2.2. Canada
- 2.3. Mexico
-
3. Europe
- 3.1. Germany
- 3.2. United Kingdom
- 3.3. France
- 3.4. Italy
- 3.5. Rest of Europe
-
4. South America
- 4.1. Brazil
- 4.2. Argentina
- 4.3. Rest of South America
-
5. Middle East and Africa
- 5.1. Saudi Arabia
- 5.2. South Africa
- 5.3. Rest of Middle East and Africa
Catalyst Carrier Industry Regional Market Share
Geographic Coverage of Catalyst Carrier Industry
Catalyst Carrier Industry REPORT HIGHLIGHTS
| Aspects | Details |
|---|---|
| Study Period | 2020-2034 |
| Base Year | 2025 |
| Estimated Year | 2026 |
| Forecast Period | 2026-2034 |
| Historical Period | 2020-2025 |
| Growth Rate | CAGR of 4.8% from 2020-2034 |
| Segmentation |
|
Table of Contents
- 1. Introduction
- 1.1. Research Scope
- 1.2. Market Segmentation
- 1.3. Research Objective
- 1.4. Definitions and Assumptions
- 2. Executive Summary
- 2.1. Market Snapshot
- 3. Market Dynamics
- 3.1. Market Drivers
- 3.2. Market Restrains
- 3.3. Market Trends
- 3.4. Market Opportunities
- 4. Market Factor Analysis
- 4.1. Porters Five Forces
- 4.1.1. Bargaining Power of Suppliers
- 4.1.2. Bargaining Power of Buyers
- 4.1.3. Threat of New Entrants
- 4.1.4. Threat of Substitutes
- 4.1.5. Competitive Rivalry
- 4.2. PESTEL analysis
- 4.3. BCG Analysis
- 4.3.1. Stars (High Growth, High Market Share)
- 4.3.2. Cash Cows (Low Growth, High Market Share)
- 4.3.3. Question Mark (High Growth, Low Market Share)
- 4.3.4. Dogs (Low Growth, Low Market Share)
- 4.4. Ansoff Matrix Analysis
- 4.5. Supply Chain Analysis
- 4.6. Regulatory Landscape
- 4.7. Current Market Potential and Opportunity Assessment (TAM–SAM–SOM Framework)
- 4.8. MSR Analyst Note
- 4.1. Porters Five Forces
- 5. Market Analysis, Insights and Forecast 2021-2033
- 5.1. Market Analysis, Insights and Forecast - by Product Type
- 5.1.1. Ceramics
- 5.1.2. Activated Carbon
- 5.1.3. Zeolites
- 5.1.4. Other Product Types
- 5.2. Market Analysis, Insights and Forecast - by Material Type
- 5.2.1. Alumina
- 5.2.2. Titania
- 5.2.3. Zirconia
- 5.2.4. Silica
- 5.2.5. Other Material Types
- 5.3. Market Analysis, Insights and Forecast - by Shape
- 5.3.1. Sphere
- 5.3.2. Ring
- 5.3.3. Honeycomb
- 5.3.4. Other Shapes
- 5.4. Market Analysis, Insights and Forecast - by End-user Industry
- 5.4.1. Oil and Gas
- 5.4.2. Chemical Manufacturing
- 5.4.3. Automotive
- 5.4.4. Pharmaceuticals
- 5.4.5. Other End-user Industries
- 5.5. Market Analysis, Insights and Forecast - by Region
- 5.5.1. Asia Pacific
- 5.5.2. North America
- 5.5.3. Europe
- 5.5.4. South America
- 5.5.5. Middle East and Africa
- 5.1. Market Analysis, Insights and Forecast - by Product Type
- 6. Global Catalyst Carrier Industry Analysis, Insights and Forecast, 2021-2033
- 6.1. Market Analysis, Insights and Forecast - by Product Type
- 6.1.1. Ceramics
- 6.1.2. Activated Carbon
- 6.1.3. Zeolites
- 6.1.4. Other Product Types
- 6.2. Market Analysis, Insights and Forecast - by Material Type
- 6.2.1. Alumina
- 6.2.2. Titania
- 6.2.3. Zirconia
- 6.2.4. Silica
- 6.2.5. Other Material Types
- 6.3. Market Analysis, Insights and Forecast - by Shape
- 6.3.1. Sphere
- 6.3.2. Ring
- 6.3.3. Honeycomb
- 6.3.4. Other Shapes
- 6.4. Market Analysis, Insights and Forecast - by End-user Industry
- 6.4.1. Oil and Gas
- 6.4.2. Chemical Manufacturing
- 6.4.3. Automotive
- 6.4.4. Pharmaceuticals
- 6.4.5. Other End-user Industries
- 6.1. Market Analysis, Insights and Forecast - by Product Type
- 7. Asia Pacific Catalyst Carrier Industry Analysis, Insights and Forecast, 2020-2032
- 7.1. Market Analysis, Insights and Forecast - by Product Type
- 7.1.1. Ceramics
- 7.1.2. Activated Carbon
- 7.1.3. Zeolites
- 7.1.4. Other Product Types
- 7.2. Market Analysis, Insights and Forecast - by Material Type
- 7.2.1. Alumina
- 7.2.2. Titania
- 7.2.3. Zirconia
- 7.2.4. Silica
- 7.2.5. Other Material Types
- 7.3. Market Analysis, Insights and Forecast - by Shape
- 7.3.1. Sphere
- 7.3.2. Ring
- 7.3.3. Honeycomb
- 7.3.4. Other Shapes
- 7.4. Market Analysis, Insights and Forecast - by End-user Industry
- 7.4.1. Oil and Gas
- 7.4.2. Chemical Manufacturing
- 7.4.3. Automotive
- 7.4.4. Pharmaceuticals
- 7.4.5. Other End-user Industries
- 7.1. Market Analysis, Insights and Forecast - by Product Type
- 8. North America Catalyst Carrier Industry Analysis, Insights and Forecast, 2020-2032
- 8.1. Market Analysis, Insights and Forecast - by Product Type
- 8.1.1. Ceramics
- 8.1.2. Activated Carbon
- 8.1.3. Zeolites
- 8.1.4. Other Product Types
- 8.2. Market Analysis, Insights and Forecast - by Material Type
- 8.2.1. Alumina
- 8.2.2. Titania
- 8.2.3. Zirconia
- 8.2.4. Silica
- 8.2.5. Other Material Types
- 8.3. Market Analysis, Insights and Forecast - by Shape
- 8.3.1. Sphere
- 8.3.2. Ring
- 8.3.3. Honeycomb
- 8.3.4. Other Shapes
- 8.4. Market Analysis, Insights and Forecast - by End-user Industry
- 8.4.1. Oil and Gas
- 8.4.2. Chemical Manufacturing
- 8.4.3. Automotive
- 8.4.4. Pharmaceuticals
- 8.4.5. Other End-user Industries
- 8.1. Market Analysis, Insights and Forecast - by Product Type
- 9. Europe Catalyst Carrier Industry Analysis, Insights and Forecast, 2020-2032
- 9.1. Market Analysis, Insights and Forecast - by Product Type
- 9.1.1. Ceramics
- 9.1.2. Activated Carbon
- 9.1.3. Zeolites
- 9.1.4. Other Product Types
- 9.2. Market Analysis, Insights and Forecast - by Material Type
- 9.2.1. Alumina
- 9.2.2. Titania
- 9.2.3. Zirconia
- 9.2.4. Silica
- 9.2.5. Other Material Types
- 9.3. Market Analysis, Insights and Forecast - by Shape
- 9.3.1. Sphere
- 9.3.2. Ring
- 9.3.3. Honeycomb
- 9.3.4. Other Shapes
- 9.4. Market Analysis, Insights and Forecast - by End-user Industry
- 9.4.1. Oil and Gas
- 9.4.2. Chemical Manufacturing
- 9.4.3. Automotive
- 9.4.4. Pharmaceuticals
- 9.4.5. Other End-user Industries
- 9.1. Market Analysis, Insights and Forecast - by Product Type
- 10. South America Catalyst Carrier Industry Analysis, Insights and Forecast, 2020-2032
- 10.1. Market Analysis, Insights and Forecast - by Product Type
- 10.1.1. Ceramics
- 10.1.2. Activated Carbon
- 10.1.3. Zeolites
- 10.1.4. Other Product Types
- 10.2. Market Analysis, Insights and Forecast - by Material Type
- 10.2.1. Alumina
- 10.2.2. Titania
- 10.2.3. Zirconia
- 10.2.4. Silica
- 10.2.5. Other Material Types
- 10.3. Market Analysis, Insights and Forecast - by Shape
- 10.3.1. Sphere
- 10.3.2. Ring
- 10.3.3. Honeycomb
- 10.3.4. Other Shapes
- 10.4. Market Analysis, Insights and Forecast - by End-user Industry
- 10.4.1. Oil and Gas
- 10.4.2. Chemical Manufacturing
- 10.4.3. Automotive
- 10.4.4. Pharmaceuticals
- 10.4.5. Other End-user Industries
- 10.1. Market Analysis, Insights and Forecast - by Product Type
- 11. Middle East and Africa Catalyst Carrier Industry Analysis, Insights and Forecast, 2020-2032
- 11.1. Market Analysis, Insights and Forecast - by Product Type
- 11.1.1. Ceramics
- 11.1.2. Activated Carbon
- 11.1.3. Zeolites
- 11.1.4. Other Product Types
- 11.2. Market Analysis, Insights and Forecast - by Material Type
- 11.2.1. Alumina
- 11.2.2. Titania
- 11.2.3. Zirconia
- 11.2.4. Silica
- 11.2.5. Other Material Types
- 11.3. Market Analysis, Insights and Forecast - by Shape
- 11.3.1. Sphere
- 11.3.2. Ring
- 11.3.3. Honeycomb
- 11.3.4. Other Shapes
- 11.4. Market Analysis, Insights and Forecast - by End-user Industry
- 11.4.1. Oil and Gas
- 11.4.2. Chemical Manufacturing
- 11.4.3. Automotive
- 11.4.4. Pharmaceuticals
- 11.4.5. Other End-user Industries
- 11.1. Market Analysis, Insights and Forecast - by Product Type
- 12. Competitive Analysis
- 12.1. Company Profiles
- 12.1.1 Cabot Corporation
- 12.1.1.1. Company Overview
- 12.1.1.2. Products
- 12.1.1.3. Company Financials
- 12.1.1.4. SWOT Analysis
- 12.1.2 CeramTec
- 12.1.2.1. Company Overview
- 12.1.2.2. Products
- 12.1.2.3. Company Financials
- 12.1.2.4. SWOT Analysis
- 12.1.3 CoorsTek
- 12.1.3.1. Company Overview
- 12.1.3.2. Products
- 12.1.3.3. Company Financials
- 12.1.3.4. SWOT Analysis
- 12.1.4 Evonik Industries
- 12.1.4.1. Company Overview
- 12.1.4.2. Products
- 12.1.4.3. Company Financials
- 12.1.4.4. SWOT Analysis
- 12.1.5 Magma Ceramics & Catalysts
- 12.1.5.1. Company Overview
- 12.1.5.2. Products
- 12.1.5.3. Company Financials
- 12.1.5.4. SWOT Analysis
- 12.1.6 Noritake Co Limited
- 12.1.6.1. Company Overview
- 12.1.6.2. Products
- 12.1.6.3. Company Financials
- 12.1.6.4. SWOT Analysis
- 12.1.7 Saint-Gobain
- 12.1.7.1. Company Overview
- 12.1.7.2. Products
- 12.1.7.3. Company Financials
- 12.1.7.4. SWOT Analysis
- 12.1.8 Sasol Performance Chemicals
- 12.1.8.1. Company Overview
- 12.1.8.2. Products
- 12.1.8.3. Company Financials
- 12.1.8.4. SWOT Analysis
- 12.1.9 ALMATIS AN OYAK GROUP COMPANY
- 12.1.9.1. Company Overview
- 12.1.9.2. Products
- 12.1.9.3. Company Financials
- 12.1.9.4. SWOT Analysis
- 12.1.10 W R Grace & Co -Conn *List Not Exhaustive
- 12.1.10.1. Company Overview
- 12.1.10.2. Products
- 12.1.10.3. Company Financials
- 12.1.10.4. SWOT Analysis
- 12.1.1 Cabot Corporation
- 12.2. Market Entropy
- 12.2.1 Company's Key Areas Served
- 12.2.2 Recent Developments
- 12.3. Company Market Share Analysis 2025
- 12.3.1 Top 5 Companies Market Share Analysis
- 12.3.2 Top 3 Companies Market Share Analysis
- 12.4. List of Potential Customers
- 13. Research Methodology
List of Figures
- Figure 1: Global Catalyst Carrier Industry Revenue Breakdown (million, %) by Region 2025 & 2033
- Figure 2: Asia Pacific Catalyst Carrier Industry Revenue (million), by Product Type 2025 & 2033
- Figure 3: Asia Pacific Catalyst Carrier Industry Revenue Share (%), by Product Type 2025 & 2033
- Figure 4: Asia Pacific Catalyst Carrier Industry Revenue (million), by Material Type 2025 & 2033
- Figure 5: Asia Pacific Catalyst Carrier Industry Revenue Share (%), by Material Type 2025 & 2033
- Figure 6: Asia Pacific Catalyst Carrier Industry Revenue (million), by Shape 2025 & 2033
- Figure 7: Asia Pacific Catalyst Carrier Industry Revenue Share (%), by Shape 2025 & 2033
- Figure 8: Asia Pacific Catalyst Carrier Industry Revenue (million), by End-user Industry 2025 & 2033
- Figure 9: Asia Pacific Catalyst Carrier Industry Revenue Share (%), by End-user Industry 2025 & 2033
- Figure 10: Asia Pacific Catalyst Carrier Industry Revenue (million), by Country 2025 & 2033
- Figure 11: Asia Pacific Catalyst Carrier Industry Revenue Share (%), by Country 2025 & 2033
- Figure 12: North America Catalyst Carrier Industry Revenue (million), by Product Type 2025 & 2033
- Figure 13: North America Catalyst Carrier Industry Revenue Share (%), by Product Type 2025 & 2033
- Figure 14: North America Catalyst Carrier Industry Revenue (million), by Material Type 2025 & 2033
- Figure 15: North America Catalyst Carrier Industry Revenue Share (%), by Material Type 2025 & 2033
- Figure 16: North America Catalyst Carrier Industry Revenue (million), by Shape 2025 & 2033
- Figure 17: North America Catalyst Carrier Industry Revenue Share (%), by Shape 2025 & 2033
- Figure 18: North America Catalyst Carrier Industry Revenue (million), by End-user Industry 2025 & 2033
- Figure 19: North America Catalyst Carrier Industry Revenue Share (%), by End-user Industry 2025 & 2033
- Figure 20: North America Catalyst Carrier Industry Revenue (million), by Country 2025 & 2033
- Figure 21: North America Catalyst Carrier Industry Revenue Share (%), by Country 2025 & 2033
- Figure 22: Europe Catalyst Carrier Industry Revenue (million), by Product Type 2025 & 2033
- Figure 23: Europe Catalyst Carrier Industry Revenue Share (%), by Product Type 2025 & 2033
- Figure 24: Europe Catalyst Carrier Industry Revenue (million), by Material Type 2025 & 2033
- Figure 25: Europe Catalyst Carrier Industry Revenue Share (%), by Material Type 2025 & 2033
- Figure 26: Europe Catalyst Carrier Industry Revenue (million), by Shape 2025 & 2033
- Figure 27: Europe Catalyst Carrier Industry Revenue Share (%), by Shape 2025 & 2033
- Figure 28: Europe Catalyst Carrier Industry Revenue (million), by End-user Industry 2025 & 2033
- Figure 29: Europe Catalyst Carrier Industry Revenue Share (%), by End-user Industry 2025 & 2033
- Figure 30: Europe Catalyst Carrier Industry Revenue (million), by Country 2025 & 2033
- Figure 31: Europe Catalyst Carrier Industry Revenue Share (%), by Country 2025 & 2033
- Figure 32: South America Catalyst Carrier Industry Revenue (million), by Product Type 2025 & 2033
- Figure 33: South America Catalyst Carrier Industry Revenue Share (%), by Product Type 2025 & 2033
- Figure 34: South America Catalyst Carrier Industry Revenue (million), by Material Type 2025 & 2033
- Figure 35: South America Catalyst Carrier Industry Revenue Share (%), by Material Type 2025 & 2033
- Figure 36: South America Catalyst Carrier Industry Revenue (million), by Shape 2025 & 2033
- Figure 37: South America Catalyst Carrier Industry Revenue Share (%), by Shape 2025 & 2033
- Figure 38: South America Catalyst Carrier Industry Revenue (million), by End-user Industry 2025 & 2033
- Figure 39: South America Catalyst Carrier Industry Revenue Share (%), by End-user Industry 2025 & 2033
- Figure 40: South America Catalyst Carrier Industry Revenue (million), by Country 2025 & 2033
- Figure 41: South America Catalyst Carrier Industry Revenue Share (%), by Country 2025 & 2033
- Figure 42: Middle East and Africa Catalyst Carrier Industry Revenue (million), by Product Type 2025 & 2033
- Figure 43: Middle East and Africa Catalyst Carrier Industry Revenue Share (%), by Product Type 2025 & 2033
- Figure 44: Middle East and Africa Catalyst Carrier Industry Revenue (million), by Material Type 2025 & 2033
- Figure 45: Middle East and Africa Catalyst Carrier Industry Revenue Share (%), by Material Type 2025 & 2033
- Figure 46: Middle East and Africa Catalyst Carrier Industry Revenue (million), by Shape 2025 & 2033
- Figure 47: Middle East and Africa Catalyst Carrier Industry Revenue Share (%), by Shape 2025 & 2033
- Figure 48: Middle East and Africa Catalyst Carrier Industry Revenue (million), by End-user Industry 2025 & 2033
- Figure 49: Middle East and Africa Catalyst Carrier Industry Revenue Share (%), by End-user Industry 2025 & 2033
- Figure 50: Middle East and Africa Catalyst Carrier Industry Revenue (million), by Country 2025 & 2033
- Figure 51: Middle East and Africa Catalyst Carrier Industry Revenue Share (%), by Country 2025 & 2033
List of Tables
- Table 1: Global Catalyst Carrier Industry Revenue million Forecast, by Product Type 2020 & 2033
- Table 2: Global Catalyst Carrier Industry Revenue million Forecast, by Material Type 2020 & 2033
- Table 3: Global Catalyst Carrier Industry Revenue million Forecast, by Shape 2020 & 2033
- Table 4: Global Catalyst Carrier Industry Revenue million Forecast, by End-user Industry 2020 & 2033
- Table 5: Global Catalyst Carrier Industry Revenue million Forecast, by Region 2020 & 2033
- Table 6: Global Catalyst Carrier Industry Revenue million Forecast, by Product Type 2020 & 2033
- Table 7: Global Catalyst Carrier Industry Revenue million Forecast, by Material Type 2020 & 2033
- Table 8: Global Catalyst Carrier Industry Revenue million Forecast, by Shape 2020 & 2033
- Table 9: Global Catalyst Carrier Industry Revenue million Forecast, by End-user Industry 2020 & 2033
- Table 10: Global Catalyst Carrier Industry Revenue million Forecast, by Country 2020 & 2033
- Table 11: China Catalyst Carrier Industry Revenue (million) Forecast, by Application 2020 & 2033
- Table 12: India Catalyst Carrier Industry Revenue (million) Forecast, by Application 2020 & 2033
- Table 13: Japan Catalyst Carrier Industry Revenue (million) Forecast, by Application 2020 & 2033
- Table 14: South Korea Catalyst Carrier Industry Revenue (million) Forecast, by Application 2020 & 2033
- Table 15: Rest of Asia Pacific Catalyst Carrier Industry Revenue (million) Forecast, by Application 2020 & 2033
- Table 16: Global Catalyst Carrier Industry Revenue million Forecast, by Product Type 2020 & 2033
- Table 17: Global Catalyst Carrier Industry Revenue million Forecast, by Material Type 2020 & 2033
- Table 18: Global Catalyst Carrier Industry Revenue million Forecast, by Shape 2020 & 2033
- Table 19: Global Catalyst Carrier Industry Revenue million Forecast, by End-user Industry 2020 & 2033
- Table 20: Global Catalyst Carrier Industry Revenue million Forecast, by Country 2020 & 2033
- Table 21: United States Catalyst Carrier Industry Revenue (million) Forecast, by Application 2020 & 2033
- Table 22: Canada Catalyst Carrier Industry Revenue (million) Forecast, by Application 2020 & 2033
- Table 23: Mexico Catalyst Carrier Industry Revenue (million) Forecast, by Application 2020 & 2033
- Table 24: Global Catalyst Carrier Industry Revenue million Forecast, by Product Type 2020 & 2033
- Table 25: Global Catalyst Carrier Industry Revenue million Forecast, by Material Type 2020 & 2033
- Table 26: Global Catalyst Carrier Industry Revenue million Forecast, by Shape 2020 & 2033
- Table 27: Global Catalyst Carrier Industry Revenue million Forecast, by End-user Industry 2020 & 2033
- Table 28: Global Catalyst Carrier Industry Revenue million Forecast, by Country 2020 & 2033
- Table 29: Germany Catalyst Carrier Industry Revenue (million) Forecast, by Application 2020 & 2033
- Table 30: United Kingdom Catalyst Carrier Industry Revenue (million) Forecast, by Application 2020 & 2033
- Table 31: France Catalyst Carrier Industry Revenue (million) Forecast, by Application 2020 & 2033
- Table 32: Italy Catalyst Carrier Industry Revenue (million) Forecast, by Application 2020 & 2033
- Table 33: Rest of Europe Catalyst Carrier Industry Revenue (million) Forecast, by Application 2020 & 2033
- Table 34: Global Catalyst Carrier Industry Revenue million Forecast, by Product Type 2020 & 2033
- Table 35: Global Catalyst Carrier Industry Revenue million Forecast, by Material Type 2020 & 2033
- Table 36: Global Catalyst Carrier Industry Revenue million Forecast, by Shape 2020 & 2033
- Table 37: Global Catalyst Carrier Industry Revenue million Forecast, by End-user Industry 2020 & 2033
- Table 38: Global Catalyst Carrier Industry Revenue million Forecast, by Country 2020 & 2033
- Table 39: Brazil Catalyst Carrier Industry Revenue (million) Forecast, by Application 2020 & 2033
- Table 40: Argentina Catalyst Carrier Industry Revenue (million) Forecast, by Application 2020 & 2033
- Table 41: Rest of South America Catalyst Carrier Industry Revenue (million) Forecast, by Application 2020 & 2033
- Table 42: Global Catalyst Carrier Industry Revenue million Forecast, by Product Type 2020 & 2033
- Table 43: Global Catalyst Carrier Industry Revenue million Forecast, by Material Type 2020 & 2033
- Table 44: Global Catalyst Carrier Industry Revenue million Forecast, by Shape 2020 & 2033
- Table 45: Global Catalyst Carrier Industry Revenue million Forecast, by End-user Industry 2020 & 2033
- Table 46: Global Catalyst Carrier Industry Revenue million Forecast, by Country 2020 & 2033
- Table 47: Saudi Arabia Catalyst Carrier Industry Revenue (million) Forecast, by Application 2020 & 2033
- Table 48: South Africa Catalyst Carrier Industry Revenue (million) Forecast, by Application 2020 & 2033
- Table 49: Rest of Middle East and Africa Catalyst Carrier Industry Revenue (million) Forecast, by Application 2020 & 2033
Frequently Asked Questions
1. What is the projected Compound Annual Growth Rate (CAGR) of the Catalyst Carrier Industry?
The projected CAGR is approximately 4.8%.
2. Which companies are prominent players in the Catalyst Carrier Industry?
Key companies in the market include Cabot Corporation, CeramTec, CoorsTek, Evonik Industries, Magma Ceramics & Catalysts, Noritake Co Limited, Saint-Gobain, Sasol Performance Chemicals, ALMATIS AN OYAK GROUP COMPANY, W R Grace & Co -Conn *List Not Exhaustive.
3. What are the main segments of the Catalyst Carrier Industry?
The market segments include Product Type, Material Type, Shape, End-user Industry.
4. Can you provide details about the market size?
The market size is estimated to be USD 51.5 million as of 2022.
5. What are some drivers contributing to market growth?
; Increasing Demand from Ceramic Catalyst; Growing Consumption of Petroleum Derivatives.
6. What are the notable trends driving market growth?
Oil and Gas Industry to Dominate the Market.
7. Are there any restraints impacting market growth?
; Increasing Demand from Ceramic Catalyst; Growing Consumption of Petroleum Derivatives.
8. Can you provide examples of recent developments in the market?
N/A
9. What pricing options are available for accessing the report?
Pricing options include single-user, multi-user, and enterprise licenses priced at USD 4750, USD 5250, and USD 8750 respectively.
10. Is the market size provided in terms of value or volume?
The market size is provided in terms of value, measured in million.
11. Are there any specific market keywords associated with the report?
Yes, the market keyword associated with the report is "Catalyst Carrier Industry," which aids in identifying and referencing the specific market segment covered.
12. How do I determine which pricing option suits my needs best?
The pricing options vary based on user requirements and access needs. Individual users may opt for single-user licenses, while businesses requiring broader access may choose multi-user or enterprise licenses for cost-effective access to the report.
13. Are there any additional resources or data provided in the Catalyst Carrier Industry report?
While the report offers comprehensive insights, it's advisable to review the specific contents or supplementary materials provided to ascertain if additional resources or data are available.
14. How can I stay updated on further developments or reports in the Catalyst Carrier Industry?
To stay informed about further developments, trends, and reports in the Catalyst Carrier Industry, consider subscribing to industry newsletters, following relevant companies and organizations, or regularly checking reputable industry news sources and publications.
Methodology
Step 1 - Identification of Relevant Samples Size from Population Database


Step 2 - Approaches for Defining Global Market Size (Value, Volume* & Price*)

Note*: In applicable scenarios
Step 3 - Data Sources
Primary Research
- Web Analytics
- Survey Reports
- Research Institute
- Latest Research Reports
- Opinion Leaders
Secondary Research
- Annual Reports
- White Paper
- Latest Press Release
- Industry Association
- Paid Database
- Investor Presentations

Step 4 - Data Triangulation
Involves using different sources of information in order to increase the validity of a study
These sources are likely to be stakeholders in a program - participants, other researchers, program staff, other community members, and so on.
Then we put all data in single framework & apply various statistical tools to find out the dynamic on the market.
During the analysis stage, feedback from the stakeholder groups would be compared to determine areas of agreement as well as areas of divergence