

Key Insights
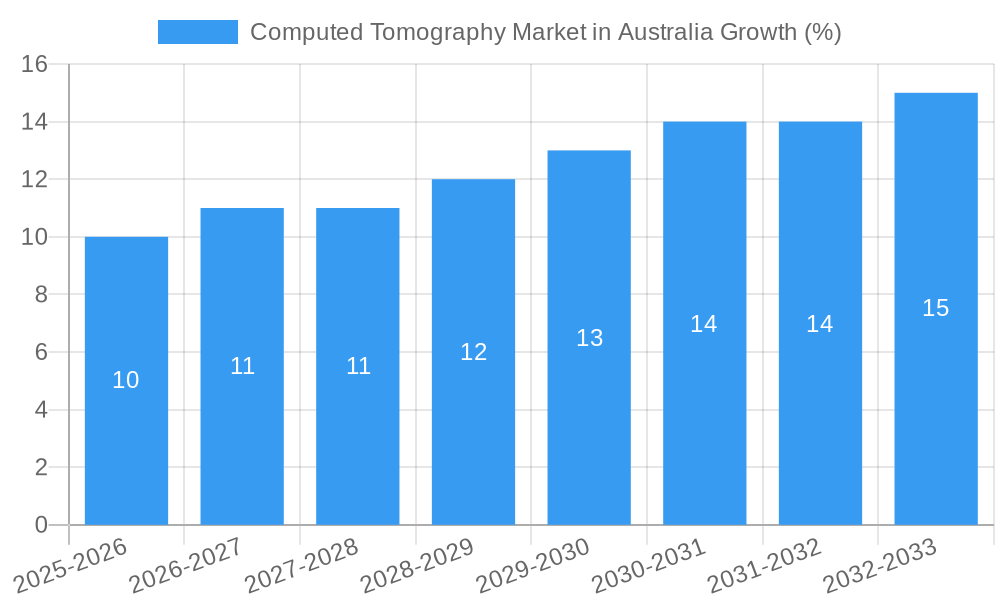
The Australian computed tomography (CT) market is experiencing robust growth, driven by factors such as an aging population leading to increased prevalence of chronic diseases requiring CT scans, technological advancements resulting in faster and more precise imaging, and rising government healthcare spending. The market's 6.40% CAGR from 2019-2033 indicates a significant expansion, projected to reach a substantial market size. This growth is fueled by increasing demand across various applications, notably oncology, neurology, and cardiovascular imaging. Hospitals and diagnostic centers remain the primary end-users, although the "other end-users" segment shows promise for future expansion, reflecting the increasing adoption of CT scans in specialized clinics and ambulatory care settings. The market segmentation by slice type (low, medium, high) suggests a preference for advanced technology, with the high-slice segment likely exhibiting the strongest growth trajectory due to improved image quality and diagnostic capabilities. While challenges such as high initial investment costs for equipment and skilled personnel may act as restraints, the overall market outlook remains positive, supported by a growing emphasis on preventative healthcare and early disease detection.
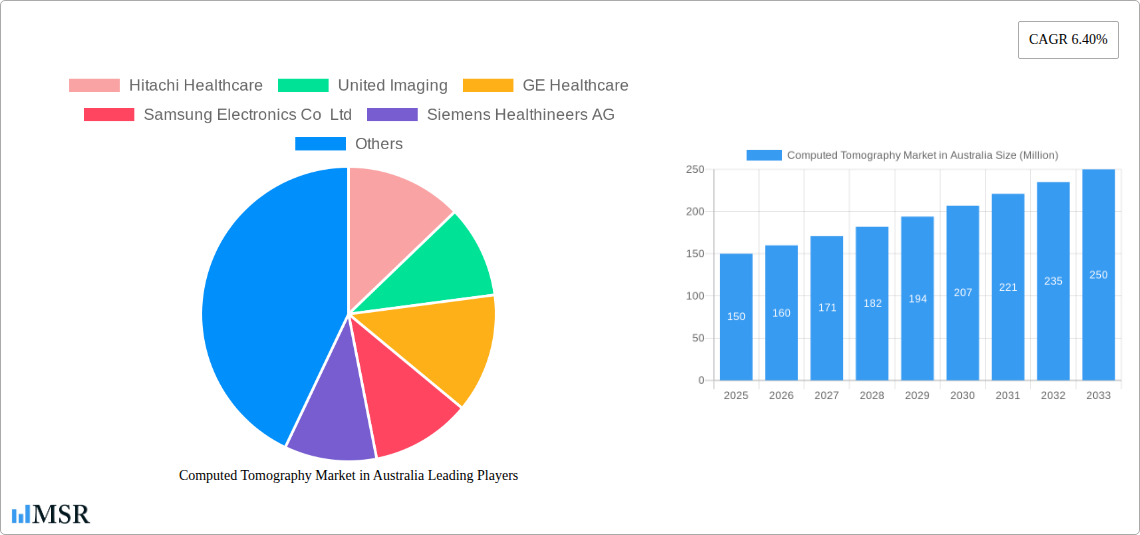
The competitive landscape is characterized by a mix of established global players like Hitachi Healthcare, GE Healthcare, and Siemens Healthineers, alongside regional and specialized providers. These companies are actively engaging in strategic partnerships, technological innovation, and expansion strategies to capitalize on market opportunities. The strong emphasis on advanced technology in the high-slice CT segment suggests a future trend toward further technological advancements, such as artificial intelligence-powered image analysis and improved radiation dose reduction techniques. Furthermore, the increasing focus on value-based healthcare and cost-effectiveness will drive competition and innovation within the market. Future growth is anticipated to be influenced by government policies supporting healthcare infrastructure development and the ongoing adoption of advanced imaging technologies within the Australian healthcare system. The increasing adoption of minimally invasive procedures requiring precise pre-operative imaging will further contribute to market expansion.
Computed Tomography (CT) Market in Australia: A Comprehensive Report (2019-2033)
This in-depth report provides a comprehensive analysis of the Computed Tomography (CT) market in Australia, covering market dynamics, industry trends, key segments, leading players, and future growth prospects. The study period spans from 2019 to 2033, with 2025 serving as the base and estimated year. The report is essential for industry stakeholders, investors, and healthcare professionals seeking actionable insights into this vital medical imaging sector.
Computed Tomography Market in Australia Market Concentration & Dynamics
The Australian CT market exhibits a moderately concentrated landscape, with several multinational corporations holding significant market share. Key players such as Hitachi Healthcare, United Imaging, GE Healthcare, Samsung Electronics Co Ltd, Siemens Healthineers AG, Carestream Health, Koninklijke Philips NV, J Morita Corporation, Neusoft Medical Systems, and Planmeca Group (Planmed OY) contribute significantly to the overall market volume. However, the market also includes several smaller, specialized providers.
Market Concentration Metrics (Estimated 2025):
- Top 5 players' combined market share: xx%
- Average market share of the top 10 players: xx%
- Number of M&A deals in the last 5 years: xx
Market Dynamics:
- Innovation Ecosystem: The Australian CT market is characterized by ongoing technological advancements, with a focus on improving image quality, reducing radiation dose, and enhancing workflow efficiency.
- Regulatory Framework: The Therapeutic Goods Administration (TGA) plays a crucial role in regulating medical devices in Australia, influencing market entry and product approvals.
- Substitute Products: While CT scans remain a dominant imaging modality, Magnetic Resonance Imaging (MRI) and Ultrasound offer alternative diagnostic options in specific applications.
- End-User Trends: Hospitals and diagnostic centers remain the primary end-users, with an increasing trend toward outsourcing imaging services to specialized diagnostic facilities.
- M&A Activities: Consolidation through mergers and acquisitions is expected to continue, driven by the need for economies of scale and expanded service offerings.
Computed Tomography Market in Australia Industry Insights & Trends
The Australian CT market is experiencing steady growth, driven by factors such as an aging population, rising prevalence of chronic diseases (e.g., cardiovascular diseases, cancer), increased healthcare spending, and technological advancements. The market size in 2025 is estimated at AUD xx Million, with a Compound Annual Growth Rate (CAGR) of xx% projected from 2025 to 2033. This growth is fueled by several key trends:
- Technological Disruptions: Advancements in CT technology, such as multi-slice CT scanners and advanced image reconstruction techniques, are significantly enhancing diagnostic capabilities. The introduction of AI-powered image analysis tools is further improving diagnostic accuracy and efficiency.
- Evolving Consumer Behaviors: Patients are increasingly demanding faster, more accurate, and less invasive diagnostic procedures, driving demand for advanced CT technology.
- Government Initiatives: Government funding for healthcare infrastructure and initiatives to improve access to diagnostic imaging services are providing a favorable regulatory environment.
Key Markets & Segments Leading Computed Tomography Market in Australia
Dominant Segments:
- By Application: Oncology remains the largest application segment, driven by the high prevalence of various cancers and the need for accurate staging and treatment monitoring. Cardiovascular applications are also significant, given the high rates of heart disease in Australia. Musculoskeletal imaging contributes substantially, particularly for trauma care and orthopedic diagnosis.
- By End User: Hospitals account for the largest share of CT installations, followed by diagnostic imaging centers. The market share held by other end users is relatively smaller.
- By Type: High-slice CT scanners dominate the market, owing to their superior image quality and faster scan times. Medium-slice CT scanners hold a substantial share and offer a good balance between performance and cost. Low-slice CT scanners are less prevalent but may find niche applications.
Segment Drivers:
- Oncology: Rising cancer incidence rates and increased demand for precise diagnosis and treatment monitoring.
- Cardiovascular: High prevalence of cardiovascular diseases and the need for advanced imaging for diagnosis and intervention.
- Musculoskeletal: Aging population, increase in sports injuries, and rising demand for orthopedic care.
- Hospitals: Growing healthcare infrastructure investment and increasing adoption of advanced diagnostic equipment.
Computed Tomography Market in Australia Product Developments
Recent product innovations include advanced multi-slice CT scanners with improved image resolution, lower radiation dose, and faster scan speeds. Manufacturers are also integrating AI-powered image analysis tools to enhance diagnostic accuracy and streamline workflows. These technological advancements are enabling more precise diagnoses, faster turnaround times, and improved patient care, giving companies a competitive advantage in the market.
Challenges in the Computed Tomography Market in Australia Market
Key challenges include:
- High initial investment costs associated with purchasing and installing CT scanners can be a significant barrier for smaller healthcare providers.
- Regulatory hurdles and lengthy approval processes can delay the introduction of new products and technologies into the market.
- Intense competition among established players leads to price pressures and a challenging market environment.
- Supply chain disruptions can impact the availability of CT scanners and related components.
Forces Driving Computed Tomography Market in Australia Growth
Growth is driven by:
- Technological advancements: Continuous innovation in CT technology is leading to improved image quality, reduced radiation dose, and faster scan times.
- Aging population: The increasing prevalence of chronic diseases among the elderly population necessitates more advanced diagnostic tools, such as CT scans.
- Government funding: Increased investment in healthcare infrastructure and funding for advanced imaging technology are bolstering market growth.
Long-Term Growth Catalysts in the Computed Tomography Market in Australia
Long-term growth will be fueled by strategic partnerships between technology providers and healthcare institutions, leading to wider adoption and utilization of AI-powered image analysis in diagnostic settings. Expansion into underserved rural and remote areas through mobile CT units and tele-radiology services represents a significant opportunity.
Emerging Opportunities in Computed Tomography Market in Australia
Emerging opportunities include the integration of artificial intelligence (AI) and machine learning (ML) for improved diagnostic accuracy, the development of specialized CT scanners for specific applications (e.g., cardiac CT, dental CT), and the growing demand for mobile CT units to enhance access to diagnostic imaging in underserved areas.
Leading Players in the Computed Tomography Market in Australia Sector
- Hitachi Healthcare
- United Imaging
- GE Healthcare
- Samsung Electronics Co Ltd
- Siemens Healthineers AG
- Carestream Health
- Koninklijke Philips NV
- J Morita Corporation
- Neusoft Medical Systems
- Planmeca Group (Planmed OY)
Key Milestones in Computed Tomography Market in Australia Industry
- April 2022: The Australian Federal Government commits USD 17.2 Million to mobile health clinic services, including CT and X-ray imaging. This significantly improves access to diagnostic imaging.
- May 2023: The Heart of Australia mobile clinic, equipped with a Philips 128-slice Incisive CT Pro scanner, begins lung screenings for Australian minors, demonstrating the expanding role of mobile CT units.
Strategic Outlook for Computed Tomography Market in Australia Market
The Australian CT market holds significant growth potential driven by technological advancements, an aging population, and increased healthcare spending. Strategic partnerships, investments in AI-powered image analysis, and expansion into underserved regions will be key factors driving future market expansion. The focus on improving accessibility through mobile units and tele-radiology is expected to create new opportunities and enhance healthcare delivery across the country.
Computed Tomography Market in Australia Segmentation
-
1. Type
- 1.1. Low Slice
- 1.2. Medium Slice
- 1.3. High Slice
-
2. Application
- 2.1. Oncology
- 2.2. Neurology
- 2.3. Cardiovascular
- 2.4. Musculoskeletal
- 2.5. Other Applications
-
3. End User
- 3.1. Hospitals
- 3.2. Diagnostic Centers
- 3.3. Other End Users
Computed Tomography Market in Australia Segmentation By Geography
-
1. North America
- 1.1. United States
- 1.2. Canada
- 1.3. Mexico
-
2. South America
- 2.1. Brazil
- 2.2. Argentina
- 2.3. Rest of South America
-
3. Europe
- 3.1. United Kingdom
- 3.2. Germany
- 3.3. France
- 3.4. Italy
- 3.5. Spain
- 3.6. Russia
- 3.7. Benelux
- 3.8. Nordics
- 3.9. Rest of Europe
-
4. Middle East & Africa
- 4.1. Turkey
- 4.2. Israel
- 4.3. GCC
- 4.4. North Africa
- 4.5. South Africa
- 4.6. Rest of Middle East & Africa
-
5. Asia Pacific
- 5.1. China
- 5.2. India
- 5.3. Japan
- 5.4. South Korea
- 5.5. ASEAN
- 5.6. Oceania
- 5.7. Rest of Asia Pacific
Computed Tomography Market in Australia REPORT HIGHLIGHTS
| Aspects | Details |
|---|---|
| Study Period | 2019-2033 |
| Base Year | 2024 |
| Estimated Year | 2025 |
| Forecast Period | 2025-2033 |
| Historical Period | 2019-2024 |
| Growth Rate | CAGR of 6.40% from 2019-2033 |
| Segmentation |
|
Table of Contents
- 1. Introduction
- 1.1. Research Scope
- 1.2. Market Segmentation
- 1.3. Research Methodology
- 1.4. Definitions and Assumptions
- 2. Executive Summary
- 2.1. Introduction
- 3. Market Dynamics
- 3.1. Introduction
- 3.2. Market Drivers
- 3.2.1. Increasing Prevalence of Chronic Diseases and Rising Geriatric Population; Technological Advancement and Investment in Healthcare Facilities
- 3.3. Market Restrains
- 3.3.1. Lack of Proper Reimbursement and Stringent Regulatory Approval Procedures; High Cost of Equipment
- 3.4. Market Trends
- 3.4.1. Hospitals Segment is Expected to Hold a Significant Market Share Over the Forecast Period
- 4. Market Factor Analysis
- 4.1. Porters Five Forces
- 4.2. Supply/Value Chain
- 4.3. PESTEL analysis
- 4.4. Market Entropy
- 4.5. Patent/Trademark Analysis
- 5. Global Computed Tomography Market in Australia Analysis, Insights and Forecast, 2019-2031
- 5.1. Market Analysis, Insights and Forecast - by Type
- 5.1.1. Low Slice
- 5.1.2. Medium Slice
- 5.1.3. High Slice
- 5.2. Market Analysis, Insights and Forecast - by Application
- 5.2.1. Oncology
- 5.2.2. Neurology
- 5.2.3. Cardiovascular
- 5.2.4. Musculoskeletal
- 5.2.5. Other Applications
- 5.3. Market Analysis, Insights and Forecast - by End User
- 5.3.1. Hospitals
- 5.3.2. Diagnostic Centers
- 5.3.3. Other End Users
- 5.4. Market Analysis, Insights and Forecast - by Region
- 5.4.1. North America
- 5.4.2. South America
- 5.4.3. Europe
- 5.4.4. Middle East & Africa
- 5.4.5. Asia Pacific
- 5.1. Market Analysis, Insights and Forecast - by Type
- 6. North America Computed Tomography Market in Australia Analysis, Insights and Forecast, 2019-2031
- 6.1. Market Analysis, Insights and Forecast - by Type
- 6.1.1. Low Slice
- 6.1.2. Medium Slice
- 6.1.3. High Slice
- 6.2. Market Analysis, Insights and Forecast - by Application
- 6.2.1. Oncology
- 6.2.2. Neurology
- 6.2.3. Cardiovascular
- 6.2.4. Musculoskeletal
- 6.2.5. Other Applications
- 6.3. Market Analysis, Insights and Forecast - by End User
- 6.3.1. Hospitals
- 6.3.2. Diagnostic Centers
- 6.3.3. Other End Users
- 6.1. Market Analysis, Insights and Forecast - by Type
- 7. South America Computed Tomography Market in Australia Analysis, Insights and Forecast, 2019-2031
- 7.1. Market Analysis, Insights and Forecast - by Type
- 7.1.1. Low Slice
- 7.1.2. Medium Slice
- 7.1.3. High Slice
- 7.2. Market Analysis, Insights and Forecast - by Application
- 7.2.1. Oncology
- 7.2.2. Neurology
- 7.2.3. Cardiovascular
- 7.2.4. Musculoskeletal
- 7.2.5. Other Applications
- 7.3. Market Analysis, Insights and Forecast - by End User
- 7.3.1. Hospitals
- 7.3.2. Diagnostic Centers
- 7.3.3. Other End Users
- 7.1. Market Analysis, Insights and Forecast - by Type
- 8. Europe Computed Tomography Market in Australia Analysis, Insights and Forecast, 2019-2031
- 8.1. Market Analysis, Insights and Forecast - by Type
- 8.1.1. Low Slice
- 8.1.2. Medium Slice
- 8.1.3. High Slice
- 8.2. Market Analysis, Insights and Forecast - by Application
- 8.2.1. Oncology
- 8.2.2. Neurology
- 8.2.3. Cardiovascular
- 8.2.4. Musculoskeletal
- 8.2.5. Other Applications
- 8.3. Market Analysis, Insights and Forecast - by End User
- 8.3.1. Hospitals
- 8.3.2. Diagnostic Centers
- 8.3.3. Other End Users
- 8.1. Market Analysis, Insights and Forecast - by Type
- 9. Middle East & Africa Computed Tomography Market in Australia Analysis, Insights and Forecast, 2019-2031
- 9.1. Market Analysis, Insights and Forecast - by Type
- 9.1.1. Low Slice
- 9.1.2. Medium Slice
- 9.1.3. High Slice
- 9.2. Market Analysis, Insights and Forecast - by Application
- 9.2.1. Oncology
- 9.2.2. Neurology
- 9.2.3. Cardiovascular
- 9.2.4. Musculoskeletal
- 9.2.5. Other Applications
- 9.3. Market Analysis, Insights and Forecast - by End User
- 9.3.1. Hospitals
- 9.3.2. Diagnostic Centers
- 9.3.3. Other End Users
- 9.1. Market Analysis, Insights and Forecast - by Type
- 10. Asia Pacific Computed Tomography Market in Australia Analysis, Insights and Forecast, 2019-2031
- 10.1. Market Analysis, Insights and Forecast - by Type
- 10.1.1. Low Slice
- 10.1.2. Medium Slice
- 10.1.3. High Slice
- 10.2. Market Analysis, Insights and Forecast - by Application
- 10.2.1. Oncology
- 10.2.2. Neurology
- 10.2.3. Cardiovascular
- 10.2.4. Musculoskeletal
- 10.2.5. Other Applications
- 10.3. Market Analysis, Insights and Forecast - by End User
- 10.3.1. Hospitals
- 10.3.2. Diagnostic Centers
- 10.3.3. Other End Users
- 10.1. Market Analysis, Insights and Forecast - by Type
- 11. Competitive Analysis
- 11.1. Global Market Share Analysis 2024
- 11.2. Company Profiles
- 11.2.1 Hitachi Healthcare
- 11.2.1.1. Overview
- 11.2.1.2. Products
- 11.2.1.3. SWOT Analysis
- 11.2.1.4. Recent Developments
- 11.2.1.5. Financials (Based on Availability)
- 11.2.2 United Imaging
- 11.2.2.1. Overview
- 11.2.2.2. Products
- 11.2.2.3. SWOT Analysis
- 11.2.2.4. Recent Developments
- 11.2.2.5. Financials (Based on Availability)
- 11.2.3 GE Healthcare
- 11.2.3.1. Overview
- 11.2.3.2. Products
- 11.2.3.3. SWOT Analysis
- 11.2.3.4. Recent Developments
- 11.2.3.5. Financials (Based on Availability)
- 11.2.4 Samsung Electronics Co Ltd
- 11.2.4.1. Overview
- 11.2.4.2. Products
- 11.2.4.3. SWOT Analysis
- 11.2.4.4. Recent Developments
- 11.2.4.5. Financials (Based on Availability)
- 11.2.5 Siemens Healthineers AG
- 11.2.5.1. Overview
- 11.2.5.2. Products
- 11.2.5.3. SWOT Analysis
- 11.2.5.4. Recent Developments
- 11.2.5.5. Financials (Based on Availability)
- 11.2.6 Carestream Health
- 11.2.6.1. Overview
- 11.2.6.2. Products
- 11.2.6.3. SWOT Analysis
- 11.2.6.4. Recent Developments
- 11.2.6.5. Financials (Based on Availability)
- 11.2.7 Koninklijke Philips NV
- 11.2.7.1. Overview
- 11.2.7.2. Products
- 11.2.7.3. SWOT Analysis
- 11.2.7.4. Recent Developments
- 11.2.7.5. Financials (Based on Availability)
- 11.2.8 J Morita Corporation
- 11.2.8.1. Overview
- 11.2.8.2. Products
- 11.2.8.3. SWOT Analysis
- 11.2.8.4. Recent Developments
- 11.2.8.5. Financials (Based on Availability)
- 11.2.9 Neusoft Medical Systems*List Not Exhaustive
- 11.2.9.1. Overview
- 11.2.9.2. Products
- 11.2.9.3. SWOT Analysis
- 11.2.9.4. Recent Developments
- 11.2.9.5. Financials (Based on Availability)
- 11.2.10 Planmeca Group (Planmed OY)
- 11.2.10.1. Overview
- 11.2.10.2. Products
- 11.2.10.3. SWOT Analysis
- 11.2.10.4. Recent Developments
- 11.2.10.5. Financials (Based on Availability)
- 11.2.1 Hitachi Healthcare
List of Figures
- Figure 1: Global Computed Tomography Market in Australia Revenue Breakdown (Million, %) by Region 2024 & 2032
- Figure 2: Australia Computed Tomography Market in Australia Revenue (Million), by Country 2024 & 2032
- Figure 3: Australia Computed Tomography Market in Australia Revenue Share (%), by Country 2024 & 2032
- Figure 4: North America Computed Tomography Market in Australia Revenue (Million), by Type 2024 & 2032
- Figure 5: North America Computed Tomography Market in Australia Revenue Share (%), by Type 2024 & 2032
- Figure 6: North America Computed Tomography Market in Australia Revenue (Million), by Application 2024 & 2032
- Figure 7: North America Computed Tomography Market in Australia Revenue Share (%), by Application 2024 & 2032
- Figure 8: North America Computed Tomography Market in Australia Revenue (Million), by End User 2024 & 2032
- Figure 9: North America Computed Tomography Market in Australia Revenue Share (%), by End User 2024 & 2032
- Figure 10: North America Computed Tomography Market in Australia Revenue (Million), by Country 2024 & 2032
- Figure 11: North America Computed Tomography Market in Australia Revenue Share (%), by Country 2024 & 2032
- Figure 12: South America Computed Tomography Market in Australia Revenue (Million), by Type 2024 & 2032
- Figure 13: South America Computed Tomography Market in Australia Revenue Share (%), by Type 2024 & 2032
- Figure 14: South America Computed Tomography Market in Australia Revenue (Million), by Application 2024 & 2032
- Figure 15: South America Computed Tomography Market in Australia Revenue Share (%), by Application 2024 & 2032
- Figure 16: South America Computed Tomography Market in Australia Revenue (Million), by End User 2024 & 2032
- Figure 17: South America Computed Tomography Market in Australia Revenue Share (%), by End User 2024 & 2032
- Figure 18: South America Computed Tomography Market in Australia Revenue (Million), by Country 2024 & 2032
- Figure 19: South America Computed Tomography Market in Australia Revenue Share (%), by Country 2024 & 2032
- Figure 20: Europe Computed Tomography Market in Australia Revenue (Million), by Type 2024 & 2032
- Figure 21: Europe Computed Tomography Market in Australia Revenue Share (%), by Type 2024 & 2032
- Figure 22: Europe Computed Tomography Market in Australia Revenue (Million), by Application 2024 & 2032
- Figure 23: Europe Computed Tomography Market in Australia Revenue Share (%), by Application 2024 & 2032
- Figure 24: Europe Computed Tomography Market in Australia Revenue (Million), by End User 2024 & 2032
- Figure 25: Europe Computed Tomography Market in Australia Revenue Share (%), by End User 2024 & 2032
- Figure 26: Europe Computed Tomography Market in Australia Revenue (Million), by Country 2024 & 2032
- Figure 27: Europe Computed Tomography Market in Australia Revenue Share (%), by Country 2024 & 2032
- Figure 28: Middle East & Africa Computed Tomography Market in Australia Revenue (Million), by Type 2024 & 2032
- Figure 29: Middle East & Africa Computed Tomography Market in Australia Revenue Share (%), by Type 2024 & 2032
- Figure 30: Middle East & Africa Computed Tomography Market in Australia Revenue (Million), by Application 2024 & 2032
- Figure 31: Middle East & Africa Computed Tomography Market in Australia Revenue Share (%), by Application 2024 & 2032
- Figure 32: Middle East & Africa Computed Tomography Market in Australia Revenue (Million), by End User 2024 & 2032
- Figure 33: Middle East & Africa Computed Tomography Market in Australia Revenue Share (%), by End User 2024 & 2032
- Figure 34: Middle East & Africa Computed Tomography Market in Australia Revenue (Million), by Country 2024 & 2032
- Figure 35: Middle East & Africa Computed Tomography Market in Australia Revenue Share (%), by Country 2024 & 2032
- Figure 36: Asia Pacific Computed Tomography Market in Australia Revenue (Million), by Type 2024 & 2032
- Figure 37: Asia Pacific Computed Tomography Market in Australia Revenue Share (%), by Type 2024 & 2032
- Figure 38: Asia Pacific Computed Tomography Market in Australia Revenue (Million), by Application 2024 & 2032
- Figure 39: Asia Pacific Computed Tomography Market in Australia Revenue Share (%), by Application 2024 & 2032
- Figure 40: Asia Pacific Computed Tomography Market in Australia Revenue (Million), by End User 2024 & 2032
- Figure 41: Asia Pacific Computed Tomography Market in Australia Revenue Share (%), by End User 2024 & 2032
- Figure 42: Asia Pacific Computed Tomography Market in Australia Revenue (Million), by Country 2024 & 2032
- Figure 43: Asia Pacific Computed Tomography Market in Australia Revenue Share (%), by Country 2024 & 2032
List of Tables
- Table 1: Global Computed Tomography Market in Australia Revenue Million Forecast, by Region 2019 & 2032
- Table 2: Global Computed Tomography Market in Australia Revenue Million Forecast, by Type 2019 & 2032
- Table 3: Global Computed Tomography Market in Australia Revenue Million Forecast, by Application 2019 & 2032
- Table 4: Global Computed Tomography Market in Australia Revenue Million Forecast, by End User 2019 & 2032
- Table 5: Global Computed Tomography Market in Australia Revenue Million Forecast, by Region 2019 & 2032
- Table 6: Global Computed Tomography Market in Australia Revenue Million Forecast, by Country 2019 & 2032
- Table 7: Global Computed Tomography Market in Australia Revenue Million Forecast, by Type 2019 & 2032
- Table 8: Global Computed Tomography Market in Australia Revenue Million Forecast, by Application 2019 & 2032
- Table 9: Global Computed Tomography Market in Australia Revenue Million Forecast, by End User 2019 & 2032
- Table 10: Global Computed Tomography Market in Australia Revenue Million Forecast, by Country 2019 & 2032
- Table 11: United States Computed Tomography Market in Australia Revenue (Million) Forecast, by Application 2019 & 2032
- Table 12: Canada Computed Tomography Market in Australia Revenue (Million) Forecast, by Application 2019 & 2032
- Table 13: Mexico Computed Tomography Market in Australia Revenue (Million) Forecast, by Application 2019 & 2032
- Table 14: Global Computed Tomography Market in Australia Revenue Million Forecast, by Type 2019 & 2032
- Table 15: Global Computed Tomography Market in Australia Revenue Million Forecast, by Application 2019 & 2032
- Table 16: Global Computed Tomography Market in Australia Revenue Million Forecast, by End User 2019 & 2032
- Table 17: Global Computed Tomography Market in Australia Revenue Million Forecast, by Country 2019 & 2032
- Table 18: Brazil Computed Tomography Market in Australia Revenue (Million) Forecast, by Application 2019 & 2032
- Table 19: Argentina Computed Tomography Market in Australia Revenue (Million) Forecast, by Application 2019 & 2032
- Table 20: Rest of South America Computed Tomography Market in Australia Revenue (Million) Forecast, by Application 2019 & 2032
- Table 21: Global Computed Tomography Market in Australia Revenue Million Forecast, by Type 2019 & 2032
- Table 22: Global Computed Tomography Market in Australia Revenue Million Forecast, by Application 2019 & 2032
- Table 23: Global Computed Tomography Market in Australia Revenue Million Forecast, by End User 2019 & 2032
- Table 24: Global Computed Tomography Market in Australia Revenue Million Forecast, by Country 2019 & 2032
- Table 25: United Kingdom Computed Tomography Market in Australia Revenue (Million) Forecast, by Application 2019 & 2032
- Table 26: Germany Computed Tomography Market in Australia Revenue (Million) Forecast, by Application 2019 & 2032
- Table 27: France Computed Tomography Market in Australia Revenue (Million) Forecast, by Application 2019 & 2032
- Table 28: Italy Computed Tomography Market in Australia Revenue (Million) Forecast, by Application 2019 & 2032
- Table 29: Spain Computed Tomography Market in Australia Revenue (Million) Forecast, by Application 2019 & 2032
- Table 30: Russia Computed Tomography Market in Australia Revenue (Million) Forecast, by Application 2019 & 2032
- Table 31: Benelux Computed Tomography Market in Australia Revenue (Million) Forecast, by Application 2019 & 2032
- Table 32: Nordics Computed Tomography Market in Australia Revenue (Million) Forecast, by Application 2019 & 2032
- Table 33: Rest of Europe Computed Tomography Market in Australia Revenue (Million) Forecast, by Application 2019 & 2032
- Table 34: Global Computed Tomography Market in Australia Revenue Million Forecast, by Type 2019 & 2032
- Table 35: Global Computed Tomography Market in Australia Revenue Million Forecast, by Application 2019 & 2032
- Table 36: Global Computed Tomography Market in Australia Revenue Million Forecast, by End User 2019 & 2032
- Table 37: Global Computed Tomography Market in Australia Revenue Million Forecast, by Country 2019 & 2032
- Table 38: Turkey Computed Tomography Market in Australia Revenue (Million) Forecast, by Application 2019 & 2032
- Table 39: Israel Computed Tomography Market in Australia Revenue (Million) Forecast, by Application 2019 & 2032
- Table 40: GCC Computed Tomography Market in Australia Revenue (Million) Forecast, by Application 2019 & 2032
- Table 41: North Africa Computed Tomography Market in Australia Revenue (Million) Forecast, by Application 2019 & 2032
- Table 42: South Africa Computed Tomography Market in Australia Revenue (Million) Forecast, by Application 2019 & 2032
- Table 43: Rest of Middle East & Africa Computed Tomography Market in Australia Revenue (Million) Forecast, by Application 2019 & 2032
- Table 44: Global Computed Tomography Market in Australia Revenue Million Forecast, by Type 2019 & 2032
- Table 45: Global Computed Tomography Market in Australia Revenue Million Forecast, by Application 2019 & 2032
- Table 46: Global Computed Tomography Market in Australia Revenue Million Forecast, by End User 2019 & 2032
- Table 47: Global Computed Tomography Market in Australia Revenue Million Forecast, by Country 2019 & 2032
- Table 48: China Computed Tomography Market in Australia Revenue (Million) Forecast, by Application 2019 & 2032
- Table 49: India Computed Tomography Market in Australia Revenue (Million) Forecast, by Application 2019 & 2032
- Table 50: Japan Computed Tomography Market in Australia Revenue (Million) Forecast, by Application 2019 & 2032
- Table 51: South Korea Computed Tomography Market in Australia Revenue (Million) Forecast, by Application 2019 & 2032
- Table 52: ASEAN Computed Tomography Market in Australia Revenue (Million) Forecast, by Application 2019 & 2032
- Table 53: Oceania Computed Tomography Market in Australia Revenue (Million) Forecast, by Application 2019 & 2032
- Table 54: Rest of Asia Pacific Computed Tomography Market in Australia Revenue (Million) Forecast, by Application 2019 & 2032
Frequently Asked Questions
1. What is the projected Compound Annual Growth Rate (CAGR) of the Computed Tomography Market in Australia?
The projected CAGR is approximately 6.40%.
2. Which companies are prominent players in the Computed Tomography Market in Australia?
Key companies in the market include Hitachi Healthcare, United Imaging, GE Healthcare, Samsung Electronics Co Ltd, Siemens Healthineers AG, Carestream Health, Koninklijke Philips NV, J Morita Corporation, Neusoft Medical Systems*List Not Exhaustive, Planmeca Group (Planmed OY).
3. What are the main segments of the Computed Tomography Market in Australia?
The market segments include Type, Application, End User.
4. Can you provide details about the market size?
The market size is estimated to be USD XX Million as of 2022.
5. What are some drivers contributing to market growth?
Increasing Prevalence of Chronic Diseases and Rising Geriatric Population; Technological Advancement and Investment in Healthcare Facilities.
6. What are the notable trends driving market growth?
Hospitals Segment is Expected to Hold a Significant Market Share Over the Forecast Period.
7. Are there any restraints impacting market growth?
Lack of Proper Reimbursement and Stringent Regulatory Approval Procedures; High Cost of Equipment.
8. Can you provide examples of recent developments in the market?
In May 2023, the mobile radiography clinic, after four years, reached the Heart of Australia truck, which was launched in February 2022. The truck took the Philips' 128-slice Incisive CT Pro scanner to screen the lungs of Australian minors.
9. What pricing options are available for accessing the report?
Pricing options include single-user, multi-user, and enterprise licenses priced at USD 3800, USD 4500, and USD 5800 respectively.
10. Is the market size provided in terms of value or volume?
The market size is provided in terms of value, measured in Million.
11. Are there any specific market keywords associated with the report?
Yes, the market keyword associated with the report is "Computed Tomography Market in Australia," which aids in identifying and referencing the specific market segment covered.
12. How do I determine which pricing option suits my needs best?
The pricing options vary based on user requirements and access needs. Individual users may opt for single-user licenses, while businesses requiring broader access may choose multi-user or enterprise licenses for cost-effective access to the report.
13. Are there any additional resources or data provided in the Computed Tomography Market in Australia report?
While the report offers comprehensive insights, it's advisable to review the specific contents or supplementary materials provided to ascertain if additional resources or data are available.
14. How can I stay updated on further developments or reports in the Computed Tomography Market in Australia?
To stay informed about further developments, trends, and reports in the Computed Tomography Market in Australia, consider subscribing to industry newsletters, following relevant companies and organizations, or regularly checking reputable industry news sources and publications.
Methodology
Step 1 - Identification of Relevant Samples Size from Population Database


Step 2 - Approaches for Defining Global Market Size (Value, Volume* & Price*)

Note*: In applicable scenarios
Step 3 - Data Sources
Primary Research
- Web Analytics
- Survey Reports
- Research Institute
- Latest Research Reports
- Opinion Leaders
Secondary Research
- Annual Reports
- White Paper
- Latest Press Release
- Industry Association
- Paid Database
- Investor Presentations

Step 4 - Data Triangulation
Involves using different sources of information in order to increase the validity of a study
These sources are likely to be stakeholders in a program - participants, other researchers, program staff, other community members, and so on.
Then we put all data in single framework & apply various statistical tools to find out the dynamic on the market.
During the analysis stage, feedback from the stakeholder groups would be compared to determine areas of agreement as well as areas of divergence
