

Key Insights
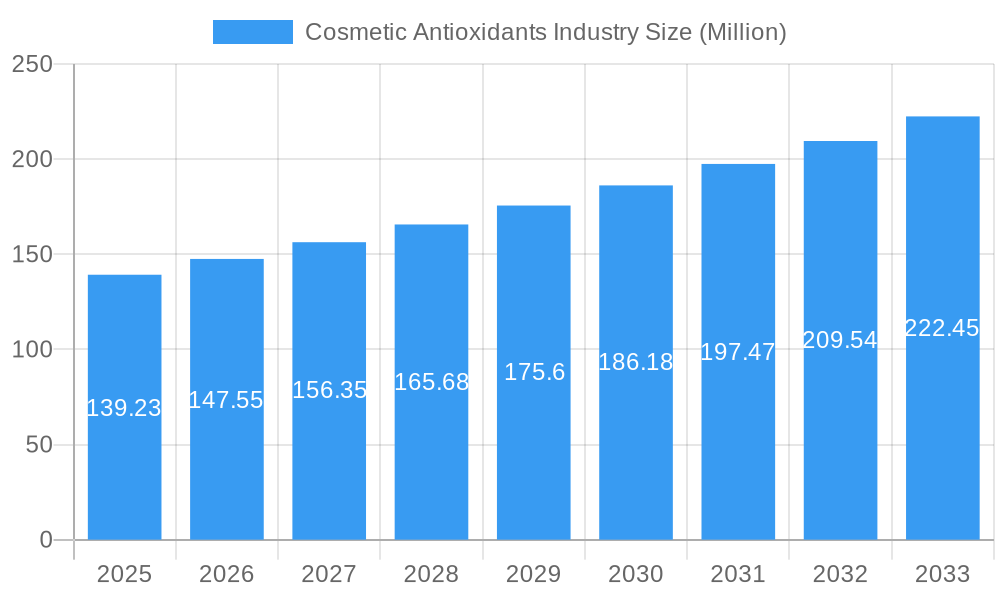
The global Cosmetic Antioxidants market is poised for significant growth, projected to reach a substantial $139.23 million by 2025, with a robust Compound Annual Growth Rate (CAGR) of 5.95% expected to continue through 2033. This upward trajectory is primarily fueled by increasing consumer awareness regarding the detrimental effects of oxidative stress on skin and hair, driving a heightened demand for protective and rejuvenating cosmetic formulations. The growing preference for natural and plant-derived ingredients, coupled with advancements in scientific research highlighting the efficacy of specific antioxidants like Vitamins, Polyphenols, and Carotenoids, are key growth drivers. Furthermore, the expanding applications of antioxidants in advanced skincare, anti-aging products, and even injectables are contributing to market expansion. The cosmetic industry's continuous innovation in developing novel antioxidant delivery systems and sophisticated formulations further propels this market forward, meeting the evolving needs of consumers seeking effective anti-aging and skin-health solutions.
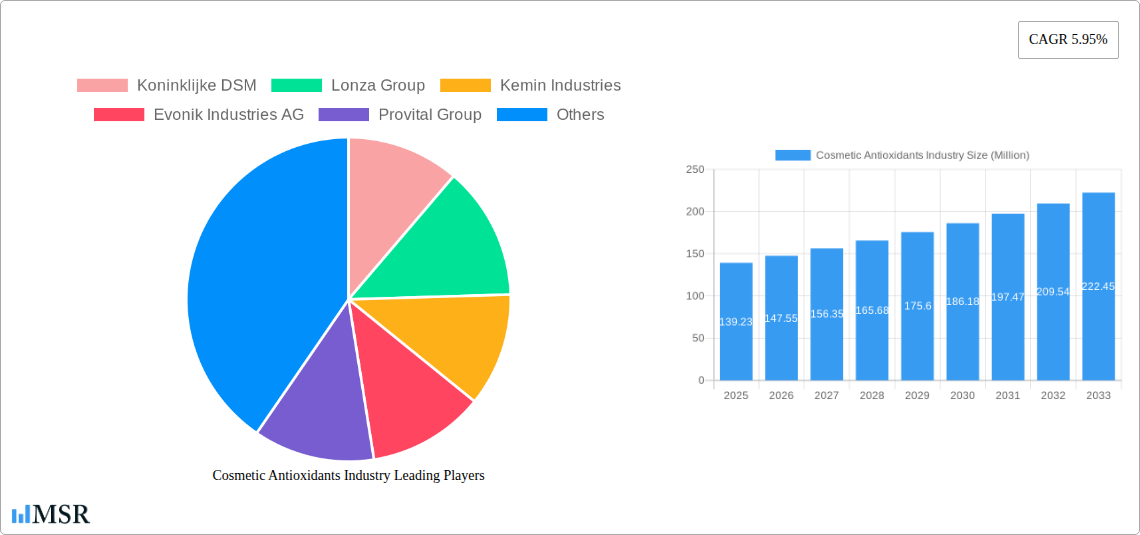
Cosmetic Antioxidants Industry Market Size (In Million)
The market is characterized by dynamic trends, including the surge in demand for clean beauty products and the integration of potent natural antioxidants. Consumers are actively seeking products free from synthetic additives, making natural sources like Vitamins (e.g., Vitamin C, Vitamin E) and Polyphenols (e.g., resveratrol, ferulic acid) particularly attractive. While chemically derived antioxidants offer stability and efficacy, the market is witnessing a significant shift towards natural alternatives due to regulatory pressures and consumer preference. Key restraints include the high cost of research and development for novel antioxidant compounds and the potential for ingredient sensitivity or allergic reactions in some individuals. However, ongoing technological advancements and a deeper understanding of biochemical pathways are enabling the development of more targeted and effective antioxidant solutions across diverse applications such as skin care, hair care, and aesthetic treatments. Major players like Koninklijke DSM, Lonza Group, and BASF SE are actively investing in R&D and strategic collaborations to capture a larger market share, underscoring the competitive landscape.
Cosmetic Antioxidants Industry Company Market Share
Cosmetic Antioxidants Market: Unleashing the Power of Protection for Radiant Beauty (2019-2033)
Unlock the burgeoning potential of the global Cosmetic Antioxidants market, a dynamic sector driven by increasing consumer demand for anti-aging and protective skincare solutions. This comprehensive report provides in-depth analysis and actionable insights for stakeholders navigating the evolving landscape of the cosmetic ingredients industry. We delve into market dynamics, technological advancements, regional dominance, and strategic opportunities, empowering you to make informed decisions.
Report Period: Study Period: 2019–2033 | Base Year: 2025 | Estimated Year: 2025 | Forecast Period: 2025–2033 | Historical Period: 2019–2024
Cosmetic Antioxidants Industry Market Concentration & Dynamics
The Cosmetic Antioxidants market, while exhibiting significant growth, is characterized by a moderately concentrated landscape. Leading players like Koninklijke DSM, Lonza Group, BASF SE, and Evonik Industries AG hold substantial market shares, driving innovation and influencing industry standards. The ecosystem thrives on continuous research and development, with a strong emphasis on harnessing both natural and chemically derived antioxidants. Regulatory frameworks, particularly concerning ingredient safety and efficacy, play a crucial role in shaping market access and product development. The emergence of effective polyphenols and advanced vitamins as potent cosmetic antioxidants intensifies competition. Substitute products, such as broad-spectrum UV filters and advanced moisturizers, present a dynamic challenge, pushing antioxidant manufacturers to highlight superior performance and scientifically proven benefits. Mergers and acquisitions (M&A) are strategic levers for growth, with an estimated XX M&A deals in the historical period, indicating consolidation and expansion efforts. End-user trends, notably the growing preference for "clean beauty" and sustainably sourced ingredients, are reshaping product formulations and market strategies.
Cosmetic Antioxidants Industry Industry Insights & Trends
The global Cosmetic Antioxidants market is experiencing robust expansion, projected to reach an estimated market size of $XXX Million by 2025, exhibiting a compelling Compound Annual Growth Rate (CAGR) of XX% during the forecast period of 2025–2033. This growth is fundamentally propelled by an escalating consumer awareness regarding the detrimental effects of environmental stressors like UV radiation, pollution, and oxidative stress on skin health and appearance. The demand for effective anti-aging solutions and preventative skincare is soaring, particularly among millennial and Gen Z demographics who are actively seeking ingredients that offer both immediate and long-term skin benefits. Technological disruptions are at the forefront, with advancements in encapsulation techniques enhancing the stability and bioavailability of vitamins and polyphenols. The development of novel extraction methods for potent natural antioxidants from botanical sources is opening new avenues for product differentiation and market appeal. Evolving consumer behaviors are a significant trend; consumers are increasingly scrutinizing ingredient lists, prioritizing transparency, efficacy, and ethical sourcing. This shift is fueling the demand for natural antioxidants derived from sources like green tea, berries, and various plant extracts. Furthermore, the growing popularity of ingestible beauty products and advanced cosmetic formulations, including injectables, is expanding the application scope for cosmetic antioxidants. The market is also witnessing a surge in research focused on the synergistic effects of combining different antioxidant types, such as carotenoids and enzymes, to create more potent and comprehensive formulations. The expanding global middle class and increasing disposable incomes in emerging economies are further contributing to the market's upward trajectory, making cosmetic antioxidants a critical component in modern beauty regimens.
Key Markets & Segments Leading Cosmetic Antioxidants Industry
The Asia Pacific region stands as a dominant force in the Cosmetic Antioxidants industry, driven by a burgeoning middle class, high disposable incomes, and an insatiable appetite for advanced skincare and anti-aging products. Countries like China, South Korea, and Japan are at the forefront, with significant market penetration and rapid adoption of new cosmetic technologies.
Dominant Segments:
- Source: Natural: The demand for natural antioxidants is outstripping that of chemically derived ones, reflecting a global trend towards clean beauty and sustainable sourcing. This segment is projected to grow at a CAGR of XX%, reaching $XXX Million by 2033.
- Type: Vitamins: Vitamins, particularly Vitamin C (Ascorbic Acid) and Vitamin E (Tocopherol), continue to be cornerstone ingredients due to their proven efficacy in neutralizing free radicals and promoting skin regeneration. Their market share is estimated at XX%.
- Application: Skin Care: The Skin Care application segment commands the largest market share, estimated at XX%, driven by the widespread use of antioxidants in anti-aging creams, serums, sunscreens, and moisturizers. The sub-segment of anti-aging products alone is expected to contribute $XXX Million by 2033.
Detailed Dominance Analysis:
- Natural Source Dominance: Consumers are increasingly prioritizing products free from harsh chemicals and artificial additives. This preference is fueling innovation in the extraction and stabilization of potent antioxidants from sources like resveratrol (grapes), astaxanthin (algae), and various fruit and vegetable extracts. The perceived safety and perceived health benefits of natural ingredients are key drivers.
- Vitamins as the Backbone: The well-established scientific backing for the efficacy of vitamins in protecting against oxidative damage and promoting collagen synthesis solidifies their leading position. Continuous research into more stable and bioavailable forms of these vitamins further enhances their market appeal.
- Skin Care's Unrivaled Reach: The pervasive nature of skincare routines across all age groups and genders makes this application the most significant consumer of cosmetic antioxidants. The multi-faceted benefits, from wrinkle reduction to hyperpigmentation control and sun damage prevention, ensure sustained demand. While Hair Care, Injectables, and Other Applications (Makeup and Body care) are growing segments, their current market share pales in comparison to the dominant Skin Care sector. However, the increasing integration of antioxidants into makeup primers, foundations, and post-workout body care products signifies a broadening market landscape for these potent ingredients.
Cosmetic Antioxidants Industry Product Developments
Product innovation in the Cosmetic Antioxidants market is relentlessly focused on enhancing efficacy, stability, and delivery systems. Advancements in nanotechnology enable the creation of micro-encapsulated antioxidants, protecting them from degradation and ensuring targeted release onto the skin. The development of novel combinations of natural and synthetic antioxidants aims to achieve synergistic effects, offering superior protection against a wider spectrum of free radicals. Furthermore, research is exploring the potential of plant-derived enzymes with potent antioxidant properties, offering a natural alternative to traditional vitamin-based formulations. The market relevance of these developments lies in their ability to meet the evolving demands of consumers seeking high-performance, scientifically backed, and often naturally derived anti-aging and protective solutions.
Challenges in the Cosmetic Antioxidants Industry Market
The Cosmetic Antioxidants market faces several significant challenges. Stringent and evolving regulatory approvals for new ingredients and claims can lead to prolonged development cycles and increased costs, estimated to add XX% to R&D expenses. Supply chain disruptions, particularly for rare or sustainably sourced natural ingredients, can impact availability and pricing, with potential lead time extensions of up to XX weeks. Intense competition from established players and new entrants, especially in the rapidly growing natural segment, exerts pressure on profit margins. Additionally, the need for extensive clinical trials to substantiate antioxidant efficacy for marketing claims can be a substantial financial burden, averaging $XXX Thousand per study.
Forces Driving Cosmetic Antioxidants Industry Growth
The Cosmetic Antioxidants industry is propelled by a confluence of powerful growth drivers. The escalating consumer awareness concerning the detrimental effects of environmental aggressors like UV radiation and pollution on skin health fuels the demand for protective ingredients. A burgeoning global middle class with increased disposable income, particularly in emerging economies, translates into higher spending on premium skincare and anti-aging products. Technological advancements in ingredient formulation, such as enhanced bioavailability and stability of antioxidants like polyphenols and carotenoids, are creating more effective and desirable products. Furthermore, the growing trend of "clean beauty" and the demand for naturally derived ingredients are pushing manufacturers to invest in sustainable sourcing and green extraction technologies, opening new market segments.
Challenges in the Cosmetic Antioxidants Industry Market
Long-term growth catalysts for the Cosmetic Antioxidants market are deeply rooted in continuous innovation and strategic market expansion. The ongoing research into novel antioxidant compounds, particularly those derived from underutilized botanical sources, holds immense potential for product differentiation and addressing unmet consumer needs. Strategic partnerships between ingredient manufacturers and cosmetic brands will be crucial for co-developing advanced formulations and ensuring market adoption. Furthermore, expanding the application of cosmetic antioxidants beyond traditional skincare into functional makeup, haircare, and even nutraceuticals presents significant growth opportunities. The increasing focus on personalized beauty solutions also opens doors for custom antioxidant formulations tailored to specific skin concerns and demographics.
Emerging Opportunities in Cosmetic Antioxidants Industry
Emerging opportunities in the Cosmetic Antioxidants industry are abundant, driven by shifting consumer preferences and technological advancements. The burgeoning demand for "preventative aging" solutions, particularly among younger demographics, presents a lucrative avenue for proactive skincare formulations incorporating potent antioxidants. The rise of the microbiome-conscious beauty trend creates opportunities for antioxidants that can protect beneficial skin bacteria while combating oxidative stress. Furthermore, the integration of antioxidants into wearable technology and smart beauty devices offers novel delivery mechanisms and personalized skincare experiences. The expansion of e-commerce and direct-to-consumer (DTC) models allows for greater market reach and engagement with niche consumer segments seeking specialized antioxidant benefits.
Leading Players in the Cosmetic Antioxidants Industry Sector
- Koninklijke DSM
- Lonza Group
- Kemin Industries
- Evonik Industries AG
- Provital Group
- Croda International Plc
- BASF SE
- Eastman Chemical Company
- BTSA Biotecnologias Aplicadas
- Wacker Chemie AG
Key Milestones in Cosmetic Antioxidants Industry Industry
- October 2023: BASF's Care Chemicals division announced a significant investment in a new plant at its Düsseldorf site to bolster the production of emollient specialties. This strategic expansion is specifically targeted to enhance the supply of key ingredients for skin and sun protection products, directly impacting the availability of antioxidants within these formulations.
- June 2023: DKSH solidified its market presence by signing an exclusive distribution agreement with Bitop, a prominent manufacturer of cosmetic ingredients. This partnership will facilitate the distribution of Bitop's innovative cosmetic antioxidant offerings across Australia, New Zealand, Malaysia, and Singapore, thereby expanding market access and introducing new product lines to these key regions.
Strategic Outlook for Cosmetic Antioxidants Industry Market
The strategic outlook for the Cosmetic Antioxidants market is exceptionally promising, driven by sustained consumer demand for effective anti-aging and protective solutions. Future growth accelerators will center on the development of highly bioavailable and stable antioxidant formulations, particularly those derived from natural sources. The increasing integration of antioxidants into advanced delivery systems, such as encapsulation technologies and personalized beauty devices, will unlock new market potential. Strategic collaborations between ingredient suppliers and cosmetic brands will be paramount in developing innovative product lines that cater to evolving consumer preferences for "clean beauty" and scientifically proven efficacy. Furthermore, expanding into emerging markets and exploring novel applications in segments like haircare and ingestible beauty will be key to capturing future market share. The industry is poised for continued innovation and expansion, offering significant opportunities for stakeholders who can adapt to these dynamic trends.
Cosmetic Antioxidants Industry Segmentation
-
1. Source
- 1.1. Natural
- 1.2. Chemically Derived
-
2. Type
- 2.1. Vitamins
- 2.2. Polyphenols
- 2.3. Enzymes
- 2.4. Carotenoids
- 2.5. Other Ty
-
3. Application
- 3.1. Skin Care
- 3.2. Hair Care
- 3.3. Injectables
- 3.4. Other Applications (Makeup and Body care)
Cosmetic Antioxidants Industry Segmentation By Geography
-
1. Asia Pacific
- 1.1. China
- 1.2. India
- 1.3. Japan
- 1.4. South Korea
- 1.5. Rest of Asia Pacific
-
2. North America
- 2.1. United States
- 2.2. Canada
- 2.3. Mexico
-
3. Europe
- 3.1. Germany
- 3.2. United Kingdom
- 3.3. Italy
- 3.4. France
- 3.5. Rest of Europe
-
4. South America
- 4.1. Brazil
- 4.2. Argentina
- 4.3. Rest of South America
-
5. Middle East and Africa
- 5.1. Saudi Arabia
- 5.2. South Africa
- 5.3. Rest of Middle East and Africa
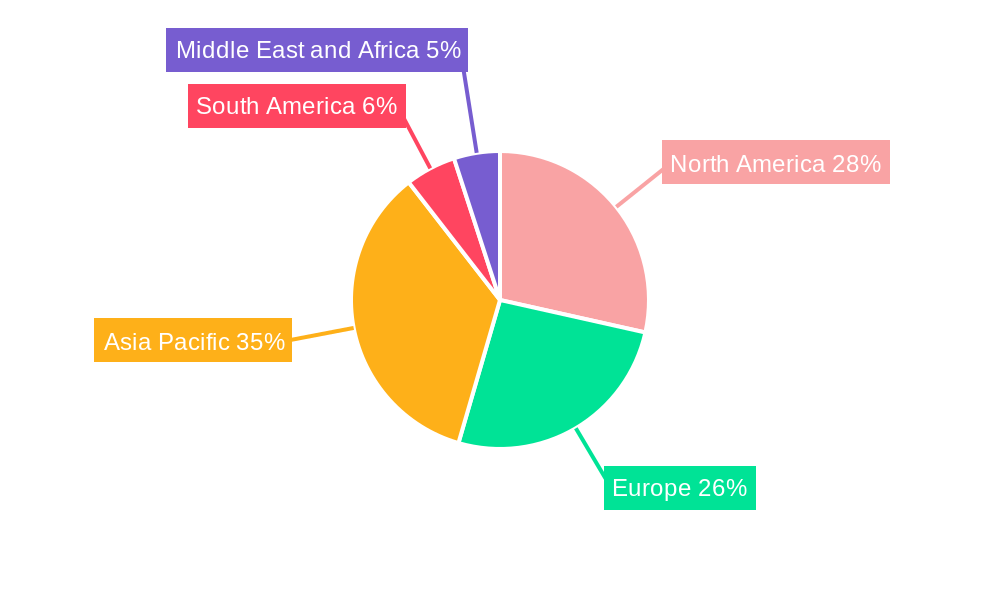
Cosmetic Antioxidants Industry Regional Market Share
Geographic Coverage of Cosmetic Antioxidants Industry
Cosmetic Antioxidants Industry REPORT HIGHLIGHTS
| Aspects | Details |
|---|---|
| Study Period | 2020-2034 |
| Base Year | 2025 |
| Estimated Year | 2026 |
| Forecast Period | 2026-2034 |
| Historical Period | 2020-2025 |
| Growth Rate | CAGR of 5.95% from 2020-2034 |
| Segmentation |
|
Table of Contents
- 1. Introduction
- 1.1. Research Scope
- 1.2. Market Segmentation
- 1.3. Research Objective
- 1.4. Definitions and Assumptions
- 2. Executive Summary
- 2.1. Market Snapshot
- 3. Market Dynamics
- 3.1. Market Drivers
- 3.2. Market Restrains
- 3.3. Market Trends
- 3.4. Market Opportunities
- 4. Market Factor Analysis
- 4.1. Porters Five Forces
- 4.1.1. Bargaining Power of Suppliers
- 4.1.2. Bargaining Power of Buyers
- 4.1.3. Threat of New Entrants
- 4.1.4. Threat of Substitutes
- 4.1.5. Competitive Rivalry
- 4.2. PESTEL analysis
- 4.3. BCG Analysis
- 4.3.1. Stars (High Growth, High Market Share)
- 4.3.2. Cash Cows (Low Growth, High Market Share)
- 4.3.3. Question Mark (High Growth, Low Market Share)
- 4.3.4. Dogs (Low Growth, Low Market Share)
- 4.4. Ansoff Matrix Analysis
- 4.5. Supply Chain Analysis
- 4.6. Regulatory Landscape
- 4.7. Current Market Potential and Opportunity Assessment (TAM–SAM–SOM Framework)
- 4.8. MSR Analyst Note
- 4.1. Porters Five Forces
- 5. Market Analysis, Insights and Forecast 2021-2033
- 5.1. Market Analysis, Insights and Forecast - by Source
- 5.1.1. Natural
- 5.1.2. Chemically Derived
- 5.2. Market Analysis, Insights and Forecast - by Type
- 5.2.1. Vitamins
- 5.2.2. Polyphenols
- 5.2.3. Enzymes
- 5.2.4. Carotenoids
- 5.2.5. Other Ty
- 5.3. Market Analysis, Insights and Forecast - by Application
- 5.3.1. Skin Care
- 5.3.2. Hair Care
- 5.3.3. Injectables
- 5.3.4. Other Applications (Makeup and Body care)
- 5.4. Market Analysis, Insights and Forecast - by Region
- 5.4.1. Asia Pacific
- 5.4.2. North America
- 5.4.3. Europe
- 5.4.4. South America
- 5.4.5. Middle East and Africa
- 5.1. Market Analysis, Insights and Forecast - by Source
- 6. Global Cosmetic Antioxidants Industry Analysis, Insights and Forecast, 2021-2033
- 6.1. Market Analysis, Insights and Forecast - by Source
- 6.1.1. Natural
- 6.1.2. Chemically Derived
- 6.2. Market Analysis, Insights and Forecast - by Type
- 6.2.1. Vitamins
- 6.2.2. Polyphenols
- 6.2.3. Enzymes
- 6.2.4. Carotenoids
- 6.2.5. Other Ty
- 6.3. Market Analysis, Insights and Forecast - by Application
- 6.3.1. Skin Care
- 6.3.2. Hair Care
- 6.3.3. Injectables
- 6.3.4. Other Applications (Makeup and Body care)
- 6.1. Market Analysis, Insights and Forecast - by Source
- 7. Asia Pacific Cosmetic Antioxidants Industry Analysis, Insights and Forecast, 2020-2032
- 7.1. Market Analysis, Insights and Forecast - by Source
- 7.1.1. Natural
- 7.1.2. Chemically Derived
- 7.2. Market Analysis, Insights and Forecast - by Type
- 7.2.1. Vitamins
- 7.2.2. Polyphenols
- 7.2.3. Enzymes
- 7.2.4. Carotenoids
- 7.2.5. Other Ty
- 7.3. Market Analysis, Insights and Forecast - by Application
- 7.3.1. Skin Care
- 7.3.2. Hair Care
- 7.3.3. Injectables
- 7.3.4. Other Applications (Makeup and Body care)
- 7.1. Market Analysis, Insights and Forecast - by Source
- 8. North America Cosmetic Antioxidants Industry Analysis, Insights and Forecast, 2020-2032
- 8.1. Market Analysis, Insights and Forecast - by Source
- 8.1.1. Natural
- 8.1.2. Chemically Derived
- 8.2. Market Analysis, Insights and Forecast - by Type
- 8.2.1. Vitamins
- 8.2.2. Polyphenols
- 8.2.3. Enzymes
- 8.2.4. Carotenoids
- 8.2.5. Other Ty
- 8.3. Market Analysis, Insights and Forecast - by Application
- 8.3.1. Skin Care
- 8.3.2. Hair Care
- 8.3.3. Injectables
- 8.3.4. Other Applications (Makeup and Body care)
- 8.1. Market Analysis, Insights and Forecast - by Source
- 9. Europe Cosmetic Antioxidants Industry Analysis, Insights and Forecast, 2020-2032
- 9.1. Market Analysis, Insights and Forecast - by Source
- 9.1.1. Natural
- 9.1.2. Chemically Derived
- 9.2. Market Analysis, Insights and Forecast - by Type
- 9.2.1. Vitamins
- 9.2.2. Polyphenols
- 9.2.3. Enzymes
- 9.2.4. Carotenoids
- 9.2.5. Other Ty
- 9.3. Market Analysis, Insights and Forecast - by Application
- 9.3.1. Skin Care
- 9.3.2. Hair Care
- 9.3.3. Injectables
- 9.3.4. Other Applications (Makeup and Body care)
- 9.1. Market Analysis, Insights and Forecast - by Source
- 10. South America Cosmetic Antioxidants Industry Analysis, Insights and Forecast, 2020-2032
- 10.1. Market Analysis, Insights and Forecast - by Source
- 10.1.1. Natural
- 10.1.2. Chemically Derived
- 10.2. Market Analysis, Insights and Forecast - by Type
- 10.2.1. Vitamins
- 10.2.2. Polyphenols
- 10.2.3. Enzymes
- 10.2.4. Carotenoids
- 10.2.5. Other Ty
- 10.3. Market Analysis, Insights and Forecast - by Application
- 10.3.1. Skin Care
- 10.3.2. Hair Care
- 10.3.3. Injectables
- 10.3.4. Other Applications (Makeup and Body care)
- 10.1. Market Analysis, Insights and Forecast - by Source
- 11. Middle East and Africa Cosmetic Antioxidants Industry Analysis, Insights and Forecast, 2020-2032
- 11.1. Market Analysis, Insights and Forecast - by Source
- 11.1.1. Natural
- 11.1.2. Chemically Derived
- 11.2. Market Analysis, Insights and Forecast - by Type
- 11.2.1. Vitamins
- 11.2.2. Polyphenols
- 11.2.3. Enzymes
- 11.2.4. Carotenoids
- 11.2.5. Other Ty
- 11.3. Market Analysis, Insights and Forecast - by Application
- 11.3.1. Skin Care
- 11.3.2. Hair Care
- 11.3.3. Injectables
- 11.3.4. Other Applications (Makeup and Body care)
- 11.1. Market Analysis, Insights and Forecast - by Source
- 12. Competitive Analysis
- 12.1. Company Profiles
- 12.1.1 Koninklijke DSM
- 12.1.1.1. Company Overview
- 12.1.1.2. Products
- 12.1.1.3. Company Financials
- 12.1.1.4. SWOT Analysis
- 12.1.2 Lonza Group
- 12.1.2.1. Company Overview
- 12.1.2.2. Products
- 12.1.2.3. Company Financials
- 12.1.2.4. SWOT Analysis
- 12.1.3 Kemin Industries
- 12.1.3.1. Company Overview
- 12.1.3.2. Products
- 12.1.3.3. Company Financials
- 12.1.3.4. SWOT Analysis
- 12.1.4 Evonik Industries AG
- 12.1.4.1. Company Overview
- 12.1.4.2. Products
- 12.1.4.3. Company Financials
- 12.1.4.4. SWOT Analysis
- 12.1.5 Provital Group
- 12.1.5.1. Company Overview
- 12.1.5.2. Products
- 12.1.5.3. Company Financials
- 12.1.5.4. SWOT Analysis
- 12.1.6 Croda International Plc
- 12.1.6.1. Company Overview
- 12.1.6.2. Products
- 12.1.6.3. Company Financials
- 12.1.6.4. SWOT Analysis
- 12.1.7 BASF SE
- 12.1.7.1. Company Overview
- 12.1.7.2. Products
- 12.1.7.3. Company Financials
- 12.1.7.4. SWOT Analysis
- 12.1.8 Eastman Chemical Company
- 12.1.8.1. Company Overview
- 12.1.8.2. Products
- 12.1.8.3. Company Financials
- 12.1.8.4. SWOT Analysis
- 12.1.9 BTSA Biotecnologias Aplicadas
- 12.1.9.1. Company Overview
- 12.1.9.2. Products
- 12.1.9.3. Company Financials
- 12.1.9.4. SWOT Analysis
- 12.1.10 Wacker Chemie AG*List Not Exhaustive
- 12.1.10.1. Company Overview
- 12.1.10.2. Products
- 12.1.10.3. Company Financials
- 12.1.10.4. SWOT Analysis
- 12.1.1 Koninklijke DSM
- 12.2. Market Entropy
- 12.2.1 Company's Key Areas Served
- 12.2.2 Recent Developments
- 12.3. Company Market Share Analysis 2025
- 12.3.1 Top 5 Companies Market Share Analysis
- 12.3.2 Top 3 Companies Market Share Analysis
- 12.4. List of Potential Customers
- 13. Research Methodology
List of Figures
- Figure 1: Global Cosmetic Antioxidants Industry Revenue Breakdown (Million, %) by Region 2025 & 2033
- Figure 2: Asia Pacific Cosmetic Antioxidants Industry Revenue (Million), by Source 2025 & 2033
- Figure 3: Asia Pacific Cosmetic Antioxidants Industry Revenue Share (%), by Source 2025 & 2033
- Figure 4: Asia Pacific Cosmetic Antioxidants Industry Revenue (Million), by Type 2025 & 2033
- Figure 5: Asia Pacific Cosmetic Antioxidants Industry Revenue Share (%), by Type 2025 & 2033
- Figure 6: Asia Pacific Cosmetic Antioxidants Industry Revenue (Million), by Application 2025 & 2033
- Figure 7: Asia Pacific Cosmetic Antioxidants Industry Revenue Share (%), by Application 2025 & 2033
- Figure 8: Asia Pacific Cosmetic Antioxidants Industry Revenue (Million), by Country 2025 & 2033
- Figure 9: Asia Pacific Cosmetic Antioxidants Industry Revenue Share (%), by Country 2025 & 2033
- Figure 10: North America Cosmetic Antioxidants Industry Revenue (Million), by Source 2025 & 2033
- Figure 11: North America Cosmetic Antioxidants Industry Revenue Share (%), by Source 2025 & 2033
- Figure 12: North America Cosmetic Antioxidants Industry Revenue (Million), by Type 2025 & 2033
- Figure 13: North America Cosmetic Antioxidants Industry Revenue Share (%), by Type 2025 & 2033
- Figure 14: North America Cosmetic Antioxidants Industry Revenue (Million), by Application 2025 & 2033
- Figure 15: North America Cosmetic Antioxidants Industry Revenue Share (%), by Application 2025 & 2033
- Figure 16: North America Cosmetic Antioxidants Industry Revenue (Million), by Country 2025 & 2033
- Figure 17: North America Cosmetic Antioxidants Industry Revenue Share (%), by Country 2025 & 2033
- Figure 18: Europe Cosmetic Antioxidants Industry Revenue (Million), by Source 2025 & 2033
- Figure 19: Europe Cosmetic Antioxidants Industry Revenue Share (%), by Source 2025 & 2033
- Figure 20: Europe Cosmetic Antioxidants Industry Revenue (Million), by Type 2025 & 2033
- Figure 21: Europe Cosmetic Antioxidants Industry Revenue Share (%), by Type 2025 & 2033
- Figure 22: Europe Cosmetic Antioxidants Industry Revenue (Million), by Application 2025 & 2033
- Figure 23: Europe Cosmetic Antioxidants Industry Revenue Share (%), by Application 2025 & 2033
- Figure 24: Europe Cosmetic Antioxidants Industry Revenue (Million), by Country 2025 & 2033
- Figure 25: Europe Cosmetic Antioxidants Industry Revenue Share (%), by Country 2025 & 2033
- Figure 26: South America Cosmetic Antioxidants Industry Revenue (Million), by Source 2025 & 2033
- Figure 27: South America Cosmetic Antioxidants Industry Revenue Share (%), by Source 2025 & 2033
- Figure 28: South America Cosmetic Antioxidants Industry Revenue (Million), by Type 2025 & 2033
- Figure 29: South America Cosmetic Antioxidants Industry Revenue Share (%), by Type 2025 & 2033
- Figure 30: South America Cosmetic Antioxidants Industry Revenue (Million), by Application 2025 & 2033
- Figure 31: South America Cosmetic Antioxidants Industry Revenue Share (%), by Application 2025 & 2033
- Figure 32: South America Cosmetic Antioxidants Industry Revenue (Million), by Country 2025 & 2033
- Figure 33: South America Cosmetic Antioxidants Industry Revenue Share (%), by Country 2025 & 2033
- Figure 34: Middle East and Africa Cosmetic Antioxidants Industry Revenue (Million), by Source 2025 & 2033
- Figure 35: Middle East and Africa Cosmetic Antioxidants Industry Revenue Share (%), by Source 2025 & 2033
- Figure 36: Middle East and Africa Cosmetic Antioxidants Industry Revenue (Million), by Type 2025 & 2033
- Figure 37: Middle East and Africa Cosmetic Antioxidants Industry Revenue Share (%), by Type 2025 & 2033
- Figure 38: Middle East and Africa Cosmetic Antioxidants Industry Revenue (Million), by Application 2025 & 2033
- Figure 39: Middle East and Africa Cosmetic Antioxidants Industry Revenue Share (%), by Application 2025 & 2033
- Figure 40: Middle East and Africa Cosmetic Antioxidants Industry Revenue (Million), by Country 2025 & 2033
- Figure 41: Middle East and Africa Cosmetic Antioxidants Industry Revenue Share (%), by Country 2025 & 2033
List of Tables
- Table 1: Global Cosmetic Antioxidants Industry Revenue Million Forecast, by Source 2020 & 2033
- Table 2: Global Cosmetic Antioxidants Industry Revenue Million Forecast, by Type 2020 & 2033
- Table 3: Global Cosmetic Antioxidants Industry Revenue Million Forecast, by Application 2020 & 2033
- Table 4: Global Cosmetic Antioxidants Industry Revenue Million Forecast, by Region 2020 & 2033
- Table 5: Global Cosmetic Antioxidants Industry Revenue Million Forecast, by Source 2020 & 2033
- Table 6: Global Cosmetic Antioxidants Industry Revenue Million Forecast, by Type 2020 & 2033
- Table 7: Global Cosmetic Antioxidants Industry Revenue Million Forecast, by Application 2020 & 2033
- Table 8: Global Cosmetic Antioxidants Industry Revenue Million Forecast, by Country 2020 & 2033
- Table 9: China Cosmetic Antioxidants Industry Revenue (Million) Forecast, by Application 2020 & 2033
- Table 10: India Cosmetic Antioxidants Industry Revenue (Million) Forecast, by Application 2020 & 2033
- Table 11: Japan Cosmetic Antioxidants Industry Revenue (Million) Forecast, by Application 2020 & 2033
- Table 12: South Korea Cosmetic Antioxidants Industry Revenue (Million) Forecast, by Application 2020 & 2033
- Table 13: Rest of Asia Pacific Cosmetic Antioxidants Industry Revenue (Million) Forecast, by Application 2020 & 2033
- Table 14: Global Cosmetic Antioxidants Industry Revenue Million Forecast, by Source 2020 & 2033
- Table 15: Global Cosmetic Antioxidants Industry Revenue Million Forecast, by Type 2020 & 2033
- Table 16: Global Cosmetic Antioxidants Industry Revenue Million Forecast, by Application 2020 & 2033
- Table 17: Global Cosmetic Antioxidants Industry Revenue Million Forecast, by Country 2020 & 2033
- Table 18: United States Cosmetic Antioxidants Industry Revenue (Million) Forecast, by Application 2020 & 2033
- Table 19: Canada Cosmetic Antioxidants Industry Revenue (Million) Forecast, by Application 2020 & 2033
- Table 20: Mexico Cosmetic Antioxidants Industry Revenue (Million) Forecast, by Application 2020 & 2033
- Table 21: Global Cosmetic Antioxidants Industry Revenue Million Forecast, by Source 2020 & 2033
- Table 22: Global Cosmetic Antioxidants Industry Revenue Million Forecast, by Type 2020 & 2033
- Table 23: Global Cosmetic Antioxidants Industry Revenue Million Forecast, by Application 2020 & 2033
- Table 24: Global Cosmetic Antioxidants Industry Revenue Million Forecast, by Country 2020 & 2033
- Table 25: Germany Cosmetic Antioxidants Industry Revenue (Million) Forecast, by Application 2020 & 2033
- Table 26: United Kingdom Cosmetic Antioxidants Industry Revenue (Million) Forecast, by Application 2020 & 2033
- Table 27: Italy Cosmetic Antioxidants Industry Revenue (Million) Forecast, by Application 2020 & 2033
- Table 28: France Cosmetic Antioxidants Industry Revenue (Million) Forecast, by Application 2020 & 2033
- Table 29: Rest of Europe Cosmetic Antioxidants Industry Revenue (Million) Forecast, by Application 2020 & 2033
- Table 30: Global Cosmetic Antioxidants Industry Revenue Million Forecast, by Source 2020 & 2033
- Table 31: Global Cosmetic Antioxidants Industry Revenue Million Forecast, by Type 2020 & 2033
- Table 32: Global Cosmetic Antioxidants Industry Revenue Million Forecast, by Application 2020 & 2033
- Table 33: Global Cosmetic Antioxidants Industry Revenue Million Forecast, by Country 2020 & 2033
- Table 34: Brazil Cosmetic Antioxidants Industry Revenue (Million) Forecast, by Application 2020 & 2033
- Table 35: Argentina Cosmetic Antioxidants Industry Revenue (Million) Forecast, by Application 2020 & 2033
- Table 36: Rest of South America Cosmetic Antioxidants Industry Revenue (Million) Forecast, by Application 2020 & 2033
- Table 37: Global Cosmetic Antioxidants Industry Revenue Million Forecast, by Source 2020 & 2033
- Table 38: Global Cosmetic Antioxidants Industry Revenue Million Forecast, by Type 2020 & 2033
- Table 39: Global Cosmetic Antioxidants Industry Revenue Million Forecast, by Application 2020 & 2033
- Table 40: Global Cosmetic Antioxidants Industry Revenue Million Forecast, by Country 2020 & 2033
- Table 41: Saudi Arabia Cosmetic Antioxidants Industry Revenue (Million) Forecast, by Application 2020 & 2033
- Table 42: South Africa Cosmetic Antioxidants Industry Revenue (Million) Forecast, by Application 2020 & 2033
- Table 43: Rest of Middle East and Africa Cosmetic Antioxidants Industry Revenue (Million) Forecast, by Application 2020 & 2033
Frequently Asked Questions
1. What is the projected Compound Annual Growth Rate (CAGR) of the Cosmetic Antioxidants Industry?
The projected CAGR is approximately 5.95%.
2. Which companies are prominent players in the Cosmetic Antioxidants Industry?
Key companies in the market include Koninklijke DSM, Lonza Group, Kemin Industries, Evonik Industries AG, Provital Group, Croda International Plc, BASF SE, Eastman Chemical Company, BTSA Biotecnologias Aplicadas, Wacker Chemie AG*List Not Exhaustive.
3. What are the main segments of the Cosmetic Antioxidants Industry?
The market segments include Source, Type, Application.
4. Can you provide details about the market size?
The market size is estimated to be USD 139.23 Million as of 2022.
5. What are some drivers contributing to market growth?
Rise in Online Purcahse of Cosmetics; Increasing Use of Beauty Products and Personal Care Products; Other Drivers.
6. What are the notable trends driving market growth?
Increasing Usage of Natural Antioxidants in Cosmetics Products.
7. Are there any restraints impacting market growth?
High Cost of Natural Antioxidants; Other Restraints.
8. Can you provide examples of recent developments in the market?
October 2023: BASF's Care Chemicals division is investing in a new plant to produce emollient specialties at its Düsseldorf site targeted for skin and sun protection products.
9. What pricing options are available for accessing the report?
Pricing options include single-user, multi-user, and enterprise licenses priced at USD 4750, USD 5250, and USD 8750 respectively.
10. Is the market size provided in terms of value or volume?
The market size is provided in terms of value, measured in Million.
11. Are there any specific market keywords associated with the report?
Yes, the market keyword associated with the report is "Cosmetic Antioxidants Industry," which aids in identifying and referencing the specific market segment covered.
12. How do I determine which pricing option suits my needs best?
The pricing options vary based on user requirements and access needs. Individual users may opt for single-user licenses, while businesses requiring broader access may choose multi-user or enterprise licenses for cost-effective access to the report.
13. Are there any additional resources or data provided in the Cosmetic Antioxidants Industry report?
While the report offers comprehensive insights, it's advisable to review the specific contents or supplementary materials provided to ascertain if additional resources or data are available.
14. How can I stay updated on further developments or reports in the Cosmetic Antioxidants Industry?
To stay informed about further developments, trends, and reports in the Cosmetic Antioxidants Industry, consider subscribing to industry newsletters, following relevant companies and organizations, or regularly checking reputable industry news sources and publications.
Methodology
Step 1 - Identification of Relevant Samples Size from Population Database


Step 2 - Approaches for Defining Global Market Size (Value, Volume* & Price*)

Note*: In applicable scenarios
Step 3 - Data Sources
Primary Research
- Web Analytics
- Survey Reports
- Research Institute
- Latest Research Reports
- Opinion Leaders
Secondary Research
- Annual Reports
- White Paper
- Latest Press Release
- Industry Association
- Paid Database
- Investor Presentations

Step 4 - Data Triangulation
Involves using different sources of information in order to increase the validity of a study
These sources are likely to be stakeholders in a program - participants, other researchers, program staff, other community members, and so on.
Then we put all data in single framework & apply various statistical tools to find out the dynamic on the market.
During the analysis stage, feedback from the stakeholder groups would be compared to determine areas of agreement as well as areas of divergence