

Key Insights
The global Data Center Silicon Photonic Module market is poised for significant expansion, driven by the insatiable demand for higher bandwidth and faster data processing within data centers. With an estimated market size of $5 billion in 2025, the sector is projected to experience robust growth, fueled by a compelling compound annual growth rate (CAGR) of 25%. This accelerated trajectory is primarily propelled by the relentless evolution of cloud computing, the burgeoning adoption of Artificial Intelligence (AI) and Machine Learning (ML) workloads, and the exponential increase in data traffic generated by video streaming, social media, and the Internet of Things (IoT). Leading technology giants are heavily investing in research and development to enhance the performance, cost-effectiveness, and integration capabilities of silicon photonic modules, which offer substantial advantages over traditional copper-based interconnects, including lower power consumption, reduced latency, and superior signal integrity over longer distances. The increasing deployment of 400G and the emerging 800G/1.6T technologies in hyperscale and enterprise data centers further underscores the critical role silicon photonics plays in meeting future network demands.
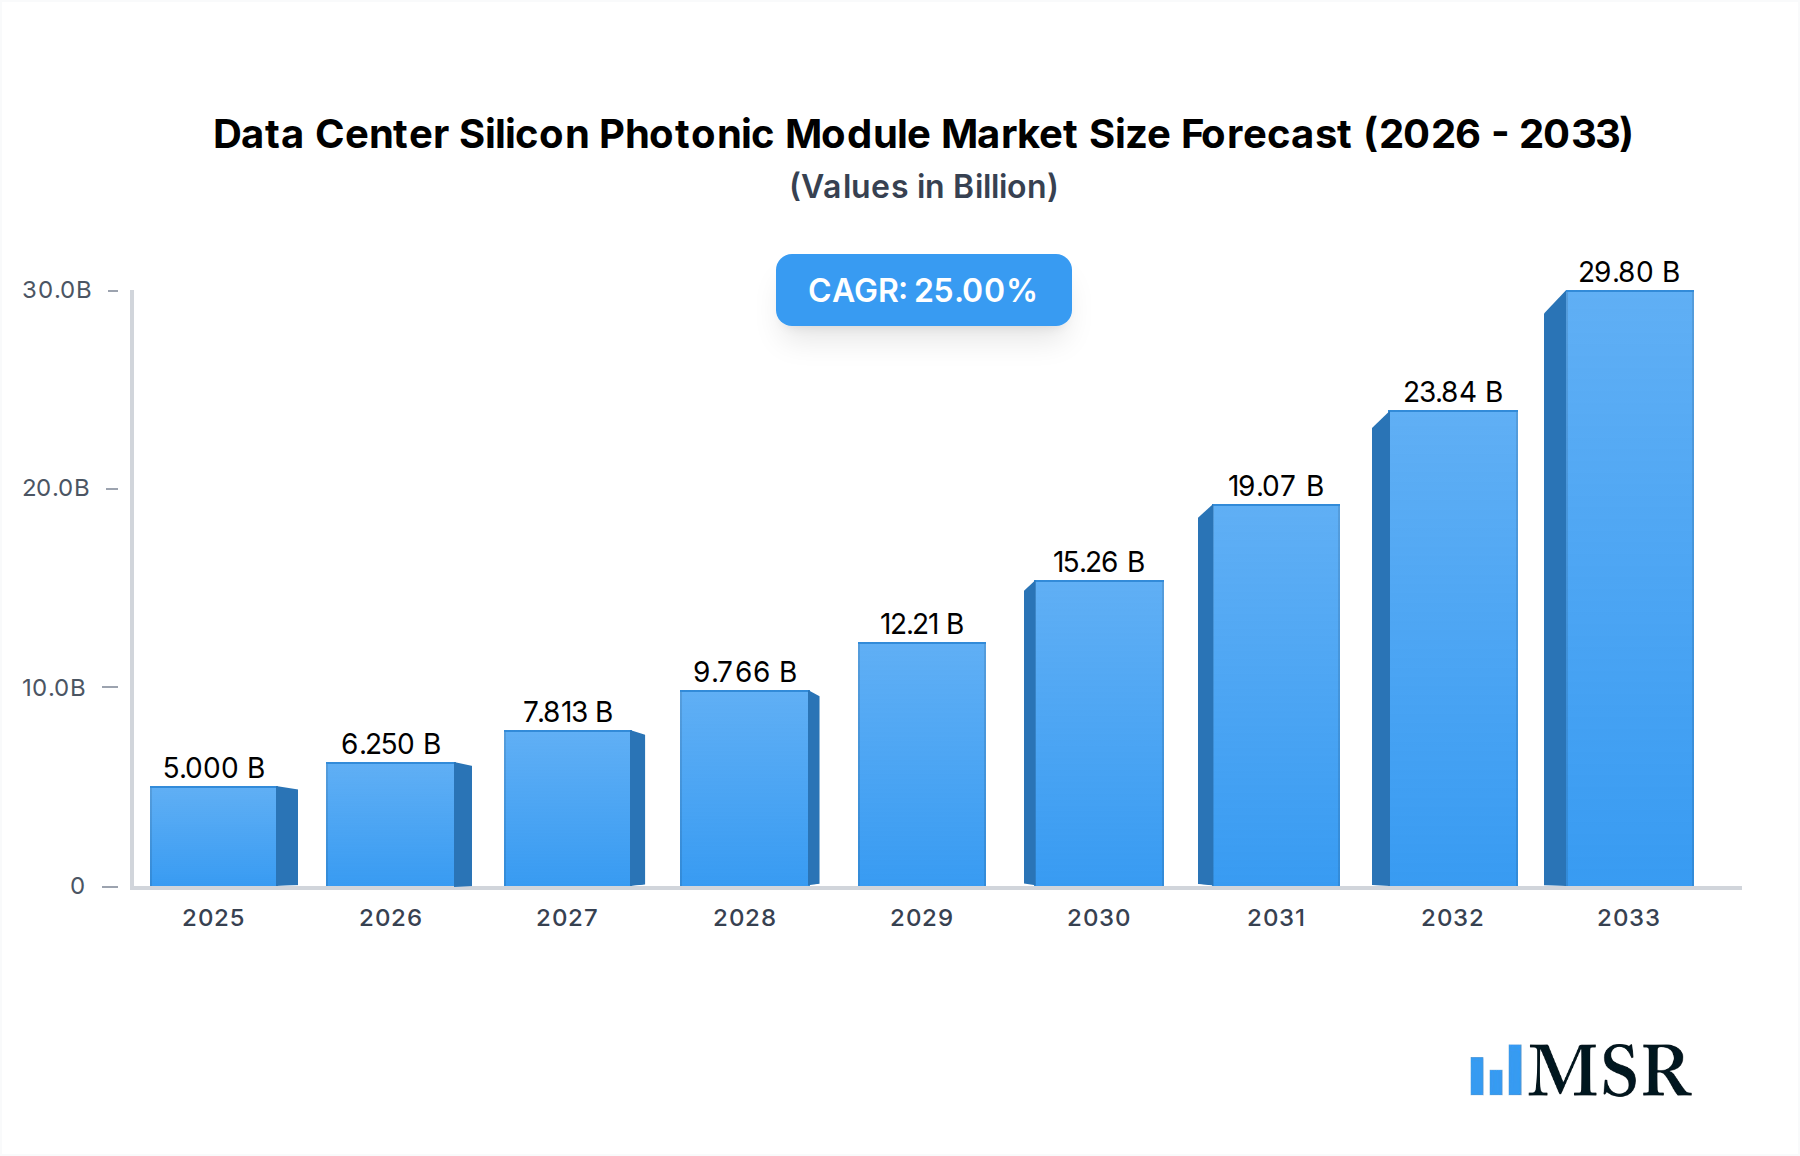
Data Center Silicon Photonic Module Market Size (In Billion)
The market's growth is further supported by advancements in manufacturing techniques and the increasing demand across diverse applications such as finance, internet services, telecommunications, and government infrastructure. While the market exhibits strong upward momentum, certain restraints such as the initial high cost of advanced silicon photonic components and the need for specialized expertise for integration could pose challenges. However, these are expected to be mitigated by economies of scale and ongoing innovation. Key players like Cisco Systems, Intel, InPhi, Finisar (II-VI Incorporated), and Juniper are at the forefront of this technological revolution, actively developing and supplying cutting-edge silicon photonic solutions. The Asia Pacific region, particularly China, is anticipated to be a significant growth engine due to rapid digitalization and massive data center build-outs, while North America and Europe will continue to be major markets driven by established cloud infrastructure and technological advancements.

Data Center Silicon Photonic Module Company Market Share
This in-depth report provides a critical analysis of the global Data Center Silicon Photonic Module market, offering a comprehensive understanding of its dynamics, key trends, and future trajectory. Spanning a study period from 2019 to 2033, with a base and estimated year of 2025 and a forecast period of 2025–2033, this report is an indispensable resource for stakeholders seeking to navigate the rapidly evolving landscape of high-speed optical interconnects for data centers. We delve into market concentration, technological advancements, regional dominance, product innovations, challenges, growth drivers, and emerging opportunities, equipping industry leaders with actionable insights.
Data Center Silicon Photonic Module Market Concentration & Dynamics
The Data Center Silicon Photonic Module market exhibits a moderate to high level of concentration, with a few dominant players controlling significant market share, estimated to be over $50 billion in 2025. Innovation ecosystems are rapidly developing, fueled by substantial investments in research and development, leading to a continuous stream of new product introductions and performance enhancements. Regulatory frameworks, while still evolving, are increasingly focused on standardization and interoperability to facilitate wider adoption. Substitute products, primarily traditional copper interconnects, are gradually being phased out for higher-bandwidth applications where silicon photonics offer superior performance and energy efficiency.
End-user trends are strongly pushing towards increased data traffic demands driven by cloud computing, AI, and 5G deployment. This necessitates faster, more power-efficient interconnects, making silicon photonic modules a critical component. Merger and acquisition (M&A) activities are prevalent as larger companies aim to consolidate their market position and acquire cutting-edge technologies. The number of significant M&A deals is projected to exceed 20 billion dollars in value over the forecast period.
- Key Dynamics:
- Increasing demand for higher data rates (100G, 400G, 800G and beyond).
- Focus on energy efficiency and reduced power consumption in data centers.
- Growing adoption of co-packaged optics and on-board optics solutions.
- Integration of advanced packaging technologies for higher density.
- Geopolitical influences on supply chain resilience.
Data Center Silicon Photonic Module Industry Insights & Trends
The Data Center Silicon Photonic Module industry is experiencing robust growth, projected to reach a market size exceeding $100 billion by 2025, with a Compound Annual Growth Rate (CAGR) of approximately 25% over the forecast period. This expansion is primarily driven by the insatiable demand for bandwidth in modern data centers, necessitated by the proliferation of cloud services, artificial intelligence (AI) workloads, big data analytics, and the rollout of 5G networks. Technological disruptions are a constant theme, with silicon photonics emerging as a pivotal technology enabling higher speeds, greater energy efficiency, and reduced form factors compared to traditional electrical interconnects. The ability to integrate optical components onto silicon wafers, leveraging established semiconductor manufacturing processes, is a significant enabler of cost reduction and scalability.
Evolving consumer behaviors, particularly the increasing reliance on data-intensive applications and services, translate directly into greater demand for high-performance data center infrastructure. The shift towards hyperscale data centers and edge computing further accentuates the need for advanced optical interconnect solutions. Companies are investing heavily in developing modular and pluggable optical transceivers, as well as exploring co-packaged optics (CPO) solutions that bring optical engines closer to the processors, thereby minimizing latency and power consumption. The integration of photonic functionalities directly onto silicon chips represents a paradigm shift, promising unprecedented levels of performance and integration density. Furthermore, advancements in laser technology, modulator efficiency, and photodetector sensitivity are continuously pushing the boundaries of what is achievable in data center interconnects. The ability to transmit data at speeds of 400Gbps, 800Gbps, and even terabit speeds is becoming increasingly crucial for supporting next-generation data center architectures. The ongoing digitalization across various industries, from finance and telecommunications to healthcare and entertainment, further fuels this demand.
- Market Size and Growth:
- Projected Market Size (2025): $100 billion+
- CAGR (2025-2033): ~25%
- Growth Drivers: Cloud computing, AI, Big Data, 5G, IoT, hyperscale data centers.
Key Markets & Segments Leading Data Center Silicon Photonic Module
North America, particularly the United States, is currently the dominant region in the Data Center Silicon Photonic Module market. This dominance is attributed to the presence of leading technology companies, substantial investments in hyperscale data center infrastructure, and a strong ecosystem of research and development. The Internet segment is the primary driver of demand within this region, accounting for an estimated 60% of overall market share in 2025, followed closely by the Telecommunications segment. The increasing deployment of 400G and 800G modules to support the exponential growth of internet traffic and the expansion of 5G networks are key factors.
Dominant Region: North America (USA)
- Drivers for Dominance:
- Concentration of hyperscale data centers.
- High levels of R&D investment in optical networking.
- Early adoption of advanced technologies.
- Robust telecommunications infrastructure.
- Government initiatives supporting digital infrastructure.
- Drivers for Dominance:
Dominant Segments:
- Application: Internet
- Analysis: The insatiable demand for streaming, cloud services, social media, and online gaming within the Internet segment necessitates extremely high bandwidth and low latency, making silicon photonic modules indispensable for data center interconnects. This segment is projected to continue its leading role due to the ongoing digital transformation across all industries.
- Type: 400G and 100G
- Analysis: While 400G modules are rapidly gaining traction for new deployments and upgrades in hyperscale data centers, 100G modules continue to hold a significant market share due to their established presence in existing infrastructure and their cost-effectiveness for certain applications. The transition towards higher speeds is accelerating, with 400G becoming the new baseline for high-performance data center networking. The market is already seeing advancements towards 800G and beyond.
- Application: Internet
Data Center Silicon Photonic Module Product Developments
Product development in the Data Center Silicon Photonic Module sector is characterized by rapid innovation in speed, density, and energy efficiency. Companies are introducing advanced modules supporting 400G, 800G, and beyond, leveraging smaller form factors like QSFP-DD and OSFP. Key advancements include the integration of silicon photonics with advanced semiconductor manufacturing for cost-effective production and improved performance. These developments are crucial for meeting the ever-increasing bandwidth demands of hyperscale data centers, cloud providers, and enterprise networks. The market relevance is underscored by the critical role these modules play in enabling AI, machine learning, and big data analytics.
Challenges in the Data Center Silicon Photonic Module Market
The Data Center Silicon Photonic Module market, despite its immense growth potential, faces several significant challenges. Supply chain disruptions, particularly for critical raw materials and specialized components, can impact production volumes and lead times. The high cost of research and development for cutting-edge technologies, coupled with the need for significant capital investment in advanced manufacturing facilities, presents a barrier for some players. Intense competition from established players and emerging startups also drives down profit margins. Moreover, the complexity of integrating optical components with existing electrical infrastructure requires specialized expertise and careful implementation.
- Key Barriers:
- Supply chain volatility and material sourcing.
- High R&D and manufacturing capital expenditure.
- Intense price competition.
- Integration complexity and specialized expertise requirements.
- Standardization challenges for emerging technologies.
Forces Driving Data Center Silicon Photonic Module Growth
Several powerful forces are driving the growth of the Data Center Silicon Photonic Module market. The exponential growth of data traffic, fueled by cloud computing, AI, and the Internet of Things (IoT), necessitates higher bandwidth and lower latency interconnects. Technological advancements in silicon photonics, allowing for the integration of optical and electrical functions on a single chip, are leading to more cost-effective, power-efficient, and compact modules. The increasing demand for energy efficiency in data centers to reduce operational costs and environmental impact also favors silicon photonic solutions. Furthermore, government investments in digital infrastructure and the expansion of 5G networks are creating a sustained demand for advanced optical networking components.
Challenges in the Data Center Silicon Photonic Module Market
Long-term growth catalysts for the Data Center Silicon Photonic Module market are deeply rooted in continuous innovation and strategic market expansion. The ongoing pursuit of higher data rates, such as the development of 800G and 1.6T modules, will unlock new performance tiers. Strategic partnerships between semiconductor manufacturers, optical component providers, and data center operators are crucial for co-developing solutions that meet future demands. Market expansion into emerging economies and the increasing adoption of AI and machine learning across various industries will create sustained demand. The development of advanced packaging techniques, such as co-packaged optics (CPO), promises to further revolutionize data center architecture and drive adoption.
Emerging Opportunities in Data Center Silicon Photonic Module
Emerging opportunities in the Data Center Silicon Photonic Module market are centered around next-generation technologies and expanding application verticals. The growth of AI and machine learning workloads is creating a demand for specialized photonic solutions that can accelerate computation and data transfer. The development of optical switching and routing technologies represents a significant area for innovation, promising to revolutionize data center network architectures. Expansion into new markets, such as high-performance computing (HPC) and specialized data centers for scientific research, presents substantial growth potential. Furthermore, the integration of silicon photonics with emerging quantum computing technologies could open entirely new avenues for the market.
- Key Opportunities:
- AI/ML specialized interconnects.
- Optical switching and routing solutions.
- High-Performance Computing (HPC) applications.
- Quantum computing integration.
- Edge computing deployments.
Leading Players in the Data Center Silicon Photonic Module Sector
- Cisco Systems
- Intel
- InPhi
- II-VI Incorporated (formerly Finisar)
- Juniper Networks
- Rockley Photonics
- FUJITSU
- Broadex Technologies
- Hengtong Group
- Lumentum Operations LLC
Key Milestones in Data Center Silicon Photonic Module Industry
- 2019: Increased market adoption of 100G silicon photonic modules.
- 2020: Significant R&D investments in 400G silicon photonic transceivers.
- 2021: Emergence of key players focusing on co-packaged optics (CPO) solutions.
- 2022: Advancements in integrated silicon photonics technology for increased density.
- 2023: Growing interest and early deployments of 800G silicon photonic modules.
- 2024: Expansion of manufacturing capacities to meet rising demand.
Strategic Outlook for Data Center Silicon Photonic Module Market
The strategic outlook for the Data Center Silicon Photonic Module market remains exceptionally strong. Growth accelerators will be driven by continued innovation in higher data rates (800G and beyond), the widespread adoption of co-packaged optics (CPO) for enhanced efficiency, and the increasing demand from burgeoning AI and machine learning applications. Strategic investments in next-generation silicon photonics foundries and the development of integrated optical engines will be crucial for maintaining a competitive edge. Furthermore, collaborations across the ecosystem to address standardization and interoperability will foster wider market penetration and unlock new opportunities in hyperscale, enterprise, and emerging data center segments. The market is poised for sustained, high-paced growth, driven by the fundamental need for faster, more efficient, and scalable data communication.
Data Center Silicon Photonic Module Segmentation
-
1. Application
- 1.1. Finance
- 1.2. Internet
- 1.3. Telecommunications
- 1.4. Government
- 1.5. Others
-
2. Types
- 2.1. 40G
- 2.2. 100G
- 2.3. 200G
- 2.4. 400G
Data Center Silicon Photonic Module Segmentation By Geography
-
1. North America
- 1.1. United States
- 1.2. Canada
- 1.3. Mexico
-
2. South America
- 2.1. Brazil
- 2.2. Argentina
- 2.3. Rest of South America
-
3. Europe
- 3.1. United Kingdom
- 3.2. Germany
- 3.3. France
- 3.4. Italy
- 3.5. Spain
- 3.6. Russia
- 3.7. Benelux
- 3.8. Nordics
- 3.9. Rest of Europe
-
4. Middle East & Africa
- 4.1. Turkey
- 4.2. Israel
- 4.3. GCC
- 4.4. North Africa
- 4.5. South Africa
- 4.6. Rest of Middle East & Africa
-
5. Asia Pacific
- 5.1. China
- 5.2. India
- 5.3. Japan
- 5.4. South Korea
- 5.5. ASEAN
- 5.6. Oceania
- 5.7. Rest of Asia Pacific
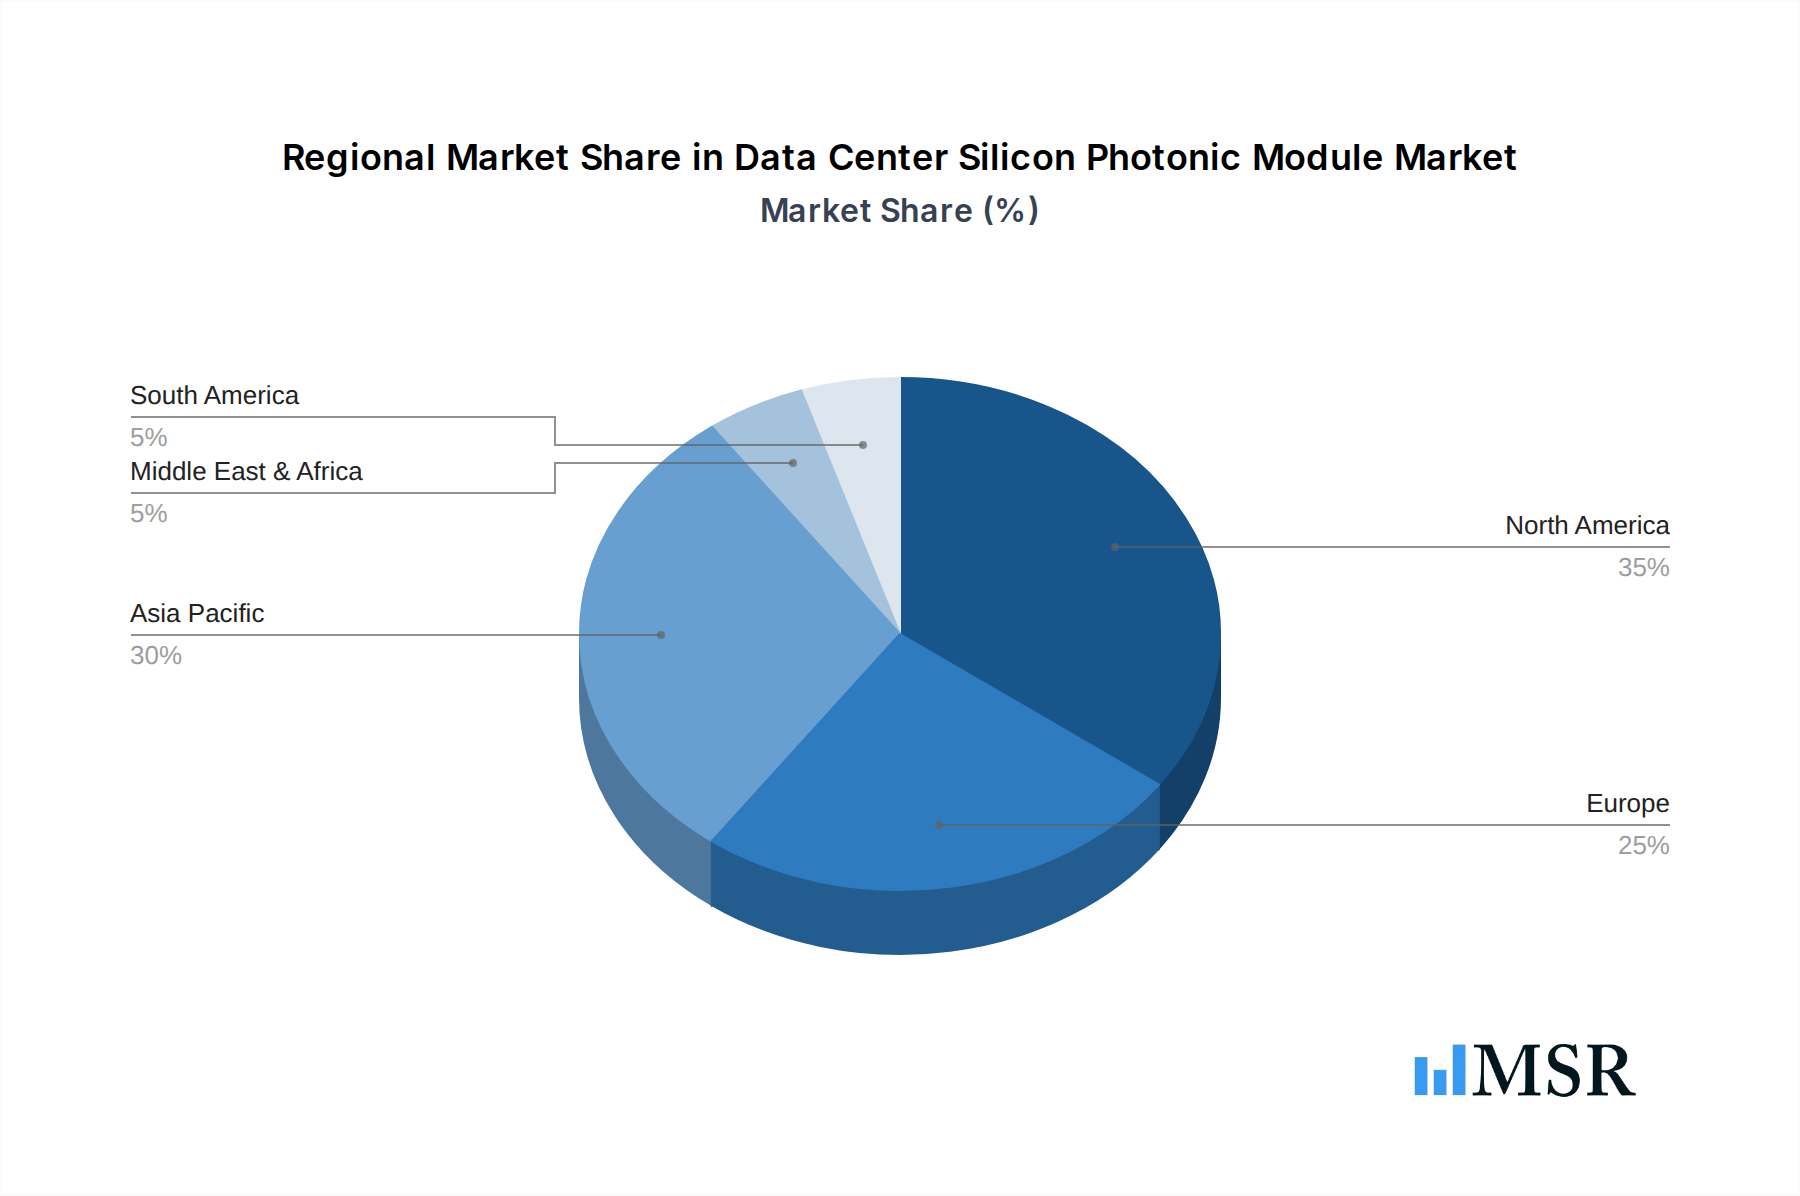
Data Center Silicon Photonic Module Regional Market Share
Geographic Coverage of Data Center Silicon Photonic Module
Data Center Silicon Photonic Module REPORT HIGHLIGHTS
| Aspects | Details |
|---|---|
| Study Period | 2020-2034 |
| Base Year | 2025 |
| Estimated Year | 2026 |
| Forecast Period | 2026-2034 |
| Historical Period | 2020-2025 |
| Growth Rate | CAGR of 25% from 2020-2034 |
| Segmentation |
|
Table of Contents
- 1. Introduction
- 1.1. Research Scope
- 1.2. Market Segmentation
- 1.3. Research Methodology
- 1.4. Definitions and Assumptions
- 2. Executive Summary
- 2.1. Introduction
- 3. Market Dynamics
- 3.1. Introduction
- 3.2. Market Drivers
- 3.3. Market Restrains
- 3.4. Market Trends
- 4. Market Factor Analysis
- 4.1. Porters Five Forces
- 4.2. Supply/Value Chain
- 4.3. PESTEL analysis
- 4.4. Market Entropy
- 4.5. Patent/Trademark Analysis
- 5. Global Data Center Silicon Photonic Module Analysis, Insights and Forecast, 2020-2032
- 5.1. Market Analysis, Insights and Forecast - by Application
- 5.1.1. Finance
- 5.1.2. Internet
- 5.1.3. Telecommunications
- 5.1.4. Government
- 5.1.5. Others
- 5.2. Market Analysis, Insights and Forecast - by Types
- 5.2.1. 40G
- 5.2.2. 100G
- 5.2.3. 200G
- 5.2.4. 400G
- 5.3. Market Analysis, Insights and Forecast - by Region
- 5.3.1. North America
- 5.3.2. South America
- 5.3.3. Europe
- 5.3.4. Middle East & Africa
- 5.3.5. Asia Pacific
- 5.1. Market Analysis, Insights and Forecast - by Application
- 6. North America Data Center Silicon Photonic Module Analysis, Insights and Forecast, 2020-2032
- 6.1. Market Analysis, Insights and Forecast - by Application
- 6.1.1. Finance
- 6.1.2. Internet
- 6.1.3. Telecommunications
- 6.1.4. Government
- 6.1.5. Others
- 6.2. Market Analysis, Insights and Forecast - by Types
- 6.2.1. 40G
- 6.2.2. 100G
- 6.2.3. 200G
- 6.2.4. 400G
- 6.1. Market Analysis, Insights and Forecast - by Application
- 7. South America Data Center Silicon Photonic Module Analysis, Insights and Forecast, 2020-2032
- 7.1. Market Analysis, Insights and Forecast - by Application
- 7.1.1. Finance
- 7.1.2. Internet
- 7.1.3. Telecommunications
- 7.1.4. Government
- 7.1.5. Others
- 7.2. Market Analysis, Insights and Forecast - by Types
- 7.2.1. 40G
- 7.2.2. 100G
- 7.2.3. 200G
- 7.2.4. 400G
- 7.1. Market Analysis, Insights and Forecast - by Application
- 8. Europe Data Center Silicon Photonic Module Analysis, Insights and Forecast, 2020-2032
- 8.1. Market Analysis, Insights and Forecast - by Application
- 8.1.1. Finance
- 8.1.2. Internet
- 8.1.3. Telecommunications
- 8.1.4. Government
- 8.1.5. Others
- 8.2. Market Analysis, Insights and Forecast - by Types
- 8.2.1. 40G
- 8.2.2. 100G
- 8.2.3. 200G
- 8.2.4. 400G
- 8.1. Market Analysis, Insights and Forecast - by Application
- 9. Middle East & Africa Data Center Silicon Photonic Module Analysis, Insights and Forecast, 2020-2032
- 9.1. Market Analysis, Insights and Forecast - by Application
- 9.1.1. Finance
- 9.1.2. Internet
- 9.1.3. Telecommunications
- 9.1.4. Government
- 9.1.5. Others
- 9.2. Market Analysis, Insights and Forecast - by Types
- 9.2.1. 40G
- 9.2.2. 100G
- 9.2.3. 200G
- 9.2.4. 400G
- 9.1. Market Analysis, Insights and Forecast - by Application
- 10. Asia Pacific Data Center Silicon Photonic Module Analysis, Insights and Forecast, 2020-2032
- 10.1. Market Analysis, Insights and Forecast - by Application
- 10.1.1. Finance
- 10.1.2. Internet
- 10.1.3. Telecommunications
- 10.1.4. Government
- 10.1.5. Others
- 10.2. Market Analysis, Insights and Forecast - by Types
- 10.2.1. 40G
- 10.2.2. 100G
- 10.2.3. 200G
- 10.2.4. 400G
- 10.1. Market Analysis, Insights and Forecast - by Application
- 11. Competitive Analysis
- 11.1. Global Market Share Analysis 2025
- 11.2. Company Profiles
- 11.2.1 Cisco Systems
- 11.2.1.1. Overview
- 11.2.1.2. Products
- 11.2.1.3. SWOT Analysis
- 11.2.1.4. Recent Developments
- 11.2.1.5. Financials (Based on Availability)
- 11.2.2 Intel
- 11.2.2.1. Overview
- 11.2.2.2. Products
- 11.2.2.3. SWOT Analysis
- 11.2.2.4. Recent Developments
- 11.2.2.5. Financials (Based on Availability)
- 11.2.3 InPhi
- 11.2.3.1. Overview
- 11.2.3.2. Products
- 11.2.3.3. SWOT Analysis
- 11.2.3.4. Recent Developments
- 11.2.3.5. Financials (Based on Availability)
- 11.2.4 Finisar (II-VI Incorporated)
- 11.2.4.1. Overview
- 11.2.4.2. Products
- 11.2.4.3. SWOT Analysis
- 11.2.4.4. Recent Developments
- 11.2.4.5. Financials (Based on Availability)
- 11.2.5 Juniper
- 11.2.5.1. Overview
- 11.2.5.2. Products
- 11.2.5.3. SWOT Analysis
- 11.2.5.4. Recent Developments
- 11.2.5.5. Financials (Based on Availability)
- 11.2.6 Rockley Photonics
- 11.2.6.1. Overview
- 11.2.6.2. Products
- 11.2.6.3. SWOT Analysis
- 11.2.6.4. Recent Developments
- 11.2.6.5. Financials (Based on Availability)
- 11.2.7 FUJITSU
- 11.2.7.1. Overview
- 11.2.7.2. Products
- 11.2.7.3. SWOT Analysis
- 11.2.7.4. Recent Developments
- 11.2.7.5. Financials (Based on Availability)
- 11.2.8 Broadex
- 11.2.8.1. Overview
- 11.2.8.2. Products
- 11.2.8.3. SWOT Analysis
- 11.2.8.4. Recent Developments
- 11.2.8.5. Financials (Based on Availability)
- 11.2.9 Hengtong Group
- 11.2.9.1. Overview
- 11.2.9.2. Products
- 11.2.9.3. SWOT Analysis
- 11.2.9.4. Recent Developments
- 11.2.9.5. Financials (Based on Availability)
- 11.2.1 Cisco Systems
List of Figures
- Figure 1: Global Data Center Silicon Photonic Module Revenue Breakdown (undefined, %) by Region 2025 & 2033
- Figure 2: Global Data Center Silicon Photonic Module Volume Breakdown (K, %) by Region 2025 & 2033
- Figure 3: North America Data Center Silicon Photonic Module Revenue (undefined), by Application 2025 & 2033
- Figure 4: North America Data Center Silicon Photonic Module Volume (K), by Application 2025 & 2033
- Figure 5: North America Data Center Silicon Photonic Module Revenue Share (%), by Application 2025 & 2033
- Figure 6: North America Data Center Silicon Photonic Module Volume Share (%), by Application 2025 & 2033
- Figure 7: North America Data Center Silicon Photonic Module Revenue (undefined), by Types 2025 & 2033
- Figure 8: North America Data Center Silicon Photonic Module Volume (K), by Types 2025 & 2033
- Figure 9: North America Data Center Silicon Photonic Module Revenue Share (%), by Types 2025 & 2033
- Figure 10: North America Data Center Silicon Photonic Module Volume Share (%), by Types 2025 & 2033
- Figure 11: North America Data Center Silicon Photonic Module Revenue (undefined), by Country 2025 & 2033
- Figure 12: North America Data Center Silicon Photonic Module Volume (K), by Country 2025 & 2033
- Figure 13: North America Data Center Silicon Photonic Module Revenue Share (%), by Country 2025 & 2033
- Figure 14: North America Data Center Silicon Photonic Module Volume Share (%), by Country 2025 & 2033
- Figure 15: South America Data Center Silicon Photonic Module Revenue (undefined), by Application 2025 & 2033
- Figure 16: South America Data Center Silicon Photonic Module Volume (K), by Application 2025 & 2033
- Figure 17: South America Data Center Silicon Photonic Module Revenue Share (%), by Application 2025 & 2033
- Figure 18: South America Data Center Silicon Photonic Module Volume Share (%), by Application 2025 & 2033
- Figure 19: South America Data Center Silicon Photonic Module Revenue (undefined), by Types 2025 & 2033
- Figure 20: South America Data Center Silicon Photonic Module Volume (K), by Types 2025 & 2033
- Figure 21: South America Data Center Silicon Photonic Module Revenue Share (%), by Types 2025 & 2033
- Figure 22: South America Data Center Silicon Photonic Module Volume Share (%), by Types 2025 & 2033
- Figure 23: South America Data Center Silicon Photonic Module Revenue (undefined), by Country 2025 & 2033
- Figure 24: South America Data Center Silicon Photonic Module Volume (K), by Country 2025 & 2033
- Figure 25: South America Data Center Silicon Photonic Module Revenue Share (%), by Country 2025 & 2033
- Figure 26: South America Data Center Silicon Photonic Module Volume Share (%), by Country 2025 & 2033
- Figure 27: Europe Data Center Silicon Photonic Module Revenue (undefined), by Application 2025 & 2033
- Figure 28: Europe Data Center Silicon Photonic Module Volume (K), by Application 2025 & 2033
- Figure 29: Europe Data Center Silicon Photonic Module Revenue Share (%), by Application 2025 & 2033
- Figure 30: Europe Data Center Silicon Photonic Module Volume Share (%), by Application 2025 & 2033
- Figure 31: Europe Data Center Silicon Photonic Module Revenue (undefined), by Types 2025 & 2033
- Figure 32: Europe Data Center Silicon Photonic Module Volume (K), by Types 2025 & 2033
- Figure 33: Europe Data Center Silicon Photonic Module Revenue Share (%), by Types 2025 & 2033
- Figure 34: Europe Data Center Silicon Photonic Module Volume Share (%), by Types 2025 & 2033
- Figure 35: Europe Data Center Silicon Photonic Module Revenue (undefined), by Country 2025 & 2033
- Figure 36: Europe Data Center Silicon Photonic Module Volume (K), by Country 2025 & 2033
- Figure 37: Europe Data Center Silicon Photonic Module Revenue Share (%), by Country 2025 & 2033
- Figure 38: Europe Data Center Silicon Photonic Module Volume Share (%), by Country 2025 & 2033
- Figure 39: Middle East & Africa Data Center Silicon Photonic Module Revenue (undefined), by Application 2025 & 2033
- Figure 40: Middle East & Africa Data Center Silicon Photonic Module Volume (K), by Application 2025 & 2033
- Figure 41: Middle East & Africa Data Center Silicon Photonic Module Revenue Share (%), by Application 2025 & 2033
- Figure 42: Middle East & Africa Data Center Silicon Photonic Module Volume Share (%), by Application 2025 & 2033
- Figure 43: Middle East & Africa Data Center Silicon Photonic Module Revenue (undefined), by Types 2025 & 2033
- Figure 44: Middle East & Africa Data Center Silicon Photonic Module Volume (K), by Types 2025 & 2033
- Figure 45: Middle East & Africa Data Center Silicon Photonic Module Revenue Share (%), by Types 2025 & 2033
- Figure 46: Middle East & Africa Data Center Silicon Photonic Module Volume Share (%), by Types 2025 & 2033
- Figure 47: Middle East & Africa Data Center Silicon Photonic Module Revenue (undefined), by Country 2025 & 2033
- Figure 48: Middle East & Africa Data Center Silicon Photonic Module Volume (K), by Country 2025 & 2033
- Figure 49: Middle East & Africa Data Center Silicon Photonic Module Revenue Share (%), by Country 2025 & 2033
- Figure 50: Middle East & Africa Data Center Silicon Photonic Module Volume Share (%), by Country 2025 & 2033
- Figure 51: Asia Pacific Data Center Silicon Photonic Module Revenue (undefined), by Application 2025 & 2033
- Figure 52: Asia Pacific Data Center Silicon Photonic Module Volume (K), by Application 2025 & 2033
- Figure 53: Asia Pacific Data Center Silicon Photonic Module Revenue Share (%), by Application 2025 & 2033
- Figure 54: Asia Pacific Data Center Silicon Photonic Module Volume Share (%), by Application 2025 & 2033
- Figure 55: Asia Pacific Data Center Silicon Photonic Module Revenue (undefined), by Types 2025 & 2033
- Figure 56: Asia Pacific Data Center Silicon Photonic Module Volume (K), by Types 2025 & 2033
- Figure 57: Asia Pacific Data Center Silicon Photonic Module Revenue Share (%), by Types 2025 & 2033
- Figure 58: Asia Pacific Data Center Silicon Photonic Module Volume Share (%), by Types 2025 & 2033
- Figure 59: Asia Pacific Data Center Silicon Photonic Module Revenue (undefined), by Country 2025 & 2033
- Figure 60: Asia Pacific Data Center Silicon Photonic Module Volume (K), by Country 2025 & 2033
- Figure 61: Asia Pacific Data Center Silicon Photonic Module Revenue Share (%), by Country 2025 & 2033
- Figure 62: Asia Pacific Data Center Silicon Photonic Module Volume Share (%), by Country 2025 & 2033
List of Tables
- Table 1: Global Data Center Silicon Photonic Module Revenue undefined Forecast, by Application 2020 & 2033
- Table 2: Global Data Center Silicon Photonic Module Volume K Forecast, by Application 2020 & 2033
- Table 3: Global Data Center Silicon Photonic Module Revenue undefined Forecast, by Types 2020 & 2033
- Table 4: Global Data Center Silicon Photonic Module Volume K Forecast, by Types 2020 & 2033
- Table 5: Global Data Center Silicon Photonic Module Revenue undefined Forecast, by Region 2020 & 2033
- Table 6: Global Data Center Silicon Photonic Module Volume K Forecast, by Region 2020 & 2033
- Table 7: Global Data Center Silicon Photonic Module Revenue undefined Forecast, by Application 2020 & 2033
- Table 8: Global Data Center Silicon Photonic Module Volume K Forecast, by Application 2020 & 2033
- Table 9: Global Data Center Silicon Photonic Module Revenue undefined Forecast, by Types 2020 & 2033
- Table 10: Global Data Center Silicon Photonic Module Volume K Forecast, by Types 2020 & 2033
- Table 11: Global Data Center Silicon Photonic Module Revenue undefined Forecast, by Country 2020 & 2033
- Table 12: Global Data Center Silicon Photonic Module Volume K Forecast, by Country 2020 & 2033
- Table 13: United States Data Center Silicon Photonic Module Revenue (undefined) Forecast, by Application 2020 & 2033
- Table 14: United States Data Center Silicon Photonic Module Volume (K) Forecast, by Application 2020 & 2033
- Table 15: Canada Data Center Silicon Photonic Module Revenue (undefined) Forecast, by Application 2020 & 2033
- Table 16: Canada Data Center Silicon Photonic Module Volume (K) Forecast, by Application 2020 & 2033
- Table 17: Mexico Data Center Silicon Photonic Module Revenue (undefined) Forecast, by Application 2020 & 2033
- Table 18: Mexico Data Center Silicon Photonic Module Volume (K) Forecast, by Application 2020 & 2033
- Table 19: Global Data Center Silicon Photonic Module Revenue undefined Forecast, by Application 2020 & 2033
- Table 20: Global Data Center Silicon Photonic Module Volume K Forecast, by Application 2020 & 2033
- Table 21: Global Data Center Silicon Photonic Module Revenue undefined Forecast, by Types 2020 & 2033
- Table 22: Global Data Center Silicon Photonic Module Volume K Forecast, by Types 2020 & 2033
- Table 23: Global Data Center Silicon Photonic Module Revenue undefined Forecast, by Country 2020 & 2033
- Table 24: Global Data Center Silicon Photonic Module Volume K Forecast, by Country 2020 & 2033
- Table 25: Brazil Data Center Silicon Photonic Module Revenue (undefined) Forecast, by Application 2020 & 2033
- Table 26: Brazil Data Center Silicon Photonic Module Volume (K) Forecast, by Application 2020 & 2033
- Table 27: Argentina Data Center Silicon Photonic Module Revenue (undefined) Forecast, by Application 2020 & 2033
- Table 28: Argentina Data Center Silicon Photonic Module Volume (K) Forecast, by Application 2020 & 2033
- Table 29: Rest of South America Data Center Silicon Photonic Module Revenue (undefined) Forecast, by Application 2020 & 2033
- Table 30: Rest of South America Data Center Silicon Photonic Module Volume (K) Forecast, by Application 2020 & 2033
- Table 31: Global Data Center Silicon Photonic Module Revenue undefined Forecast, by Application 2020 & 2033
- Table 32: Global Data Center Silicon Photonic Module Volume K Forecast, by Application 2020 & 2033
- Table 33: Global Data Center Silicon Photonic Module Revenue undefined Forecast, by Types 2020 & 2033
- Table 34: Global Data Center Silicon Photonic Module Volume K Forecast, by Types 2020 & 2033
- Table 35: Global Data Center Silicon Photonic Module Revenue undefined Forecast, by Country 2020 & 2033
- Table 36: Global Data Center Silicon Photonic Module Volume K Forecast, by Country 2020 & 2033
- Table 37: United Kingdom Data Center Silicon Photonic Module Revenue (undefined) Forecast, by Application 2020 & 2033
- Table 38: United Kingdom Data Center Silicon Photonic Module Volume (K) Forecast, by Application 2020 & 2033
- Table 39: Germany Data Center Silicon Photonic Module Revenue (undefined) Forecast, by Application 2020 & 2033
- Table 40: Germany Data Center Silicon Photonic Module Volume (K) Forecast, by Application 2020 & 2033
- Table 41: France Data Center Silicon Photonic Module Revenue (undefined) Forecast, by Application 2020 & 2033
- Table 42: France Data Center Silicon Photonic Module Volume (K) Forecast, by Application 2020 & 2033
- Table 43: Italy Data Center Silicon Photonic Module Revenue (undefined) Forecast, by Application 2020 & 2033
- Table 44: Italy Data Center Silicon Photonic Module Volume (K) Forecast, by Application 2020 & 2033
- Table 45: Spain Data Center Silicon Photonic Module Revenue (undefined) Forecast, by Application 2020 & 2033
- Table 46: Spain Data Center Silicon Photonic Module Volume (K) Forecast, by Application 2020 & 2033
- Table 47: Russia Data Center Silicon Photonic Module Revenue (undefined) Forecast, by Application 2020 & 2033
- Table 48: Russia Data Center Silicon Photonic Module Volume (K) Forecast, by Application 2020 & 2033
- Table 49: Benelux Data Center Silicon Photonic Module Revenue (undefined) Forecast, by Application 2020 & 2033
- Table 50: Benelux Data Center Silicon Photonic Module Volume (K) Forecast, by Application 2020 & 2033
- Table 51: Nordics Data Center Silicon Photonic Module Revenue (undefined) Forecast, by Application 2020 & 2033
- Table 52: Nordics Data Center Silicon Photonic Module Volume (K) Forecast, by Application 2020 & 2033
- Table 53: Rest of Europe Data Center Silicon Photonic Module Revenue (undefined) Forecast, by Application 2020 & 2033
- Table 54: Rest of Europe Data Center Silicon Photonic Module Volume (K) Forecast, by Application 2020 & 2033
- Table 55: Global Data Center Silicon Photonic Module Revenue undefined Forecast, by Application 2020 & 2033
- Table 56: Global Data Center Silicon Photonic Module Volume K Forecast, by Application 2020 & 2033
- Table 57: Global Data Center Silicon Photonic Module Revenue undefined Forecast, by Types 2020 & 2033
- Table 58: Global Data Center Silicon Photonic Module Volume K Forecast, by Types 2020 & 2033
- Table 59: Global Data Center Silicon Photonic Module Revenue undefined Forecast, by Country 2020 & 2033
- Table 60: Global Data Center Silicon Photonic Module Volume K Forecast, by Country 2020 & 2033
- Table 61: Turkey Data Center Silicon Photonic Module Revenue (undefined) Forecast, by Application 2020 & 2033
- Table 62: Turkey Data Center Silicon Photonic Module Volume (K) Forecast, by Application 2020 & 2033
- Table 63: Israel Data Center Silicon Photonic Module Revenue (undefined) Forecast, by Application 2020 & 2033
- Table 64: Israel Data Center Silicon Photonic Module Volume (K) Forecast, by Application 2020 & 2033
- Table 65: GCC Data Center Silicon Photonic Module Revenue (undefined) Forecast, by Application 2020 & 2033
- Table 66: GCC Data Center Silicon Photonic Module Volume (K) Forecast, by Application 2020 & 2033
- Table 67: North Africa Data Center Silicon Photonic Module Revenue (undefined) Forecast, by Application 2020 & 2033
- Table 68: North Africa Data Center Silicon Photonic Module Volume (K) Forecast, by Application 2020 & 2033
- Table 69: South Africa Data Center Silicon Photonic Module Revenue (undefined) Forecast, by Application 2020 & 2033
- Table 70: South Africa Data Center Silicon Photonic Module Volume (K) Forecast, by Application 2020 & 2033
- Table 71: Rest of Middle East & Africa Data Center Silicon Photonic Module Revenue (undefined) Forecast, by Application 2020 & 2033
- Table 72: Rest of Middle East & Africa Data Center Silicon Photonic Module Volume (K) Forecast, by Application 2020 & 2033
- Table 73: Global Data Center Silicon Photonic Module Revenue undefined Forecast, by Application 2020 & 2033
- Table 74: Global Data Center Silicon Photonic Module Volume K Forecast, by Application 2020 & 2033
- Table 75: Global Data Center Silicon Photonic Module Revenue undefined Forecast, by Types 2020 & 2033
- Table 76: Global Data Center Silicon Photonic Module Volume K Forecast, by Types 2020 & 2033
- Table 77: Global Data Center Silicon Photonic Module Revenue undefined Forecast, by Country 2020 & 2033
- Table 78: Global Data Center Silicon Photonic Module Volume K Forecast, by Country 2020 & 2033
- Table 79: China Data Center Silicon Photonic Module Revenue (undefined) Forecast, by Application 2020 & 2033
- Table 80: China Data Center Silicon Photonic Module Volume (K) Forecast, by Application 2020 & 2033
- Table 81: India Data Center Silicon Photonic Module Revenue (undefined) Forecast, by Application 2020 & 2033
- Table 82: India Data Center Silicon Photonic Module Volume (K) Forecast, by Application 2020 & 2033
- Table 83: Japan Data Center Silicon Photonic Module Revenue (undefined) Forecast, by Application 2020 & 2033
- Table 84: Japan Data Center Silicon Photonic Module Volume (K) Forecast, by Application 2020 & 2033
- Table 85: South Korea Data Center Silicon Photonic Module Revenue (undefined) Forecast, by Application 2020 & 2033
- Table 86: South Korea Data Center Silicon Photonic Module Volume (K) Forecast, by Application 2020 & 2033
- Table 87: ASEAN Data Center Silicon Photonic Module Revenue (undefined) Forecast, by Application 2020 & 2033
- Table 88: ASEAN Data Center Silicon Photonic Module Volume (K) Forecast, by Application 2020 & 2033
- Table 89: Oceania Data Center Silicon Photonic Module Revenue (undefined) Forecast, by Application 2020 & 2033
- Table 90: Oceania Data Center Silicon Photonic Module Volume (K) Forecast, by Application 2020 & 2033
- Table 91: Rest of Asia Pacific Data Center Silicon Photonic Module Revenue (undefined) Forecast, by Application 2020 & 2033
- Table 92: Rest of Asia Pacific Data Center Silicon Photonic Module Volume (K) Forecast, by Application 2020 & 2033
Frequently Asked Questions
1. What is the projected Compound Annual Growth Rate (CAGR) of the Data Center Silicon Photonic Module?
The projected CAGR is approximately 25%.
2. Which companies are prominent players in the Data Center Silicon Photonic Module?
Key companies in the market include Cisco Systems, Intel, InPhi, Finisar (II-VI Incorporated), Juniper, Rockley Photonics, FUJITSU, Broadex, Hengtong Group.
3. What are the main segments of the Data Center Silicon Photonic Module?
The market segments include Application, Types.
4. Can you provide details about the market size?
The market size is estimated to be USD XXX N/A as of 2022.
5. What are some drivers contributing to market growth?
N/A
6. What are the notable trends driving market growth?
N/A
7. Are there any restraints impacting market growth?
N/A
8. Can you provide examples of recent developments in the market?
N/A
9. What pricing options are available for accessing the report?
Pricing options include single-user, multi-user, and enterprise licenses priced at USD 3350.00, USD 5025.00, and USD 6700.00 respectively.
10. Is the market size provided in terms of value or volume?
The market size is provided in terms of value, measured in N/A and volume, measured in K.
11. Are there any specific market keywords associated with the report?
Yes, the market keyword associated with the report is "Data Center Silicon Photonic Module," which aids in identifying and referencing the specific market segment covered.
12. How do I determine which pricing option suits my needs best?
The pricing options vary based on user requirements and access needs. Individual users may opt for single-user licenses, while businesses requiring broader access may choose multi-user or enterprise licenses for cost-effective access to the report.
13. Are there any additional resources or data provided in the Data Center Silicon Photonic Module report?
While the report offers comprehensive insights, it's advisable to review the specific contents or supplementary materials provided to ascertain if additional resources or data are available.
14. How can I stay updated on further developments or reports in the Data Center Silicon Photonic Module?
To stay informed about further developments, trends, and reports in the Data Center Silicon Photonic Module, consider subscribing to industry newsletters, following relevant companies and organizations, or regularly checking reputable industry news sources and publications.
Methodology
Step 1 - Identification of Relevant Samples Size from Population Database


Step 2 - Approaches for Defining Global Market Size (Value, Volume* & Price*)

Note*: In applicable scenarios
Step 3 - Data Sources
Primary Research
- Web Analytics
- Survey Reports
- Research Institute
- Latest Research Reports
- Opinion Leaders
Secondary Research
- Annual Reports
- White Paper
- Latest Press Release
- Industry Association
- Paid Database
- Investor Presentations

Step 4 - Data Triangulation
Involves using different sources of information in order to increase the validity of a study
These sources are likely to be stakeholders in a program - participants, other researchers, program staff, other community members, and so on.
Then we put all data in single framework & apply various statistical tools to find out the dynamic on the market.
During the analysis stage, feedback from the stakeholder groups would be compared to determine areas of agreement as well as areas of divergence