

Key Insights
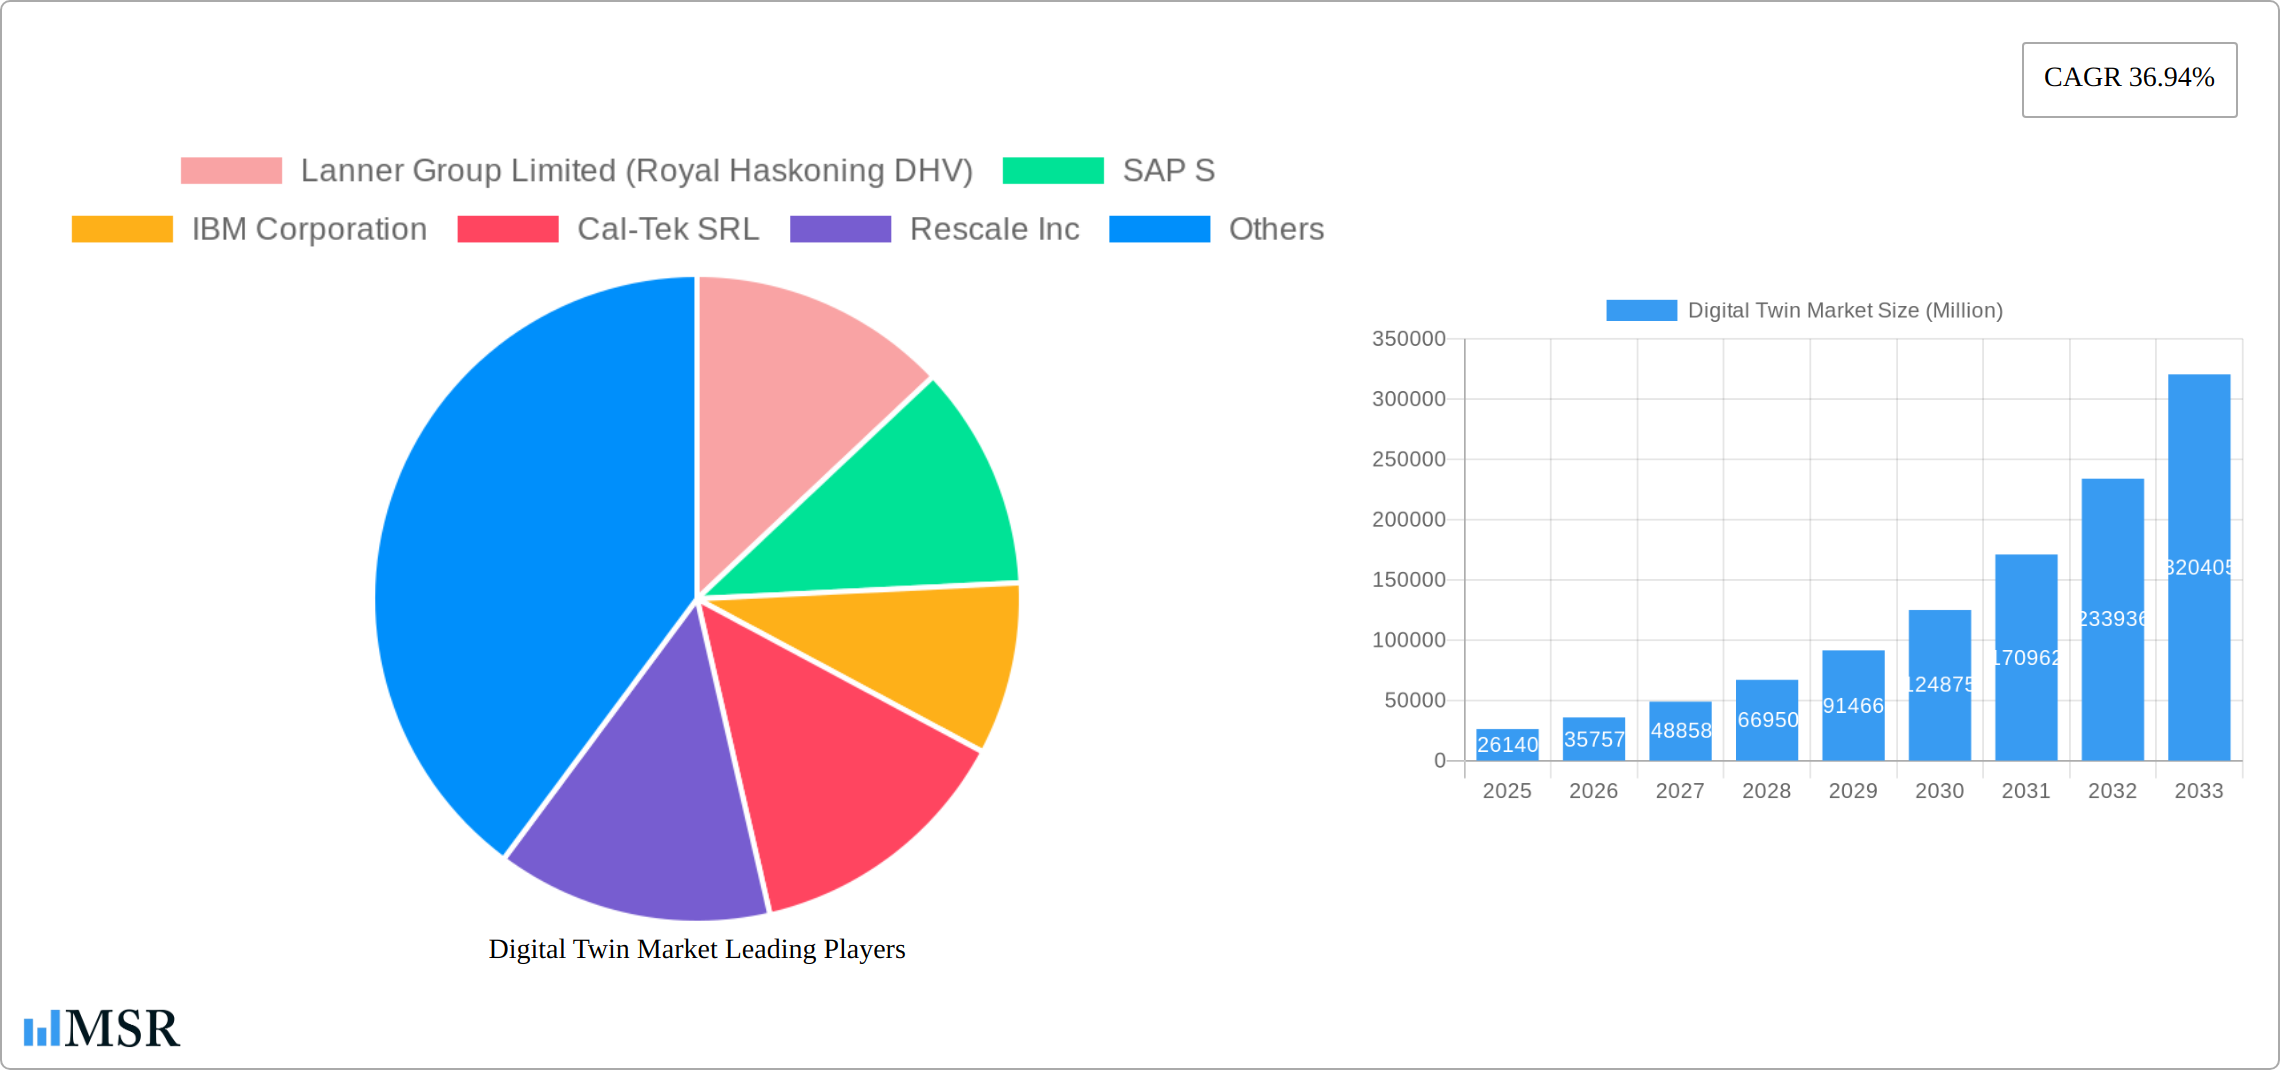
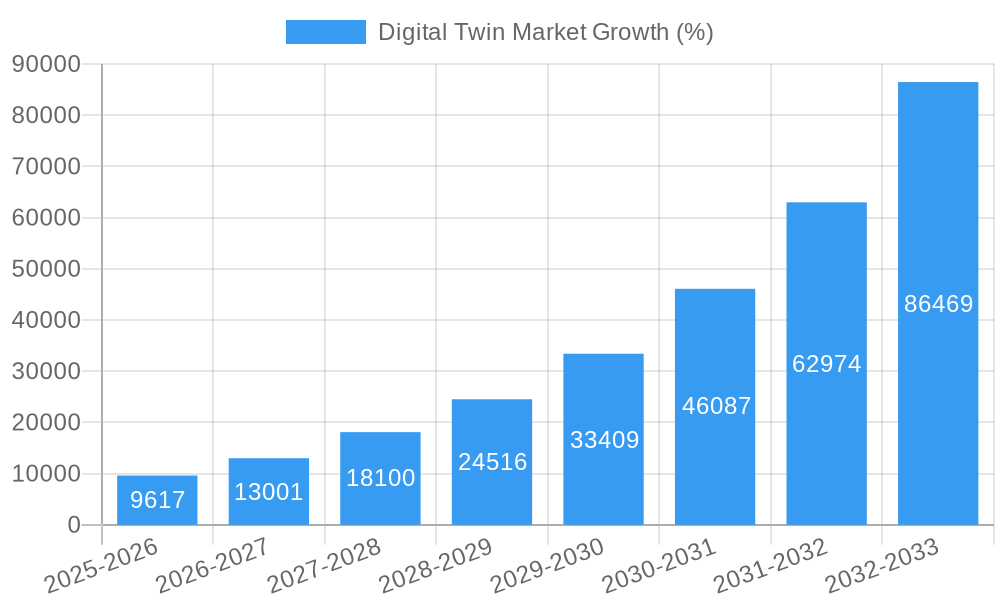
The Digital Twin market is experiencing explosive growth, projected to reach \$26.14 billion in 2025 and exhibiting a remarkable Compound Annual Growth Rate (CAGR) of 36.94%. This surge is driven by several key factors. Firstly, the increasing adoption of Industry 4.0 and the Internet of Things (IoT) across various sectors fuels the demand for accurate virtual representations of physical assets. Manufacturers leverage digital twins for predictive maintenance, optimizing production processes, and reducing downtime, while the energy and power sector utilizes them for improved grid management and renewable energy integration. The aerospace industry benefits from enhanced design, testing, and operational efficiency, similarly seen in the automotive and oil & gas industries for optimizing resource utilization and safety protocols. Furthermore, advancements in data analytics, cloud computing, and artificial intelligence are enabling the creation of more sophisticated and insightful digital twins, further propelling market expansion. The diverse applications across industries ensure sustained growth throughout the forecast period.
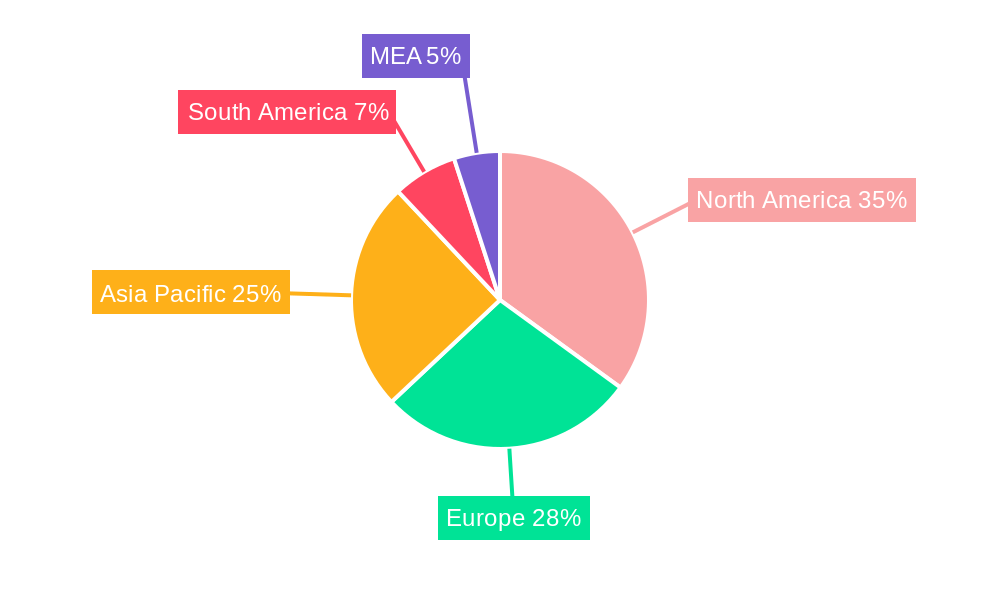
The market segmentation reveals a robust presence across different geographical regions. North America, with its advanced technological infrastructure and early adoption of digital twin technologies, currently holds a significant market share. Europe follows closely, driven by strong industrial sectors and government initiatives promoting digital transformation. The Asia-Pacific region is expected to witness the fastest growth, fueled by increasing industrialization and investments in digital technologies across countries like China, India, and Japan. Key players like Lanner Group, SAP, IBM, and ANSYS are actively contributing to market expansion through innovative product offerings and strategic partnerships. However, challenges remain, including data security concerns, high initial investment costs, and the need for skilled professionals to manage and interpret complex digital twin models. Despite these hurdles, the overall market outlook for digital twins remains overwhelmingly positive, promising significant growth and transformation across numerous industries in the coming years.
Digital Twin Market Report: 2019-2033 Forecast
This comprehensive report provides an in-depth analysis of the Digital Twin Market, encompassing market size, growth drivers, key players, and future trends. The study period covers 2019-2033, with a base year of 2025 and a forecast period of 2025-2033. The report offers actionable insights for industry stakeholders, investors, and businesses seeking to navigate this rapidly evolving landscape. The market is projected to reach xx Million by 2033, exhibiting a CAGR of xx% during the forecast period.
Digital Twin Market Market Concentration & Dynamics
The Digital Twin market exhibits a moderately concentrated landscape, with several key players holding significant market share. The market share distribution amongst the top five players in 2024 is estimated to be approximately xx%. However, the emergence of numerous innovative startups and the increasing adoption of digital twins across various sectors is leading to a more dynamic competitive environment. This dynamic is further fueled by a robust innovation ecosystem, with significant investments in R&D driving technological advancements in areas such as AI, IoT, and cloud computing.
Regulatory frameworks, although still evolving, are playing a crucial role in shaping market growth, particularly concerning data privacy and security. Substitute products, such as traditional simulation models, present some competition, but the superior capabilities of digital twins in terms of real-time data integration and predictive analytics are driving their widespread adoption. End-user trends are moving towards the increasing adoption of digital twins for enhancing operational efficiency, reducing costs, and improving decision-making.
M&A activity in the Digital Twin market has been steadily increasing, with xx deals recorded in the period 2019-2024. These acquisitions are primarily driven by the need to expand product portfolios, enhance technological capabilities, and penetrate new markets. Major players are actively pursuing strategic partnerships and collaborations to gain a competitive edge and accelerate the development and deployment of advanced digital twin solutions.
Digital Twin Market Industry Insights & Trends
The Digital Twin market is experiencing robust growth, driven by several key factors. The increasing adoption of Industry 4.0 technologies, the rising demand for enhanced operational efficiency, and the growing need for predictive maintenance are significant contributors to market expansion. Technological disruptions, particularly advancements in AI, machine learning, and cloud computing, are continuously enhancing the capabilities of digital twins, enabling them to provide more accurate and actionable insights. This is leading to the creation of more sophisticated digital twin applications, particularly in asset-intensive sectors such as manufacturing, energy and power, and aerospace.
Consumer behavior is evolving towards a greater acceptance and demand for data-driven decision-making, further contributing to the growth of the Digital Twin market. Businesses are recognizing the value of digital twins in gaining a competitive advantage through optimized processes and reduced operational costs. The market size was estimated at xx Million in 2024, and is projected to reach xx Million by 2033.
Key Markets & Segments Leading Digital Twin Market
The Manufacturing segment currently dominates the Digital Twin market, accounting for approximately xx% of the total market share in 2024. This is primarily due to the significant potential for optimizing manufacturing processes, improving product quality, and reducing production costs using digital twins. Other major segments include Energy and Power, Aerospace, Oil & Gas, and Automobile.
- Manufacturing: High adoption is driven by the need for enhanced process optimization, predictive maintenance, and real-time monitoring.
- Energy and Power: Digital twins are increasingly deployed for asset management, grid optimization, and predictive maintenance of power generation infrastructure.
- Aerospace: Applications include aircraft design, testing, and maintenance, improving safety and efficiency.
- Oil and Gas: Optimizing exploration, production, and transportation processes through predictive analysis and improved asset management.
- Automobile: Development, testing, and maintenance of vehicles, enhancing performance and streamlining production.
Other applications, although smaller in current market share, are demonstrating significant growth potential and are expected to gain momentum in the coming years. The strong economic growth and extensive infrastructure development in several regions contribute to the expansion of this market.
Digital Twin Market Product Developments
Recent product innovations include the integration of advanced AI and machine learning algorithms into digital twin platforms, enabling more accurate predictive analytics and improved decision-making capabilities. The increasing use of cloud-based solutions is enhancing accessibility and scalability, while the development of more user-friendly interfaces is simplifying the adoption process. These advancements provide significant competitive edges, enabling businesses to leverage digital twins more effectively to optimize their operations and gain a competitive advantage.
Challenges in the Digital Twin Market Market
Significant challenges hinder the growth of the Digital Twin market. Data security and privacy concerns are paramount, requiring robust security measures and adherence to regulatory compliance. Supply chain disruptions can affect the availability of essential hardware and software components, impacting deployment timelines and costs. Furthermore, the high initial investment cost associated with implementing digital twin solutions can pose a barrier for smaller businesses. These factors collectively contribute to a significant impact on market expansion.
Forces Driving Digital Twin Market Growth
Technological advancements, particularly in AI, IoT, and cloud computing, are primary drivers of market expansion. The increasing need for operational efficiency and reduced costs is fueling adoption across industries. Supportive government regulations and incentives are also fostering growth. For example, the rising demand for sustainable and resilient infrastructure is driving the use of digital twins in various sectors such as construction and energy.
Challenges in the Digital Twin Market Market
Long-term growth is further supported by increasing collaborations and strategic partnerships between technology providers and end-users. Innovation in the digital twin space continues to expand applications into new sectors and use cases. These collaborative efforts and continuous technological advancements solidify the long-term growth trajectory of this promising market.
Emerging Opportunities in Digital Twin Market
Emerging opportunities abound in the Digital Twin market. The integration of digital twins with extended reality (XR) technologies, such as AR/VR, presents a promising avenue for enhancing user interaction and visualization. The expansion into new sectors like healthcare and smart cities offers substantial growth potential. Furthermore, the increasing demand for digital twin-based services creates opportunities for specialized service providers, contributing to market diversification and sustained expansion.
Leading Players in the Digital Twin Market Sector
- Lanner Group Limited (Royal Haskoning DHV)
- SAP S
- IBM Corporation
- Cal-Tek SRL
- Rescale Inc
- Microsoft Corporation
- Cityzenith Inc
- ANSYS Inc
- Mevea Ltd
- General Electric Company
Key Milestones in Digital Twin Market Industry
- February 2023: Prevu3D secured USD 10 Million in Series A funding, accelerating 3D digital twin platform deployment.
- February 2023: RIIICO raised USD 1.5 Million in pre-seed funding, advancing AI-driven digital twin generation in manufacturing.
Strategic Outlook for Digital Twin Market Market
The Digital Twin market presents significant long-term growth potential. Continued technological advancements, increased adoption across various industries, and the emergence of new applications will fuel market expansion. Strategic partnerships, investments in R&D, and a focus on addressing data security and privacy concerns will be crucial for businesses to capitalize on the opportunities presented by this rapidly evolving market.
Digital Twin Market Segmentation
-
1. Application
- 1.1. Manufacturing
- 1.2. Energy and Power
- 1.3. Aerospace
- 1.4. Oil and Gas
- 1.5. Automobile
- 1.6. Others Applications
-
2. Type
- 2.1. Simulation-Based
- 2.2. Data-Driven
- 2.3. Knowledge-Based
Digital Twin Market Segmentation By Geography
-
1. North America
- 1.1. United States
- 1.2. Canada
-
2. Europe
- 2.1. United Kingdom
- 2.2. Germany
- 2.3. France
-
3. Asia
- 3.1. China
- 3.2. Japan
- 3.3. India
- 4. Australia and New Zealand
- 5. Latin America
- 6. Middle East and Africa
Digital Twin Market REPORT HIGHLIGHTS
| Aspects | Details |
|---|---|
| Study Period | 2019-2033 |
| Base Year | 2024 |
| Estimated Year | 2025 |
| Forecast Period | 2025-2033 |
| Historical Period | 2019-2024 |
| Growth Rate | CAGR of 36.94% from 2019-2033 |
| Segmentation |
|
Table of Contents
- 1. Introduction
- 1.1. Research Scope
- 1.2. Market Segmentation
- 1.3. Research Methodology
- 1.4. Definitions and Assumptions
- 2. Executive Summary
- 2.1. Introduction
- 3. Market Dynamics
- 3.1. Introduction
- 3.2. Market Drivers
- 3.2.1. Growth in IoT and Cloud-based Platforms; Surge in Adoption of 3D Printing Technology in the Manufacturing Industry; Objective to Reduce Project Cost
- 3.3. Market Restrains
- 3.3.1. Operational Challenges and High Levels of Competition Leading to Price Pressures for Manufacturers
- 3.4. Market Trends
- 3.4.1. Growth in IoT and Cloud-based Platforms to Drive the Market
- 4. Market Factor Analysis
- 4.1. Porters Five Forces
- 4.2. Supply/Value Chain
- 4.3. PESTEL analysis
- 4.4. Market Entropy
- 4.5. Patent/Trademark Analysis
- 5. Global Digital Twin Market Analysis, Insights and Forecast, 2019-2031
- 5.1. Market Analysis, Insights and Forecast - by Application
- 5.1.1. Manufacturing
- 5.1.2. Energy and Power
- 5.1.3. Aerospace
- 5.1.4. Oil and Gas
- 5.1.5. Automobile
- 5.1.6. Others Applications
- 5.2. Market Analysis, Insights and Forecast - by Type
- 5.2.1. Simulation-Based
- 5.2.2. Data-Driven
- 5.2.3. Knowledge-Based
- 5.3. Market Analysis, Insights and Forecast - by Region
- 5.3.1. North America
- 5.3.2. Europe
- 5.3.3. Asia
- 5.3.4. Australia and New Zealand
- 5.3.5. Latin America
- 5.3.6. Middle East and Africa
- 5.1. Market Analysis, Insights and Forecast - by Application
- 6. North America Digital Twin Market Analysis, Insights and Forecast, 2019-2031
- 6.1. Market Analysis, Insights and Forecast - by Application
- 6.1.1. Manufacturing
- 6.1.2. Energy and Power
- 6.1.3. Aerospace
- 6.1.4. Oil and Gas
- 6.1.5. Automobile
- 6.1.6. Others Applications
- 6.2. Market Analysis, Insights and Forecast - by Type
- 6.2.1. Simulation-Based
- 6.2.2. Data-Driven
- 6.2.3. Knowledge-Based
- 6.1. Market Analysis, Insights and Forecast - by Application
- 7. Europe Digital Twin Market Analysis, Insights and Forecast, 2019-2031
- 7.1. Market Analysis, Insights and Forecast - by Application
- 7.1.1. Manufacturing
- 7.1.2. Energy and Power
- 7.1.3. Aerospace
- 7.1.4. Oil and Gas
- 7.1.5. Automobile
- 7.1.6. Others Applications
- 7.2. Market Analysis, Insights and Forecast - by Type
- 7.2.1. Simulation-Based
- 7.2.2. Data-Driven
- 7.2.3. Knowledge-Based
- 7.1. Market Analysis, Insights and Forecast - by Application
- 8. Asia Digital Twin Market Analysis, Insights and Forecast, 2019-2031
- 8.1. Market Analysis, Insights and Forecast - by Application
- 8.1.1. Manufacturing
- 8.1.2. Energy and Power
- 8.1.3. Aerospace
- 8.1.4. Oil and Gas
- 8.1.5. Automobile
- 8.1.6. Others Applications
- 8.2. Market Analysis, Insights and Forecast - by Type
- 8.2.1. Simulation-Based
- 8.2.2. Data-Driven
- 8.2.3. Knowledge-Based
- 8.1. Market Analysis, Insights and Forecast - by Application
- 9. Australia and New Zealand Digital Twin Market Analysis, Insights and Forecast, 2019-2031
- 9.1. Market Analysis, Insights and Forecast - by Application
- 9.1.1. Manufacturing
- 9.1.2. Energy and Power
- 9.1.3. Aerospace
- 9.1.4. Oil and Gas
- 9.1.5. Automobile
- 9.1.6. Others Applications
- 9.2. Market Analysis, Insights and Forecast - by Type
- 9.2.1. Simulation-Based
- 9.2.2. Data-Driven
- 9.2.3. Knowledge-Based
- 9.1. Market Analysis, Insights and Forecast - by Application
- 10. Latin America Digital Twin Market Analysis, Insights and Forecast, 2019-2031
- 10.1. Market Analysis, Insights and Forecast - by Application
- 10.1.1. Manufacturing
- 10.1.2. Energy and Power
- 10.1.3. Aerospace
- 10.1.4. Oil and Gas
- 10.1.5. Automobile
- 10.1.6. Others Applications
- 10.2. Market Analysis, Insights and Forecast - by Type
- 10.2.1. Simulation-Based
- 10.2.2. Data-Driven
- 10.2.3. Knowledge-Based
- 10.1. Market Analysis, Insights and Forecast - by Application
- 11. Middle East and Africa Digital Twin Market Analysis, Insights and Forecast, 2019-2031
- 11.1. Market Analysis, Insights and Forecast - by Application
- 11.1.1. Manufacturing
- 11.1.2. Energy and Power
- 11.1.3. Aerospace
- 11.1.4. Oil and Gas
- 11.1.5. Automobile
- 11.1.6. Others Applications
- 11.2. Market Analysis, Insights and Forecast - by Type
- 11.2.1. Simulation-Based
- 11.2.2. Data-Driven
- 11.2.3. Knowledge-Based
- 11.1. Market Analysis, Insights and Forecast - by Application
- 12. North America Digital Twin Market Analysis, Insights and Forecast, 2019-2031
- 12.1. Market Analysis, Insights and Forecast - By Country/Sub-region
- 12.1.1 United States
- 12.1.2 Canada
- 12.1.3 Mexico
- 13. Europe Digital Twin Market Analysis, Insights and Forecast, 2019-2031
- 13.1. Market Analysis, Insights and Forecast - By Country/Sub-region
- 13.1.1 Germany
- 13.1.2 United Kingdom
- 13.1.3 France
- 13.1.4 Spain
- 13.1.5 Italy
- 13.1.6 Spain
- 13.1.7 Belgium
- 13.1.8 Netherland
- 13.1.9 Nordics
- 13.1.10 Rest of Europe
- 14. Asia Pacific Digital Twin Market Analysis, Insights and Forecast, 2019-2031
- 14.1. Market Analysis, Insights and Forecast - By Country/Sub-region
- 14.1.1 China
- 14.1.2 Japan
- 14.1.3 India
- 14.1.4 South Korea
- 14.1.5 Southeast Asia
- 14.1.6 Australia
- 14.1.7 Indonesia
- 14.1.8 Phillipes
- 14.1.9 Singapore
- 14.1.10 Thailandc
- 14.1.11 Rest of Asia Pacific
- 15. South America Digital Twin Market Analysis, Insights and Forecast, 2019-2031
- 15.1. Market Analysis, Insights and Forecast - By Country/Sub-region
- 15.1.1 Brazil
- 15.1.2 Argentina
- 15.1.3 Peru
- 15.1.4 Chile
- 15.1.5 Colombia
- 15.1.6 Ecuador
- 15.1.7 Venezuela
- 15.1.8 Rest of South America
- 16. North America Digital Twin Market Analysis, Insights and Forecast, 2019-2031
- 16.1. Market Analysis, Insights and Forecast - By Country/Sub-region
- 16.1.1 United States
- 16.1.2 Canada
- 16.1.3 Mexico
- 17. MEA Digital Twin Market Analysis, Insights and Forecast, 2019-2031
- 17.1. Market Analysis, Insights and Forecast - By Country/Sub-region
- 17.1.1 United Arab Emirates
- 17.1.2 Saudi Arabia
- 17.1.3 South Africa
- 17.1.4 Rest of Middle East and Africa
- 18. Competitive Analysis
- 18.1. Global Market Share Analysis 2024
- 18.2. Company Profiles
- 18.2.1 Lanner Group Limited (Royal Haskoning DHV)
- 18.2.1.1. Overview
- 18.2.1.2. Products
- 18.2.1.3. SWOT Analysis
- 18.2.1.4. Recent Developments
- 18.2.1.5. Financials (Based on Availability)
- 18.2.2 SAP S
- 18.2.2.1. Overview
- 18.2.2.2. Products
- 18.2.2.3. SWOT Analysis
- 18.2.2.4. Recent Developments
- 18.2.2.5. Financials (Based on Availability)
- 18.2.3 IBM Corporation
- 18.2.3.1. Overview
- 18.2.3.2. Products
- 18.2.3.3. SWOT Analysis
- 18.2.3.4. Recent Developments
- 18.2.3.5. Financials (Based on Availability)
- 18.2.4 Cal-Tek SRL
- 18.2.4.1. Overview
- 18.2.4.2. Products
- 18.2.4.3. SWOT Analysis
- 18.2.4.4. Recent Developments
- 18.2.4.5. Financials (Based on Availability)
- 18.2.5 Rescale Inc
- 18.2.5.1. Overview
- 18.2.5.2. Products
- 18.2.5.3. SWOT Analysis
- 18.2.5.4. Recent Developments
- 18.2.5.5. Financials (Based on Availability)
- 18.2.6 Microsoft Corporation
- 18.2.6.1. Overview
- 18.2.6.2. Products
- 18.2.6.3. SWOT Analysis
- 18.2.6.4. Recent Developments
- 18.2.6.5. Financials (Based on Availability)
- 18.2.7 Cityzenith Inc
- 18.2.7.1. Overview
- 18.2.7.2. Products
- 18.2.7.3. SWOT Analysis
- 18.2.7.4. Recent Developments
- 18.2.7.5. Financials (Based on Availability)
- 18.2.8 ANSYS Inc
- 18.2.8.1. Overview
- 18.2.8.2. Products
- 18.2.8.3. SWOT Analysis
- 18.2.8.4. Recent Developments
- 18.2.8.5. Financials (Based on Availability)
- 18.2.9 Mevea Ltd
- 18.2.9.1. Overview
- 18.2.9.2. Products
- 18.2.9.3. SWOT Analysis
- 18.2.9.4. Recent Developments
- 18.2.9.5. Financials (Based on Availability)
- 18.2.10 General Electric Company
- 18.2.10.1. Overview
- 18.2.10.2. Products
- 18.2.10.3. SWOT Analysis
- 18.2.10.4. Recent Developments
- 18.2.10.5. Financials (Based on Availability)
- 18.2.1 Lanner Group Limited (Royal Haskoning DHV)
List of Figures
- Figure 1: Global Digital Twin Market Revenue Breakdown (Million, %) by Region 2024 & 2032
- Figure 2: Global Digital Twin Market Volume Breakdown (K Unit, %) by Region 2024 & 2032
- Figure 3: North America Digital Twin Market Revenue (Million), by Country 2024 & 2032
- Figure 4: North America Digital Twin Market Volume (K Unit), by Country 2024 & 2032
- Figure 5: North America Digital Twin Market Revenue Share (%), by Country 2024 & 2032
- Figure 6: North America Digital Twin Market Volume Share (%), by Country 2024 & 2032
- Figure 7: Europe Digital Twin Market Revenue (Million), by Country 2024 & 2032
- Figure 8: Europe Digital Twin Market Volume (K Unit), by Country 2024 & 2032
- Figure 9: Europe Digital Twin Market Revenue Share (%), by Country 2024 & 2032
- Figure 10: Europe Digital Twin Market Volume Share (%), by Country 2024 & 2032
- Figure 11: Asia Pacific Digital Twin Market Revenue (Million), by Country 2024 & 2032
- Figure 12: Asia Pacific Digital Twin Market Volume (K Unit), by Country 2024 & 2032
- Figure 13: Asia Pacific Digital Twin Market Revenue Share (%), by Country 2024 & 2032
- Figure 14: Asia Pacific Digital Twin Market Volume Share (%), by Country 2024 & 2032
- Figure 15: South America Digital Twin Market Revenue (Million), by Country 2024 & 2032
- Figure 16: South America Digital Twin Market Volume (K Unit), by Country 2024 & 2032
- Figure 17: South America Digital Twin Market Revenue Share (%), by Country 2024 & 2032
- Figure 18: South America Digital Twin Market Volume Share (%), by Country 2024 & 2032
- Figure 19: North America Digital Twin Market Revenue (Million), by Country 2024 & 2032
- Figure 20: North America Digital Twin Market Volume (K Unit), by Country 2024 & 2032
- Figure 21: North America Digital Twin Market Revenue Share (%), by Country 2024 & 2032
- Figure 22: North America Digital Twin Market Volume Share (%), by Country 2024 & 2032
- Figure 23: MEA Digital Twin Market Revenue (Million), by Country 2024 & 2032
- Figure 24: MEA Digital Twin Market Volume (K Unit), by Country 2024 & 2032
- Figure 25: MEA Digital Twin Market Revenue Share (%), by Country 2024 & 2032
- Figure 26: MEA Digital Twin Market Volume Share (%), by Country 2024 & 2032
- Figure 27: North America Digital Twin Market Revenue (Million), by Application 2024 & 2032
- Figure 28: North America Digital Twin Market Volume (K Unit), by Application 2024 & 2032
- Figure 29: North America Digital Twin Market Revenue Share (%), by Application 2024 & 2032
- Figure 30: North America Digital Twin Market Volume Share (%), by Application 2024 & 2032
- Figure 31: North America Digital Twin Market Revenue (Million), by Type 2024 & 2032
- Figure 32: North America Digital Twin Market Volume (K Unit), by Type 2024 & 2032
- Figure 33: North America Digital Twin Market Revenue Share (%), by Type 2024 & 2032
- Figure 34: North America Digital Twin Market Volume Share (%), by Type 2024 & 2032
- Figure 35: North America Digital Twin Market Revenue (Million), by Country 2024 & 2032
- Figure 36: North America Digital Twin Market Volume (K Unit), by Country 2024 & 2032
- Figure 37: North America Digital Twin Market Revenue Share (%), by Country 2024 & 2032
- Figure 38: North America Digital Twin Market Volume Share (%), by Country 2024 & 2032
- Figure 39: Europe Digital Twin Market Revenue (Million), by Application 2024 & 2032
- Figure 40: Europe Digital Twin Market Volume (K Unit), by Application 2024 & 2032
- Figure 41: Europe Digital Twin Market Revenue Share (%), by Application 2024 & 2032
- Figure 42: Europe Digital Twin Market Volume Share (%), by Application 2024 & 2032
- Figure 43: Europe Digital Twin Market Revenue (Million), by Type 2024 & 2032
- Figure 44: Europe Digital Twin Market Volume (K Unit), by Type 2024 & 2032
- Figure 45: Europe Digital Twin Market Revenue Share (%), by Type 2024 & 2032
- Figure 46: Europe Digital Twin Market Volume Share (%), by Type 2024 & 2032
- Figure 47: Europe Digital Twin Market Revenue (Million), by Country 2024 & 2032
- Figure 48: Europe Digital Twin Market Volume (K Unit), by Country 2024 & 2032
- Figure 49: Europe Digital Twin Market Revenue Share (%), by Country 2024 & 2032
- Figure 50: Europe Digital Twin Market Volume Share (%), by Country 2024 & 2032
- Figure 51: Asia Digital Twin Market Revenue (Million), by Application 2024 & 2032
- Figure 52: Asia Digital Twin Market Volume (K Unit), by Application 2024 & 2032
- Figure 53: Asia Digital Twin Market Revenue Share (%), by Application 2024 & 2032
- Figure 54: Asia Digital Twin Market Volume Share (%), by Application 2024 & 2032
- Figure 55: Asia Digital Twin Market Revenue (Million), by Type 2024 & 2032
- Figure 56: Asia Digital Twin Market Volume (K Unit), by Type 2024 & 2032
- Figure 57: Asia Digital Twin Market Revenue Share (%), by Type 2024 & 2032
- Figure 58: Asia Digital Twin Market Volume Share (%), by Type 2024 & 2032
- Figure 59: Asia Digital Twin Market Revenue (Million), by Country 2024 & 2032
- Figure 60: Asia Digital Twin Market Volume (K Unit), by Country 2024 & 2032
- Figure 61: Asia Digital Twin Market Revenue Share (%), by Country 2024 & 2032
- Figure 62: Asia Digital Twin Market Volume Share (%), by Country 2024 & 2032
- Figure 63: Australia and New Zealand Digital Twin Market Revenue (Million), by Application 2024 & 2032
- Figure 64: Australia and New Zealand Digital Twin Market Volume (K Unit), by Application 2024 & 2032
- Figure 65: Australia and New Zealand Digital Twin Market Revenue Share (%), by Application 2024 & 2032
- Figure 66: Australia and New Zealand Digital Twin Market Volume Share (%), by Application 2024 & 2032
- Figure 67: Australia and New Zealand Digital Twin Market Revenue (Million), by Type 2024 & 2032
- Figure 68: Australia and New Zealand Digital Twin Market Volume (K Unit), by Type 2024 & 2032
- Figure 69: Australia and New Zealand Digital Twin Market Revenue Share (%), by Type 2024 & 2032
- Figure 70: Australia and New Zealand Digital Twin Market Volume Share (%), by Type 2024 & 2032
- Figure 71: Australia and New Zealand Digital Twin Market Revenue (Million), by Country 2024 & 2032
- Figure 72: Australia and New Zealand Digital Twin Market Volume (K Unit), by Country 2024 & 2032
- Figure 73: Australia and New Zealand Digital Twin Market Revenue Share (%), by Country 2024 & 2032
- Figure 74: Australia and New Zealand Digital Twin Market Volume Share (%), by Country 2024 & 2032
- Figure 75: Latin America Digital Twin Market Revenue (Million), by Application 2024 & 2032
- Figure 76: Latin America Digital Twin Market Volume (K Unit), by Application 2024 & 2032
- Figure 77: Latin America Digital Twin Market Revenue Share (%), by Application 2024 & 2032
- Figure 78: Latin America Digital Twin Market Volume Share (%), by Application 2024 & 2032
- Figure 79: Latin America Digital Twin Market Revenue (Million), by Type 2024 & 2032
- Figure 80: Latin America Digital Twin Market Volume (K Unit), by Type 2024 & 2032
- Figure 81: Latin America Digital Twin Market Revenue Share (%), by Type 2024 & 2032
- Figure 82: Latin America Digital Twin Market Volume Share (%), by Type 2024 & 2032
- Figure 83: Latin America Digital Twin Market Revenue (Million), by Country 2024 & 2032
- Figure 84: Latin America Digital Twin Market Volume (K Unit), by Country 2024 & 2032
- Figure 85: Latin America Digital Twin Market Revenue Share (%), by Country 2024 & 2032
- Figure 86: Latin America Digital Twin Market Volume Share (%), by Country 2024 & 2032
- Figure 87: Middle East and Africa Digital Twin Market Revenue (Million), by Application 2024 & 2032
- Figure 88: Middle East and Africa Digital Twin Market Volume (K Unit), by Application 2024 & 2032
- Figure 89: Middle East and Africa Digital Twin Market Revenue Share (%), by Application 2024 & 2032
- Figure 90: Middle East and Africa Digital Twin Market Volume Share (%), by Application 2024 & 2032
- Figure 91: Middle East and Africa Digital Twin Market Revenue (Million), by Type 2024 & 2032
- Figure 92: Middle East and Africa Digital Twin Market Volume (K Unit), by Type 2024 & 2032
- Figure 93: Middle East and Africa Digital Twin Market Revenue Share (%), by Type 2024 & 2032
- Figure 94: Middle East and Africa Digital Twin Market Volume Share (%), by Type 2024 & 2032
- Figure 95: Middle East and Africa Digital Twin Market Revenue (Million), by Country 2024 & 2032
- Figure 96: Middle East and Africa Digital Twin Market Volume (K Unit), by Country 2024 & 2032
- Figure 97: Middle East and Africa Digital Twin Market Revenue Share (%), by Country 2024 & 2032
- Figure 98: Middle East and Africa Digital Twin Market Volume Share (%), by Country 2024 & 2032
List of Tables
- Table 1: Global Digital Twin Market Revenue Million Forecast, by Region 2019 & 2032
- Table 2: Global Digital Twin Market Volume K Unit Forecast, by Region 2019 & 2032
- Table 3: Global Digital Twin Market Revenue Million Forecast, by Application 2019 & 2032
- Table 4: Global Digital Twin Market Volume K Unit Forecast, by Application 2019 & 2032
- Table 5: Global Digital Twin Market Revenue Million Forecast, by Type 2019 & 2032
- Table 6: Global Digital Twin Market Volume K Unit Forecast, by Type 2019 & 2032
- Table 7: Global Digital Twin Market Revenue Million Forecast, by Region 2019 & 2032
- Table 8: Global Digital Twin Market Volume K Unit Forecast, by Region 2019 & 2032
- Table 9: Global Digital Twin Market Revenue Million Forecast, by Country 2019 & 2032
- Table 10: Global Digital Twin Market Volume K Unit Forecast, by Country 2019 & 2032
- Table 11: United States Digital Twin Market Revenue (Million) Forecast, by Application 2019 & 2032
- Table 12: United States Digital Twin Market Volume (K Unit) Forecast, by Application 2019 & 2032
- Table 13: Canada Digital Twin Market Revenue (Million) Forecast, by Application 2019 & 2032
- Table 14: Canada Digital Twin Market Volume (K Unit) Forecast, by Application 2019 & 2032
- Table 15: Mexico Digital Twin Market Revenue (Million) Forecast, by Application 2019 & 2032
- Table 16: Mexico Digital Twin Market Volume (K Unit) Forecast, by Application 2019 & 2032
- Table 17: Global Digital Twin Market Revenue Million Forecast, by Country 2019 & 2032
- Table 18: Global Digital Twin Market Volume K Unit Forecast, by Country 2019 & 2032
- Table 19: Germany Digital Twin Market Revenue (Million) Forecast, by Application 2019 & 2032
- Table 20: Germany Digital Twin Market Volume (K Unit) Forecast, by Application 2019 & 2032
- Table 21: United Kingdom Digital Twin Market Revenue (Million) Forecast, by Application 2019 & 2032
- Table 22: United Kingdom Digital Twin Market Volume (K Unit) Forecast, by Application 2019 & 2032
- Table 23: France Digital Twin Market Revenue (Million) Forecast, by Application 2019 & 2032
- Table 24: France Digital Twin Market Volume (K Unit) Forecast, by Application 2019 & 2032
- Table 25: Spain Digital Twin Market Revenue (Million) Forecast, by Application 2019 & 2032
- Table 26: Spain Digital Twin Market Volume (K Unit) Forecast, by Application 2019 & 2032
- Table 27: Italy Digital Twin Market Revenue (Million) Forecast, by Application 2019 & 2032
- Table 28: Italy Digital Twin Market Volume (K Unit) Forecast, by Application 2019 & 2032
- Table 29: Spain Digital Twin Market Revenue (Million) Forecast, by Application 2019 & 2032
- Table 30: Spain Digital Twin Market Volume (K Unit) Forecast, by Application 2019 & 2032
- Table 31: Belgium Digital Twin Market Revenue (Million) Forecast, by Application 2019 & 2032
- Table 32: Belgium Digital Twin Market Volume (K Unit) Forecast, by Application 2019 & 2032
- Table 33: Netherland Digital Twin Market Revenue (Million) Forecast, by Application 2019 & 2032
- Table 34: Netherland Digital Twin Market Volume (K Unit) Forecast, by Application 2019 & 2032
- Table 35: Nordics Digital Twin Market Revenue (Million) Forecast, by Application 2019 & 2032
- Table 36: Nordics Digital Twin Market Volume (K Unit) Forecast, by Application 2019 & 2032
- Table 37: Rest of Europe Digital Twin Market Revenue (Million) Forecast, by Application 2019 & 2032
- Table 38: Rest of Europe Digital Twin Market Volume (K Unit) Forecast, by Application 2019 & 2032
- Table 39: Global Digital Twin Market Revenue Million Forecast, by Country 2019 & 2032
- Table 40: Global Digital Twin Market Volume K Unit Forecast, by Country 2019 & 2032
- Table 41: China Digital Twin Market Revenue (Million) Forecast, by Application 2019 & 2032
- Table 42: China Digital Twin Market Volume (K Unit) Forecast, by Application 2019 & 2032
- Table 43: Japan Digital Twin Market Revenue (Million) Forecast, by Application 2019 & 2032
- Table 44: Japan Digital Twin Market Volume (K Unit) Forecast, by Application 2019 & 2032
- Table 45: India Digital Twin Market Revenue (Million) Forecast, by Application 2019 & 2032
- Table 46: India Digital Twin Market Volume (K Unit) Forecast, by Application 2019 & 2032
- Table 47: South Korea Digital Twin Market Revenue (Million) Forecast, by Application 2019 & 2032
- Table 48: South Korea Digital Twin Market Volume (K Unit) Forecast, by Application 2019 & 2032
- Table 49: Southeast Asia Digital Twin Market Revenue (Million) Forecast, by Application 2019 & 2032
- Table 50: Southeast Asia Digital Twin Market Volume (K Unit) Forecast, by Application 2019 & 2032
- Table 51: Australia Digital Twin Market Revenue (Million) Forecast, by Application 2019 & 2032
- Table 52: Australia Digital Twin Market Volume (K Unit) Forecast, by Application 2019 & 2032
- Table 53: Indonesia Digital Twin Market Revenue (Million) Forecast, by Application 2019 & 2032
- Table 54: Indonesia Digital Twin Market Volume (K Unit) Forecast, by Application 2019 & 2032
- Table 55: Phillipes Digital Twin Market Revenue (Million) Forecast, by Application 2019 & 2032
- Table 56: Phillipes Digital Twin Market Volume (K Unit) Forecast, by Application 2019 & 2032
- Table 57: Singapore Digital Twin Market Revenue (Million) Forecast, by Application 2019 & 2032
- Table 58: Singapore Digital Twin Market Volume (K Unit) Forecast, by Application 2019 & 2032
- Table 59: Thailandc Digital Twin Market Revenue (Million) Forecast, by Application 2019 & 2032
- Table 60: Thailandc Digital Twin Market Volume (K Unit) Forecast, by Application 2019 & 2032
- Table 61: Rest of Asia Pacific Digital Twin Market Revenue (Million) Forecast, by Application 2019 & 2032
- Table 62: Rest of Asia Pacific Digital Twin Market Volume (K Unit) Forecast, by Application 2019 & 2032
- Table 63: Global Digital Twin Market Revenue Million Forecast, by Country 2019 & 2032
- Table 64: Global Digital Twin Market Volume K Unit Forecast, by Country 2019 & 2032
- Table 65: Brazil Digital Twin Market Revenue (Million) Forecast, by Application 2019 & 2032
- Table 66: Brazil Digital Twin Market Volume (K Unit) Forecast, by Application 2019 & 2032
- Table 67: Argentina Digital Twin Market Revenue (Million) Forecast, by Application 2019 & 2032
- Table 68: Argentina Digital Twin Market Volume (K Unit) Forecast, by Application 2019 & 2032
- Table 69: Peru Digital Twin Market Revenue (Million) Forecast, by Application 2019 & 2032
- Table 70: Peru Digital Twin Market Volume (K Unit) Forecast, by Application 2019 & 2032
- Table 71: Chile Digital Twin Market Revenue (Million) Forecast, by Application 2019 & 2032
- Table 72: Chile Digital Twin Market Volume (K Unit) Forecast, by Application 2019 & 2032
- Table 73: Colombia Digital Twin Market Revenue (Million) Forecast, by Application 2019 & 2032
- Table 74: Colombia Digital Twin Market Volume (K Unit) Forecast, by Application 2019 & 2032
- Table 75: Ecuador Digital Twin Market Revenue (Million) Forecast, by Application 2019 & 2032
- Table 76: Ecuador Digital Twin Market Volume (K Unit) Forecast, by Application 2019 & 2032
- Table 77: Venezuela Digital Twin Market Revenue (Million) Forecast, by Application 2019 & 2032
- Table 78: Venezuela Digital Twin Market Volume (K Unit) Forecast, by Application 2019 & 2032
- Table 79: Rest of South America Digital Twin Market Revenue (Million) Forecast, by Application 2019 & 2032
- Table 80: Rest of South America Digital Twin Market Volume (K Unit) Forecast, by Application 2019 & 2032
- Table 81: Global Digital Twin Market Revenue Million Forecast, by Country 2019 & 2032
- Table 82: Global Digital Twin Market Volume K Unit Forecast, by Country 2019 & 2032
- Table 83: United States Digital Twin Market Revenue (Million) Forecast, by Application 2019 & 2032
- Table 84: United States Digital Twin Market Volume (K Unit) Forecast, by Application 2019 & 2032
- Table 85: Canada Digital Twin Market Revenue (Million) Forecast, by Application 2019 & 2032
- Table 86: Canada Digital Twin Market Volume (K Unit) Forecast, by Application 2019 & 2032
- Table 87: Mexico Digital Twin Market Revenue (Million) Forecast, by Application 2019 & 2032
- Table 88: Mexico Digital Twin Market Volume (K Unit) Forecast, by Application 2019 & 2032
- Table 89: Global Digital Twin Market Revenue Million Forecast, by Country 2019 & 2032
- Table 90: Global Digital Twin Market Volume K Unit Forecast, by Country 2019 & 2032
- Table 91: United Arab Emirates Digital Twin Market Revenue (Million) Forecast, by Application 2019 & 2032
- Table 92: United Arab Emirates Digital Twin Market Volume (K Unit) Forecast, by Application 2019 & 2032
- Table 93: Saudi Arabia Digital Twin Market Revenue (Million) Forecast, by Application 2019 & 2032
- Table 94: Saudi Arabia Digital Twin Market Volume (K Unit) Forecast, by Application 2019 & 2032
- Table 95: South Africa Digital Twin Market Revenue (Million) Forecast, by Application 2019 & 2032
- Table 96: South Africa Digital Twin Market Volume (K Unit) Forecast, by Application 2019 & 2032
- Table 97: Rest of Middle East and Africa Digital Twin Market Revenue (Million) Forecast, by Application 2019 & 2032
- Table 98: Rest of Middle East and Africa Digital Twin Market Volume (K Unit) Forecast, by Application 2019 & 2032
- Table 99: Global Digital Twin Market Revenue Million Forecast, by Application 2019 & 2032
- Table 100: Global Digital Twin Market Volume K Unit Forecast, by Application 2019 & 2032
- Table 101: Global Digital Twin Market Revenue Million Forecast, by Type 2019 & 2032
- Table 102: Global Digital Twin Market Volume K Unit Forecast, by Type 2019 & 2032
- Table 103: Global Digital Twin Market Revenue Million Forecast, by Country 2019 & 2032
- Table 104: Global Digital Twin Market Volume K Unit Forecast, by Country 2019 & 2032
- Table 105: United States Digital Twin Market Revenue (Million) Forecast, by Application 2019 & 2032
- Table 106: United States Digital Twin Market Volume (K Unit) Forecast, by Application 2019 & 2032
- Table 107: Canada Digital Twin Market Revenue (Million) Forecast, by Application 2019 & 2032
- Table 108: Canada Digital Twin Market Volume (K Unit) Forecast, by Application 2019 & 2032
- Table 109: Global Digital Twin Market Revenue Million Forecast, by Application 2019 & 2032
- Table 110: Global Digital Twin Market Volume K Unit Forecast, by Application 2019 & 2032
- Table 111: Global Digital Twin Market Revenue Million Forecast, by Type 2019 & 2032
- Table 112: Global Digital Twin Market Volume K Unit Forecast, by Type 2019 & 2032
- Table 113: Global Digital Twin Market Revenue Million Forecast, by Country 2019 & 2032
- Table 114: Global Digital Twin Market Volume K Unit Forecast, by Country 2019 & 2032
- Table 115: United Kingdom Digital Twin Market Revenue (Million) Forecast, by Application 2019 & 2032
- Table 116: United Kingdom Digital Twin Market Volume (K Unit) Forecast, by Application 2019 & 2032
- Table 117: Germany Digital Twin Market Revenue (Million) Forecast, by Application 2019 & 2032
- Table 118: Germany Digital Twin Market Volume (K Unit) Forecast, by Application 2019 & 2032
- Table 119: France Digital Twin Market Revenue (Million) Forecast, by Application 2019 & 2032
- Table 120: France Digital Twin Market Volume (K Unit) Forecast, by Application 2019 & 2032
- Table 121: Global Digital Twin Market Revenue Million Forecast, by Application 2019 & 2032
- Table 122: Global Digital Twin Market Volume K Unit Forecast, by Application 2019 & 2032
- Table 123: Global Digital Twin Market Revenue Million Forecast, by Type 2019 & 2032
- Table 124: Global Digital Twin Market Volume K Unit Forecast, by Type 2019 & 2032
- Table 125: Global Digital Twin Market Revenue Million Forecast, by Country 2019 & 2032
- Table 126: Global Digital Twin Market Volume K Unit Forecast, by Country 2019 & 2032
- Table 127: China Digital Twin Market Revenue (Million) Forecast, by Application 2019 & 2032
- Table 128: China Digital Twin Market Volume (K Unit) Forecast, by Application 2019 & 2032
- Table 129: Japan Digital Twin Market Revenue (Million) Forecast, by Application 2019 & 2032
- Table 130: Japan Digital Twin Market Volume (K Unit) Forecast, by Application 2019 & 2032
- Table 131: India Digital Twin Market Revenue (Million) Forecast, by Application 2019 & 2032
- Table 132: India Digital Twin Market Volume (K Unit) Forecast, by Application 2019 & 2032
- Table 133: Global Digital Twin Market Revenue Million Forecast, by Application 2019 & 2032
- Table 134: Global Digital Twin Market Volume K Unit Forecast, by Application 2019 & 2032
- Table 135: Global Digital Twin Market Revenue Million Forecast, by Type 2019 & 2032
- Table 136: Global Digital Twin Market Volume K Unit Forecast, by Type 2019 & 2032
- Table 137: Global Digital Twin Market Revenue Million Forecast, by Country 2019 & 2032
- Table 138: Global Digital Twin Market Volume K Unit Forecast, by Country 2019 & 2032
- Table 139: Global Digital Twin Market Revenue Million Forecast, by Application 2019 & 2032
- Table 140: Global Digital Twin Market Volume K Unit Forecast, by Application 2019 & 2032
- Table 141: Global Digital Twin Market Revenue Million Forecast, by Type 2019 & 2032
- Table 142: Global Digital Twin Market Volume K Unit Forecast, by Type 2019 & 2032
- Table 143: Global Digital Twin Market Revenue Million Forecast, by Country 2019 & 2032
- Table 144: Global Digital Twin Market Volume K Unit Forecast, by Country 2019 & 2032
- Table 145: Global Digital Twin Market Revenue Million Forecast, by Application 2019 & 2032
- Table 146: Global Digital Twin Market Volume K Unit Forecast, by Application 2019 & 2032
- Table 147: Global Digital Twin Market Revenue Million Forecast, by Type 2019 & 2032
- Table 148: Global Digital Twin Market Volume K Unit Forecast, by Type 2019 & 2032
- Table 149: Global Digital Twin Market Revenue Million Forecast, by Country 2019 & 2032
- Table 150: Global Digital Twin Market Volume K Unit Forecast, by Country 2019 & 2032
Frequently Asked Questions
1. What is the projected Compound Annual Growth Rate (CAGR) of the Digital Twin Market?
The projected CAGR is approximately 36.94%.
2. Which companies are prominent players in the Digital Twin Market?
Key companies in the market include Lanner Group Limited (Royal Haskoning DHV), SAP S, IBM Corporation, Cal-Tek SRL, Rescale Inc, Microsoft Corporation, Cityzenith Inc, ANSYS Inc, Mevea Ltd, General Electric Company.
3. What are the main segments of the Digital Twin Market?
The market segments include Application, Type.
4. Can you provide details about the market size?
The market size is estimated to be USD 26.14 Million as of 2022.
5. What are some drivers contributing to market growth?
Growth in IoT and Cloud-based Platforms; Surge in Adoption of 3D Printing Technology in the Manufacturing Industry; Objective to Reduce Project Cost.
6. What are the notable trends driving market growth?
Growth in IoT and Cloud-based Platforms to Drive the Market.
7. Are there any restraints impacting market growth?
Operational Challenges and High Levels of Competition Leading to Price Pressures for Manufacturers.
8. Can you provide examples of recent developments in the market?
February 2023: Prevu3D, a 3D digital twin technology developer, led a USD 10 million in Series A fundraising round closed by Cycle Capital, a growth-stage climate tech venture capital firm. The deployment of Prevu3D's 3D digital twin platform in industrial contexts could be expanded and accelerated with additional funding.
9. What pricing options are available for accessing the report?
Pricing options include single-user, multi-user, and enterprise licenses priced at USD 4750, USD 5250, and USD 8750 respectively.
10. Is the market size provided in terms of value or volume?
The market size is provided in terms of value, measured in Million and volume, measured in K Unit.
11. Are there any specific market keywords associated with the report?
Yes, the market keyword associated with the report is "Digital Twin Market," which aids in identifying and referencing the specific market segment covered.
12. How do I determine which pricing option suits my needs best?
The pricing options vary based on user requirements and access needs. Individual users may opt for single-user licenses, while businesses requiring broader access may choose multi-user or enterprise licenses for cost-effective access to the report.
13. Are there any additional resources or data provided in the Digital Twin Market report?
While the report offers comprehensive insights, it's advisable to review the specific contents or supplementary materials provided to ascertain if additional resources or data are available.
14. How can I stay updated on further developments or reports in the Digital Twin Market?
To stay informed about further developments, trends, and reports in the Digital Twin Market, consider subscribing to industry newsletters, following relevant companies and organizations, or regularly checking reputable industry news sources and publications.
Methodology
Step 1 - Identification of Relevant Samples Size from Population Database


Step 2 - Approaches for Defining Global Market Size (Value, Volume* & Price*)

Note*: In applicable scenarios
Step 3 - Data Sources
Primary Research
- Web Analytics
- Survey Reports
- Research Institute
- Latest Research Reports
- Opinion Leaders
Secondary Research
- Annual Reports
- White Paper
- Latest Press Release
- Industry Association
- Paid Database
- Investor Presentations

Step 4 - Data Triangulation
Involves using different sources of information in order to increase the validity of a study
These sources are likely to be stakeholders in a program - participants, other researchers, program staff, other community members, and so on.
Then we put all data in single framework & apply various statistical tools to find out the dynamic on the market.
During the analysis stage, feedback from the stakeholder groups would be compared to determine areas of agreement as well as areas of divergence
