

Key Insights
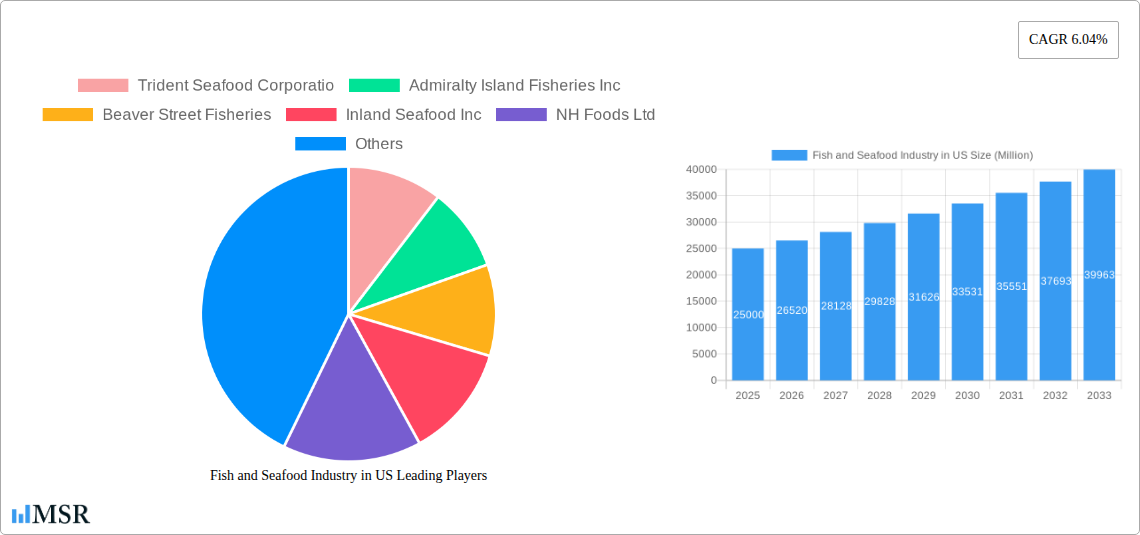
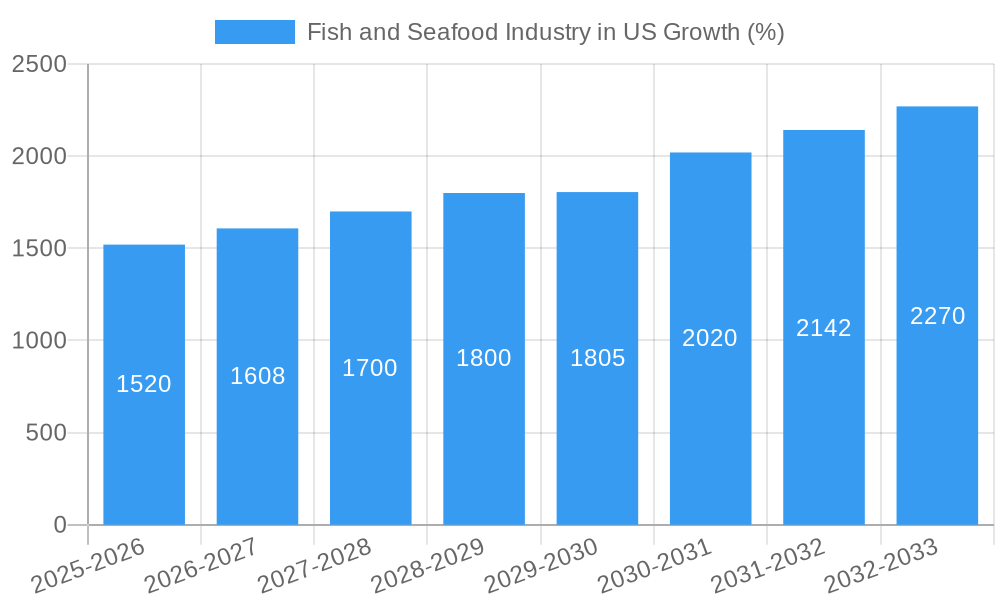
The U.S. fish and seafood market, a significant segment of the global industry, is experiencing robust growth, driven by increasing consumer demand for healthy and sustainable protein sources. The market's value, estimated at $25 billion in 2025, is projected to expand at a Compound Annual Growth Rate (CAGR) of 6.04% from 2025 to 2033. This growth is fueled by several key factors. Firstly, rising consumer awareness of the health benefits associated with seafood consumption, including omega-3 fatty acids and other vital nutrients, is driving increased demand. Secondly, the expanding food service sector, particularly restaurants and catering businesses offering diverse seafood options, contributes significantly to market growth. Trends towards convenient, ready-to-eat meals and innovative seafood product formats further boost sales. While factors such as fluctuating seafood prices and concerns regarding overfishing pose challenges, the market’s overall trajectory remains positive, with a substantial potential for future expansion.
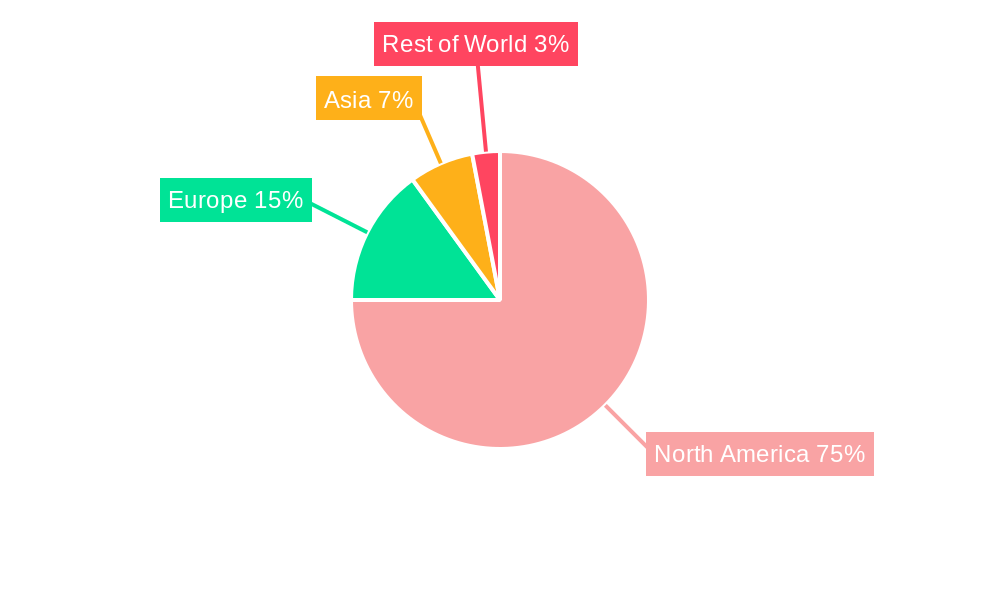
The market segmentation reveals several insights. The frozen segment dominates due to its extended shelf life and convenience. The demand for canned seafood remains strong, particularly amongst budget-conscious consumers. Within distribution channels, the off-trade segment (grocery stores, supermarkets) holds a larger market share than the on-trade (restaurants, bars) segment, though both contribute significantly to total sales. Major players like Trident Seafood, High Liner Foods, and Sysco Corporation are driving innovation and expansion, focusing on product diversification, sustainable sourcing, and supply chain efficiency. Regional data suggests that the North American market, particularly the United States, holds the largest share, driven by high consumption rates and a mature market infrastructure. However, growth opportunities exist in expanding into other regions and tapping into the growing demand for niche seafood products.
Dive Deep into the US Fish and Seafood Industry: A Comprehensive Market Report (2019-2033)
This in-depth report provides a comprehensive analysis of the US fish and seafood industry, covering market dynamics, key segments, leading players, and future growth opportunities. With data spanning the historical period (2019-2024), base year (2025), and forecast period (2025-2033), this report is an essential resource for industry stakeholders, investors, and researchers seeking actionable insights. The report's value is further enhanced by the inclusion of crucial market sizing and CAGR data.
Fish and Seafood Industry in US Market Concentration & Dynamics
The US fish and seafood market exhibits moderate concentration, with several large players dominating specific segments. Market share analysis reveals that the top five companies hold approximately xx% of the market, while smaller, regional players account for the remaining share. This dynamic landscape is characterized by continuous innovation, particularly in sustainable fishing practices and processing technologies. The regulatory framework, including seafood safety regulations and environmental protections, significantly influences market operations. Substitute products, such as plant-based seafood alternatives, present a growing competitive challenge. Evolving consumer preferences, including increasing demand for healthy, sustainably sourced seafood, are reshaping market dynamics. Significant M&A activity, with xx major deals recorded between 2019 and 2024, reflects the industry's ongoing consolidation and strategic expansion efforts.
- Market Share: Top 5 companies: xx%
- M&A Activity (2019-2024): xx deals
- Key Regulatory Factors: FDA regulations, sustainability certifications.
- Substitute Products: Plant-based seafood alternatives.
- Consumer Trends: Demand for sustainability and traceability.
Fish and Seafood Industry in US Industry Insights & Trends
The US fish and seafood market demonstrates robust growth, with a market size of USD xx Million in 2024 and a projected CAGR of xx% from 2025 to 2033, reaching USD xx Million by 2033. This growth is fueled by several key factors including rising consumer disposable incomes, increasing health consciousness (leading to greater seafood consumption), and growing adoption of convenient, processed seafood products. Technological advancements in aquaculture and fishing techniques are boosting efficiency and sustainability. The shift towards e-commerce and online grocery delivery also presents exciting opportunities for market expansion. However, challenges such as fluctuating supply due to overfishing and climate change, and concerns about food safety and traceability, need to be addressed effectively to sustain long-term growth. Furthermore, increasing prices and inflation also pose a threat.
Key Markets & Segments Leading Fish and Seafood Industry in US
The frozen segment holds the largest market share within the US fish and seafood industry, driven by its convenience and extended shelf life. The "Fish" type accounts for a significant proportion of total market volume, while shrimp maintains considerable popularity. The on-trade distribution channel (restaurants and food services) plays a vital role, although the off-trade channel (retail) is also exhibiting considerable growth. Regional variations are significant, with the Western and Eastern coastlines representing crucial markets.
- Dominant Segment: Frozen, Fish, On-Trade
- Key Market Drivers:
- Economic Growth: Increased disposable income
- Consumer Preferences: Health consciousness, convenience
- Technological Advancements: Efficient aquaculture, processing
- Infrastructure: Cold chain logistics
Fish and Seafood Industry in US Product Developments
Recent product innovation focuses on value-added products, convenient formats, and sustainable sourcing. Companies are leveraging advanced processing technologies to enhance product quality, shelf life, and flavor profiles. The introduction of new species, such as the Prized Fish range by Trident Seafood Corporation, reflects efforts to diversify offerings and cater to evolving consumer preferences. Emphasis on traceability and sustainability certification is further enhancing the appeal of premium fish and seafood products.
Challenges in the Fish and Seafood Industry in US Market
The US fish and seafood industry faces several significant challenges. These include fluctuating raw material prices, unpredictable weather patterns impacting supply chains, and intense competition from both domestic and imported seafood. Regulatory compliance requirements for safety and sustainability are costly and complex. Furthermore, increasing concerns about the environmental impact of fishing practices, consumer preference for eco-friendly products and the rise of plant-based alternatives pose further challenges.
Forces Driving Fish and Seafood Industry in US Growth
Several factors propel the growth of the US fish and seafood industry. Advances in aquaculture technology lead to increased production and efficiency. Favorable government regulations promoting sustainable fishing practices and enhancing market accessibility are beneficial. The rising global demand for protein-rich diets is also a critical driver, alongside increasing health awareness and consumer demand for healthy and nutritious seafood options.
Challenges in the Fish and Seafood Industry in US Market
Long-term growth hinges on addressing sustainability concerns, embracing technological innovation, and fostering collaboration across the supply chain. Investments in sustainable aquaculture practices, innovative packaging solutions, and enhanced traceability systems are key to sustaining market momentum and ensuring long-term viability.
Emerging Opportunities in Fish and Seafood Industry in US
Emerging opportunities include the expansion of value-added products, the development of novel and convenient formats like ready-to-eat meals, and the increased focus on sustainability and ethical sourcing. Plant-based alternatives present a challenge but also an opportunity for diversification and innovation in the industry.
Leading Players in the Fish and Seafood Industry in US Sector
- Trident Seafood Corporation
- Admiralty Island Fisheries Inc
- Beaver Street Fisheries
- Inland Seafood Inc
- NH Foods Ltd
- High Liner Foods Inc
- Sysco Corporation
- The Kraft Heinz Company
- Thai Union Group PCL
- Mowi ASA
Key Milestones in Fish and Seafood Industry in US Industry
- May 2023: Trident Seafood Corporation launched a new Prized Fish product range in collaboration with Copper River Prince William Sound Marketing Association.
- April 2023: Inland Seafood opened a new USD 4 Million facility in Jefferson Parish, Louisiana, creating 55 jobs.
- January 2023: Inland Seafood acquired Texas-based Lonestar Seafood, expanding its operations in the Western US.
Strategic Outlook for Fish and Seafood Industry in US Market
The US fish and seafood industry exhibits significant long-term growth potential driven by consumer demand for healthy and sustainable products. Strategic opportunities lie in investing in sustainable aquaculture, developing innovative products, and enhancing supply chain efficiency. Focusing on traceability, transparency, and addressing environmental concerns will be critical for success in this dynamic and evolving market.
Fish and Seafood Industry in US Segmentation
-
1. Type
- 1.1. Fish
- 1.2. Shrimp
- 1.3. Other Seafood
-
2. Form
- 2.1. Canned
- 2.2. Fresh / Chilled
- 2.3. Frozen
- 2.4. Processed
-
3. Distribution Channel
-
3.1. Off-Trade
- 3.1.1. Convenience Stores
- 3.1.2. Online Channel
- 3.1.3. Supermarkets and Hypermarkets
- 3.1.4. Others
- 3.2. On-Trade
-
3.1. Off-Trade
Fish and Seafood Industry in US Segmentation By Geography
-
1. North America
- 1.1. United States
- 1.2. Canada
- 1.3. Mexico
-
2. South America
- 2.1. Brazil
- 2.2. Argentina
- 2.3. Rest of South America
-
3. Europe
- 3.1. United Kingdom
- 3.2. Germany
- 3.3. France
- 3.4. Italy
- 3.5. Spain
- 3.6. Russia
- 3.7. Benelux
- 3.8. Nordics
- 3.9. Rest of Europe
-
4. Middle East & Africa
- 4.1. Turkey
- 4.2. Israel
- 4.3. GCC
- 4.4. North Africa
- 4.5. South Africa
- 4.6. Rest of Middle East & Africa
-
5. Asia Pacific
- 5.1. China
- 5.2. India
- 5.3. Japan
- 5.4. South Korea
- 5.5. ASEAN
- 5.6. Oceania
- 5.7. Rest of Asia Pacific
Fish and Seafood Industry in US REPORT HIGHLIGHTS
| Aspects | Details |
|---|---|
| Study Period | 2019-2033 |
| Base Year | 2024 |
| Estimated Year | 2025 |
| Forecast Period | 2025-2033 |
| Historical Period | 2019-2024 |
| Growth Rate | CAGR of 6.04% from 2019-2033 |
| Segmentation |
|
Table of Contents
- 1. Introduction
- 1.1. Research Scope
- 1.2. Market Segmentation
- 1.3. Research Methodology
- 1.4. Definitions and Assumptions
- 2. Executive Summary
- 2.1. Introduction
- 3. Market Dynamics
- 3.1. Introduction
- 3.2. Market Drivers
- 3.2.1. Increasing Focus on Maintaining Health and Well-Being; Launching Supplements For Specific Purposes and Targeted Population
- 3.3. Market Restrains
- 3.3.1. Supplement Consumption and Their Side-effects; Inclination Towards Substitute Products
- 3.4. Market Trends
- 3.4.1. OTHER KEY INDUSTRY TRENDS COVERED IN THE REPORT
- 4. Market Factor Analysis
- 4.1. Porters Five Forces
- 4.2. Supply/Value Chain
- 4.3. PESTEL analysis
- 4.4. Market Entropy
- 4.5. Patent/Trademark Analysis
- 5. Global Fish and Seafood Industry in US Analysis, Insights and Forecast, 2019-2031
- 5.1. Market Analysis, Insights and Forecast - by Type
- 5.1.1. Fish
- 5.1.2. Shrimp
- 5.1.3. Other Seafood
- 5.2. Market Analysis, Insights and Forecast - by Form
- 5.2.1. Canned
- 5.2.2. Fresh / Chilled
- 5.2.3. Frozen
- 5.2.4. Processed
- 5.3. Market Analysis, Insights and Forecast - by Distribution Channel
- 5.3.1. Off-Trade
- 5.3.1.1. Convenience Stores
- 5.3.1.2. Online Channel
- 5.3.1.3. Supermarkets and Hypermarkets
- 5.3.1.4. Others
- 5.3.2. On-Trade
- 5.3.1. Off-Trade
- 5.4. Market Analysis, Insights and Forecast - by Region
- 5.4.1. North America
- 5.4.2. South America
- 5.4.3. Europe
- 5.4.4. Middle East & Africa
- 5.4.5. Asia Pacific
- 5.1. Market Analysis, Insights and Forecast - by Type
- 6. North America Fish and Seafood Industry in US Analysis, Insights and Forecast, 2019-2031
- 6.1. Market Analysis, Insights and Forecast - by Type
- 6.1.1. Fish
- 6.1.2. Shrimp
- 6.1.3. Other Seafood
- 6.2. Market Analysis, Insights and Forecast - by Form
- 6.2.1. Canned
- 6.2.2. Fresh / Chilled
- 6.2.3. Frozen
- 6.2.4. Processed
- 6.3. Market Analysis, Insights and Forecast - by Distribution Channel
- 6.3.1. Off-Trade
- 6.3.1.1. Convenience Stores
- 6.3.1.2. Online Channel
- 6.3.1.3. Supermarkets and Hypermarkets
- 6.3.1.4. Others
- 6.3.2. On-Trade
- 6.3.1. Off-Trade
- 6.1. Market Analysis, Insights and Forecast - by Type
- 7. South America Fish and Seafood Industry in US Analysis, Insights and Forecast, 2019-2031
- 7.1. Market Analysis, Insights and Forecast - by Type
- 7.1.1. Fish
- 7.1.2. Shrimp
- 7.1.3. Other Seafood
- 7.2. Market Analysis, Insights and Forecast - by Form
- 7.2.1. Canned
- 7.2.2. Fresh / Chilled
- 7.2.3. Frozen
- 7.2.4. Processed
- 7.3. Market Analysis, Insights and Forecast - by Distribution Channel
- 7.3.1. Off-Trade
- 7.3.1.1. Convenience Stores
- 7.3.1.2. Online Channel
- 7.3.1.3. Supermarkets and Hypermarkets
- 7.3.1.4. Others
- 7.3.2. On-Trade
- 7.3.1. Off-Trade
- 7.1. Market Analysis, Insights and Forecast - by Type
- 8. Europe Fish and Seafood Industry in US Analysis, Insights and Forecast, 2019-2031
- 8.1. Market Analysis, Insights and Forecast - by Type
- 8.1.1. Fish
- 8.1.2. Shrimp
- 8.1.3. Other Seafood
- 8.2. Market Analysis, Insights and Forecast - by Form
- 8.2.1. Canned
- 8.2.2. Fresh / Chilled
- 8.2.3. Frozen
- 8.2.4. Processed
- 8.3. Market Analysis, Insights and Forecast - by Distribution Channel
- 8.3.1. Off-Trade
- 8.3.1.1. Convenience Stores
- 8.3.1.2. Online Channel
- 8.3.1.3. Supermarkets and Hypermarkets
- 8.3.1.4. Others
- 8.3.2. On-Trade
- 8.3.1. Off-Trade
- 8.1. Market Analysis, Insights and Forecast - by Type
- 9. Middle East & Africa Fish and Seafood Industry in US Analysis, Insights and Forecast, 2019-2031
- 9.1. Market Analysis, Insights and Forecast - by Type
- 9.1.1. Fish
- 9.1.2. Shrimp
- 9.1.3. Other Seafood
- 9.2. Market Analysis, Insights and Forecast - by Form
- 9.2.1. Canned
- 9.2.2. Fresh / Chilled
- 9.2.3. Frozen
- 9.2.4. Processed
- 9.3. Market Analysis, Insights and Forecast - by Distribution Channel
- 9.3.1. Off-Trade
- 9.3.1.1. Convenience Stores
- 9.3.1.2. Online Channel
- 9.3.1.3. Supermarkets and Hypermarkets
- 9.3.1.4. Others
- 9.3.2. On-Trade
- 9.3.1. Off-Trade
- 9.1. Market Analysis, Insights and Forecast - by Type
- 10. Asia Pacific Fish and Seafood Industry in US Analysis, Insights and Forecast, 2019-2031
- 10.1. Market Analysis, Insights and Forecast - by Type
- 10.1.1. Fish
- 10.1.2. Shrimp
- 10.1.3. Other Seafood
- 10.2. Market Analysis, Insights and Forecast - by Form
- 10.2.1. Canned
- 10.2.2. Fresh / Chilled
- 10.2.3. Frozen
- 10.2.4. Processed
- 10.3. Market Analysis, Insights and Forecast - by Distribution Channel
- 10.3.1. Off-Trade
- 10.3.1.1. Convenience Stores
- 10.3.1.2. Online Channel
- 10.3.1.3. Supermarkets and Hypermarkets
- 10.3.1.4. Others
- 10.3.2. On-Trade
- 10.3.1. Off-Trade
- 10.1. Market Analysis, Insights and Forecast - by Type
- 11. United States Fish and Seafood Industry in US Analysis, Insights and Forecast, 2019-2031
- 12. Canada Fish and Seafood Industry in US Analysis, Insights and Forecast, 2019-2031
- 13. Mexico Fish and Seafood Industry in US Analysis, Insights and Forecast, 2019-2031
- 14. Rest of North America Fish and Seafood Industry in US Analysis, Insights and Forecast, 2019-2031
- 15. Competitive Analysis
- 15.1. Global Market Share Analysis 2024
- 15.2. Company Profiles
- 15.2.1 Trident Seafood Corporatio
- 15.2.1.1. Overview
- 15.2.1.2. Products
- 15.2.1.3. SWOT Analysis
- 15.2.1.4. Recent Developments
- 15.2.1.5. Financials (Based on Availability)
- 15.2.2 Admiralty Island Fisheries Inc
- 15.2.2.1. Overview
- 15.2.2.2. Products
- 15.2.2.3. SWOT Analysis
- 15.2.2.4. Recent Developments
- 15.2.2.5. Financials (Based on Availability)
- 15.2.3 Beaver Street Fisheries
- 15.2.3.1. Overview
- 15.2.3.2. Products
- 15.2.3.3. SWOT Analysis
- 15.2.3.4. Recent Developments
- 15.2.3.5. Financials (Based on Availability)
- 15.2.4 Inland Seafood Inc
- 15.2.4.1. Overview
- 15.2.4.2. Products
- 15.2.4.3. SWOT Analysis
- 15.2.4.4. Recent Developments
- 15.2.4.5. Financials (Based on Availability)
- 15.2.5 NH Foods Ltd
- 15.2.5.1. Overview
- 15.2.5.2. Products
- 15.2.5.3. SWOT Analysis
- 15.2.5.4. Recent Developments
- 15.2.5.5. Financials (Based on Availability)
- 15.2.6 High Liner Foods Inc
- 15.2.6.1. Overview
- 15.2.6.2. Products
- 15.2.6.3. SWOT Analysis
- 15.2.6.4. Recent Developments
- 15.2.6.5. Financials (Based on Availability)
- 15.2.7 Sysco Corporation
- 15.2.7.1. Overview
- 15.2.7.2. Products
- 15.2.7.3. SWOT Analysis
- 15.2.7.4. Recent Developments
- 15.2.7.5. Financials (Based on Availability)
- 15.2.8 The Kraft Heinz Company
- 15.2.8.1. Overview
- 15.2.8.2. Products
- 15.2.8.3. SWOT Analysis
- 15.2.8.4. Recent Developments
- 15.2.8.5. Financials (Based on Availability)
- 15.2.9 Thai Union Group PCL
- 15.2.9.1. Overview
- 15.2.9.2. Products
- 15.2.9.3. SWOT Analysis
- 15.2.9.4. Recent Developments
- 15.2.9.5. Financials (Based on Availability)
- 15.2.10 Mowi ASA
- 15.2.10.1. Overview
- 15.2.10.2. Products
- 15.2.10.3. SWOT Analysis
- 15.2.10.4. Recent Developments
- 15.2.10.5. Financials (Based on Availability)
- 15.2.1 Trident Seafood Corporatio
List of Figures
- Figure 1: Global Fish and Seafood Industry in US Revenue Breakdown (Million, %) by Region 2024 & 2032
- Figure 2: North America Fish and Seafood Industry in US Revenue (Million), by Country 2024 & 2032
- Figure 3: North America Fish and Seafood Industry in US Revenue Share (%), by Country 2024 & 2032
- Figure 4: North America Fish and Seafood Industry in US Revenue (Million), by Type 2024 & 2032
- Figure 5: North America Fish and Seafood Industry in US Revenue Share (%), by Type 2024 & 2032
- Figure 6: North America Fish and Seafood Industry in US Revenue (Million), by Form 2024 & 2032
- Figure 7: North America Fish and Seafood Industry in US Revenue Share (%), by Form 2024 & 2032
- Figure 8: North America Fish and Seafood Industry in US Revenue (Million), by Distribution Channel 2024 & 2032
- Figure 9: North America Fish and Seafood Industry in US Revenue Share (%), by Distribution Channel 2024 & 2032
- Figure 10: North America Fish and Seafood Industry in US Revenue (Million), by Country 2024 & 2032
- Figure 11: North America Fish and Seafood Industry in US Revenue Share (%), by Country 2024 & 2032
- Figure 12: South America Fish and Seafood Industry in US Revenue (Million), by Type 2024 & 2032
- Figure 13: South America Fish and Seafood Industry in US Revenue Share (%), by Type 2024 & 2032
- Figure 14: South America Fish and Seafood Industry in US Revenue (Million), by Form 2024 & 2032
- Figure 15: South America Fish and Seafood Industry in US Revenue Share (%), by Form 2024 & 2032
- Figure 16: South America Fish and Seafood Industry in US Revenue (Million), by Distribution Channel 2024 & 2032
- Figure 17: South America Fish and Seafood Industry in US Revenue Share (%), by Distribution Channel 2024 & 2032
- Figure 18: South America Fish and Seafood Industry in US Revenue (Million), by Country 2024 & 2032
- Figure 19: South America Fish and Seafood Industry in US Revenue Share (%), by Country 2024 & 2032
- Figure 20: Europe Fish and Seafood Industry in US Revenue (Million), by Type 2024 & 2032
- Figure 21: Europe Fish and Seafood Industry in US Revenue Share (%), by Type 2024 & 2032
- Figure 22: Europe Fish and Seafood Industry in US Revenue (Million), by Form 2024 & 2032
- Figure 23: Europe Fish and Seafood Industry in US Revenue Share (%), by Form 2024 & 2032
- Figure 24: Europe Fish and Seafood Industry in US Revenue (Million), by Distribution Channel 2024 & 2032
- Figure 25: Europe Fish and Seafood Industry in US Revenue Share (%), by Distribution Channel 2024 & 2032
- Figure 26: Europe Fish and Seafood Industry in US Revenue (Million), by Country 2024 & 2032
- Figure 27: Europe Fish and Seafood Industry in US Revenue Share (%), by Country 2024 & 2032
- Figure 28: Middle East & Africa Fish and Seafood Industry in US Revenue (Million), by Type 2024 & 2032
- Figure 29: Middle East & Africa Fish and Seafood Industry in US Revenue Share (%), by Type 2024 & 2032
- Figure 30: Middle East & Africa Fish and Seafood Industry in US Revenue (Million), by Form 2024 & 2032
- Figure 31: Middle East & Africa Fish and Seafood Industry in US Revenue Share (%), by Form 2024 & 2032
- Figure 32: Middle East & Africa Fish and Seafood Industry in US Revenue (Million), by Distribution Channel 2024 & 2032
- Figure 33: Middle East & Africa Fish and Seafood Industry in US Revenue Share (%), by Distribution Channel 2024 & 2032
- Figure 34: Middle East & Africa Fish and Seafood Industry in US Revenue (Million), by Country 2024 & 2032
- Figure 35: Middle East & Africa Fish and Seafood Industry in US Revenue Share (%), by Country 2024 & 2032
- Figure 36: Asia Pacific Fish and Seafood Industry in US Revenue (Million), by Type 2024 & 2032
- Figure 37: Asia Pacific Fish and Seafood Industry in US Revenue Share (%), by Type 2024 & 2032
- Figure 38: Asia Pacific Fish and Seafood Industry in US Revenue (Million), by Form 2024 & 2032
- Figure 39: Asia Pacific Fish and Seafood Industry in US Revenue Share (%), by Form 2024 & 2032
- Figure 40: Asia Pacific Fish and Seafood Industry in US Revenue (Million), by Distribution Channel 2024 & 2032
- Figure 41: Asia Pacific Fish and Seafood Industry in US Revenue Share (%), by Distribution Channel 2024 & 2032
- Figure 42: Asia Pacific Fish and Seafood Industry in US Revenue (Million), by Country 2024 & 2032
- Figure 43: Asia Pacific Fish and Seafood Industry in US Revenue Share (%), by Country 2024 & 2032
List of Tables
- Table 1: Global Fish and Seafood Industry in US Revenue Million Forecast, by Region 2019 & 2032
- Table 2: Global Fish and Seafood Industry in US Revenue Million Forecast, by Type 2019 & 2032
- Table 3: Global Fish and Seafood Industry in US Revenue Million Forecast, by Form 2019 & 2032
- Table 4: Global Fish and Seafood Industry in US Revenue Million Forecast, by Distribution Channel 2019 & 2032
- Table 5: Global Fish and Seafood Industry in US Revenue Million Forecast, by Region 2019 & 2032
- Table 6: Global Fish and Seafood Industry in US Revenue Million Forecast, by Country 2019 & 2032
- Table 7: United States Fish and Seafood Industry in US Revenue (Million) Forecast, by Application 2019 & 2032
- Table 8: Canada Fish and Seafood Industry in US Revenue (Million) Forecast, by Application 2019 & 2032
- Table 9: Mexico Fish and Seafood Industry in US Revenue (Million) Forecast, by Application 2019 & 2032
- Table 10: Rest of North America Fish and Seafood Industry in US Revenue (Million) Forecast, by Application 2019 & 2032
- Table 11: Global Fish and Seafood Industry in US Revenue Million Forecast, by Type 2019 & 2032
- Table 12: Global Fish and Seafood Industry in US Revenue Million Forecast, by Form 2019 & 2032
- Table 13: Global Fish and Seafood Industry in US Revenue Million Forecast, by Distribution Channel 2019 & 2032
- Table 14: Global Fish and Seafood Industry in US Revenue Million Forecast, by Country 2019 & 2032
- Table 15: United States Fish and Seafood Industry in US Revenue (Million) Forecast, by Application 2019 & 2032
- Table 16: Canada Fish and Seafood Industry in US Revenue (Million) Forecast, by Application 2019 & 2032
- Table 17: Mexico Fish and Seafood Industry in US Revenue (Million) Forecast, by Application 2019 & 2032
- Table 18: Global Fish and Seafood Industry in US Revenue Million Forecast, by Type 2019 & 2032
- Table 19: Global Fish and Seafood Industry in US Revenue Million Forecast, by Form 2019 & 2032
- Table 20: Global Fish and Seafood Industry in US Revenue Million Forecast, by Distribution Channel 2019 & 2032
- Table 21: Global Fish and Seafood Industry in US Revenue Million Forecast, by Country 2019 & 2032
- Table 22: Brazil Fish and Seafood Industry in US Revenue (Million) Forecast, by Application 2019 & 2032
- Table 23: Argentina Fish and Seafood Industry in US Revenue (Million) Forecast, by Application 2019 & 2032
- Table 24: Rest of South America Fish and Seafood Industry in US Revenue (Million) Forecast, by Application 2019 & 2032
- Table 25: Global Fish and Seafood Industry in US Revenue Million Forecast, by Type 2019 & 2032
- Table 26: Global Fish and Seafood Industry in US Revenue Million Forecast, by Form 2019 & 2032
- Table 27: Global Fish and Seafood Industry in US Revenue Million Forecast, by Distribution Channel 2019 & 2032
- Table 28: Global Fish and Seafood Industry in US Revenue Million Forecast, by Country 2019 & 2032
- Table 29: United Kingdom Fish and Seafood Industry in US Revenue (Million) Forecast, by Application 2019 & 2032
- Table 30: Germany Fish and Seafood Industry in US Revenue (Million) Forecast, by Application 2019 & 2032
- Table 31: France Fish and Seafood Industry in US Revenue (Million) Forecast, by Application 2019 & 2032
- Table 32: Italy Fish and Seafood Industry in US Revenue (Million) Forecast, by Application 2019 & 2032
- Table 33: Spain Fish and Seafood Industry in US Revenue (Million) Forecast, by Application 2019 & 2032
- Table 34: Russia Fish and Seafood Industry in US Revenue (Million) Forecast, by Application 2019 & 2032
- Table 35: Benelux Fish and Seafood Industry in US Revenue (Million) Forecast, by Application 2019 & 2032
- Table 36: Nordics Fish and Seafood Industry in US Revenue (Million) Forecast, by Application 2019 & 2032
- Table 37: Rest of Europe Fish and Seafood Industry in US Revenue (Million) Forecast, by Application 2019 & 2032
- Table 38: Global Fish and Seafood Industry in US Revenue Million Forecast, by Type 2019 & 2032
- Table 39: Global Fish and Seafood Industry in US Revenue Million Forecast, by Form 2019 & 2032
- Table 40: Global Fish and Seafood Industry in US Revenue Million Forecast, by Distribution Channel 2019 & 2032
- Table 41: Global Fish and Seafood Industry in US Revenue Million Forecast, by Country 2019 & 2032
- Table 42: Turkey Fish and Seafood Industry in US Revenue (Million) Forecast, by Application 2019 & 2032
- Table 43: Israel Fish and Seafood Industry in US Revenue (Million) Forecast, by Application 2019 & 2032
- Table 44: GCC Fish and Seafood Industry in US Revenue (Million) Forecast, by Application 2019 & 2032
- Table 45: North Africa Fish and Seafood Industry in US Revenue (Million) Forecast, by Application 2019 & 2032
- Table 46: South Africa Fish and Seafood Industry in US Revenue (Million) Forecast, by Application 2019 & 2032
- Table 47: Rest of Middle East & Africa Fish and Seafood Industry in US Revenue (Million) Forecast, by Application 2019 & 2032
- Table 48: Global Fish and Seafood Industry in US Revenue Million Forecast, by Type 2019 & 2032
- Table 49: Global Fish and Seafood Industry in US Revenue Million Forecast, by Form 2019 & 2032
- Table 50: Global Fish and Seafood Industry in US Revenue Million Forecast, by Distribution Channel 2019 & 2032
- Table 51: Global Fish and Seafood Industry in US Revenue Million Forecast, by Country 2019 & 2032
- Table 52: China Fish and Seafood Industry in US Revenue (Million) Forecast, by Application 2019 & 2032
- Table 53: India Fish and Seafood Industry in US Revenue (Million) Forecast, by Application 2019 & 2032
- Table 54: Japan Fish and Seafood Industry in US Revenue (Million) Forecast, by Application 2019 & 2032
- Table 55: South Korea Fish and Seafood Industry in US Revenue (Million) Forecast, by Application 2019 & 2032
- Table 56: ASEAN Fish and Seafood Industry in US Revenue (Million) Forecast, by Application 2019 & 2032
- Table 57: Oceania Fish and Seafood Industry in US Revenue (Million) Forecast, by Application 2019 & 2032
- Table 58: Rest of Asia Pacific Fish and Seafood Industry in US Revenue (Million) Forecast, by Application 2019 & 2032
Frequently Asked Questions
1. What is the projected Compound Annual Growth Rate (CAGR) of the Fish and Seafood Industry in US?
The projected CAGR is approximately 6.04%.
2. Which companies are prominent players in the Fish and Seafood Industry in US?
Key companies in the market include Trident Seafood Corporatio, Admiralty Island Fisheries Inc, Beaver Street Fisheries, Inland Seafood Inc, NH Foods Ltd, High Liner Foods Inc, Sysco Corporation, The Kraft Heinz Company, Thai Union Group PCL, Mowi ASA.
3. What are the main segments of the Fish and Seafood Industry in US?
The market segments include Type, Form, Distribution Channel.
4. Can you provide details about the market size?
The market size is estimated to be USD XX Million as of 2022.
5. What are some drivers contributing to market growth?
Increasing Focus on Maintaining Health and Well-Being; Launching Supplements For Specific Purposes and Targeted Population.
6. What are the notable trends driving market growth?
OTHER KEY INDUSTRY TRENDS COVERED IN THE REPORT.
7. Are there any restraints impacting market growth?
Supplement Consumption and Their Side-effects; Inclination Towards Substitute Products.
8. Can you provide examples of recent developments in the market?
May 2023: Trident Seafood Corporation has collaborated with Copper River Prince William Sound Marketing Association to introduce new Prized Fish product range in the United Staes Market.April 2023: Inland Seafood opened a new facility of its own in Jefferson Parish. They invested approximately USD 4 million in order to purchase and renovate a 14,000-square-foot facility in Elmwood, bringing 55 jobs to Jefferson Parish.January 2023: In order to expand their operations in the western part of the United States Inland Seafood acquired Texas-based Lonestar Seafood. The Texas-based supplier is famous for the quality of lobsters they supply.
9. What pricing options are available for accessing the report?
Pricing options include single-user, multi-user, and enterprise licenses priced at USD 3800, USD 4500, and USD 5800 respectively.
10. Is the market size provided in terms of value or volume?
The market size is provided in terms of value, measured in Million.
11. Are there any specific market keywords associated with the report?
Yes, the market keyword associated with the report is "Fish and Seafood Industry in US," which aids in identifying and referencing the specific market segment covered.
12. How do I determine which pricing option suits my needs best?
The pricing options vary based on user requirements and access needs. Individual users may opt for single-user licenses, while businesses requiring broader access may choose multi-user or enterprise licenses for cost-effective access to the report.
13. Are there any additional resources or data provided in the Fish and Seafood Industry in US report?
While the report offers comprehensive insights, it's advisable to review the specific contents or supplementary materials provided to ascertain if additional resources or data are available.
14. How can I stay updated on further developments or reports in the Fish and Seafood Industry in US?
To stay informed about further developments, trends, and reports in the Fish and Seafood Industry in US, consider subscribing to industry newsletters, following relevant companies and organizations, or regularly checking reputable industry news sources and publications.
Methodology
Step 1 - Identification of Relevant Samples Size from Population Database


Step 2 - Approaches for Defining Global Market Size (Value, Volume* & Price*)

Note*: In applicable scenarios
Step 3 - Data Sources
Primary Research
- Web Analytics
- Survey Reports
- Research Institute
- Latest Research Reports
- Opinion Leaders
Secondary Research
- Annual Reports
- White Paper
- Latest Press Release
- Industry Association
- Paid Database
- Investor Presentations

Step 4 - Data Triangulation
Involves using different sources of information in order to increase the validity of a study
These sources are likely to be stakeholders in a program - participants, other researchers, program staff, other community members, and so on.
Then we put all data in single framework & apply various statistical tools to find out the dynamic on the market.
During the analysis stage, feedback from the stakeholder groups would be compared to determine areas of agreement as well as areas of divergence
