

Key Insights
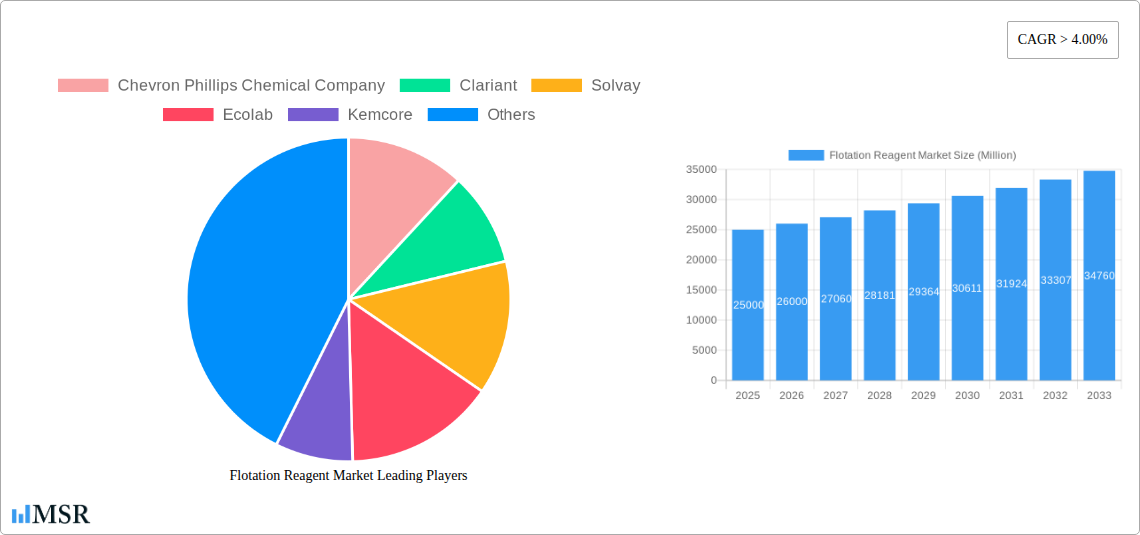
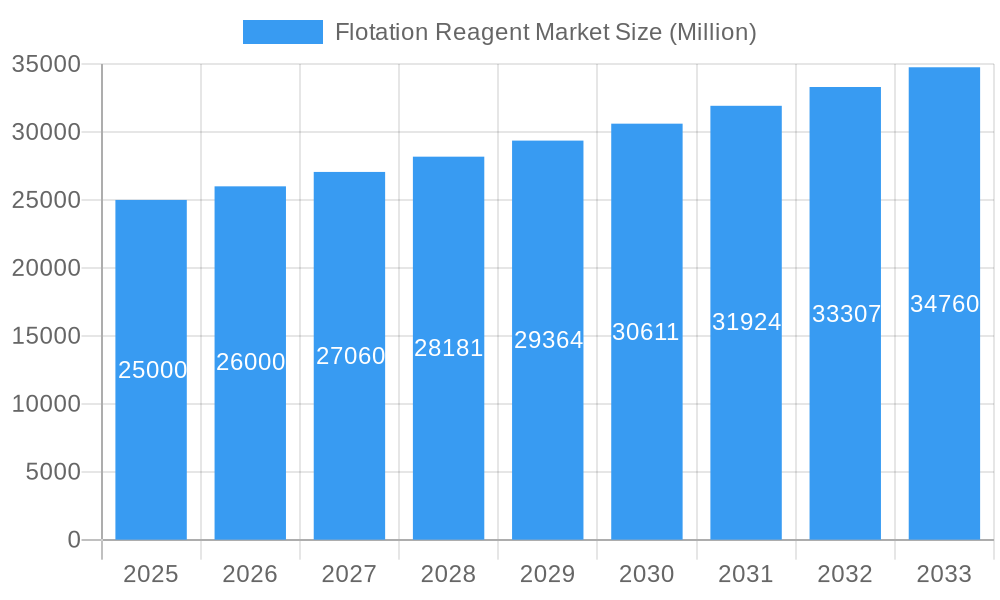
The global flotation reagent market, valued at approximately $6 billion in 2025, is projected to achieve robust expansion, forecasting a Compound Annual Growth Rate (CAGR) of 4.2% from 2025 to 2033. This growth is propelled by the expanding mining and mineral processing sectors, especially within rapidly developing economies. Increased demand for essential minerals and metals, driven by global infrastructure development and technological innovation, directly fuels the need for efficient mineral extraction reliant on flotation reagents. Furthermore, a growing emphasis on sustainable mining practices and advanced water treatment solutions is significantly contributing to market demand. The water and wastewater treatment sector also represents a substantial opportunity, as flotation reagents are vital for pollutant removal and water quality enhancement.
Flotation Reagent Market Market Size (In Billion)
Conversely, market growth may be influenced by certain factors. Volatility in commodity prices, particularly for base metals, can impact reagent demand. Stringent environmental regulations and escalating compliance costs present challenges for manufacturers. The potential emergence of alternative mineral separation technologies also poses a long-term restraint. Despite these challenges, market segmentation reveals key opportunities. The collectors segment is anticipated to lead market share due to its integral role in the flotation process. Geographically, the Asia-Pacific region is poised for significant growth, driven by expanding mining activities and infrastructure projects. Leading market participants, including Chevron Phillips Chemical Company, Clariant, Solvay, and BASF SE, are strategically leveraging technological advancements, strategic partnerships, and geographical expansion to capitalize on these emerging trends.
Flotation Reagent Market Company Market Share
Flotation Reagent Market: A Comprehensive Analysis (2019-2033)
This in-depth report provides a comprehensive analysis of the global Flotation Reagent market, offering invaluable insights for industry stakeholders, investors, and strategic decision-makers. The study covers the period 2019-2033, with a focus on the 2025-2033 forecast period. Key market segments including Collectors, Frothers, Dispersants, and Flocculants across applications like Mineral Processing, Water & Wastewater Treatment, and Explosives & Drilling are meticulously examined. Leading players such as Chevron Phillips Chemical Company, Clariant, Solvay, Ecolab, Kemcore, BASF SE, Kemira, ArrMaz, IXOM, and Evonik are profiled, highlighting their market strategies and competitive landscapes.
The report leverages extensive primary and secondary research to present a granular view of market dynamics, trends, and growth opportunities. It features detailed market sizing, CAGR projections, and in-depth analysis of key factors influencing market growth. Download this report now to gain a competitive edge and make informed business decisions.
Flotation Reagent Market Concentration & Dynamics
The global flotation reagent market exhibits a moderately concentrated landscape, with several major players holding significant market share. The market share of the top five companies is estimated at xx%, indicating a competitive yet consolidated structure. Innovation plays a crucial role, with companies investing heavily in R&D to develop more efficient and environmentally friendly reagents. Regulatory frameworks, particularly concerning environmental protection, significantly impact market dynamics, driving demand for sustainable solutions. Substitute products, while limited, pose a competitive challenge. End-user trends toward automation and optimization of mineral processing operations are shaping market demand. The market has witnessed a moderate level of M&A activity in recent years, with approximately xx mergers and acquisitions recorded between 2019 and 2024.
- Market Share: Top 5 companies: xx%
- M&A Activity (2019-2024): xx deals
- Key Innovation Areas: Improved selectivity, reduced environmental impact, enhanced performance in challenging conditions.
- Regulatory Focus: Environmental regulations (e.g., discharge limits), safety standards.
Flotation Reagent Market Industry Insights & Trends
The global flotation reagent market is experiencing robust growth, driven by the increasing demand for minerals and metals across various industries. The market size in 2025 is estimated at $xx Million, exhibiting a CAGR of xx% during the forecast period (2025-2033). Technological advancements, including the development of novel reagent formulations with enhanced selectivity and efficiency, are fueling market expansion. Evolving consumer preferences toward environmentally sustainable solutions are creating new opportunities for manufacturers of green reagents. Growth is further supported by rising investments in mining and infrastructure projects globally. However, fluctuating raw material prices and economic downturns present potential challenges to market growth.
Key Markets & Segments Leading Flotation Reagent Market
The mineral processing application segment dominates the flotation reagent market, accounting for approximately xx% of the total market value in 2025. The strong growth of this segment is fueled by the increasing demand for metals and minerals in construction, automotive, and electronics industries. Geographically, the Asia-Pacific region holds the largest market share, driven by robust economic growth, significant mining activities, and expanding infrastructure projects.
Dominant Region: Asia-Pacific
Dominant Application: Mineral Processing
Dominant Type: Collectors
Drivers for Mineral Processing Segment:
- High demand for base and precious metals
- Expansion of mining activities in developing economies
- Investments in advanced mineral processing technologies
Drivers for Asia-Pacific Region:
- Rapid industrialization and urbanization
- Growing investments in infrastructure development
- Significant mining activities in countries like China, Australia, and Indonesia.
Flotation Reagent Market Product Developments
Significant advancements in flotation reagent technology focus on improving selectivity, efficiency, and environmental sustainability. New formulations are being developed to enhance recovery rates of target minerals while minimizing the consumption of reagents and reducing environmental impact. Nanotechnology-based reagents are emerging as a promising area, offering improved performance and reduced environmental footprint. These innovations create a competitive edge for manufacturers, allowing them to cater to the growing demand for more sustainable and effective solutions.
Challenges in the Flotation Reagent Market
The flotation reagent market faces several challenges, including stringent environmental regulations that necessitate the development of environmentally friendly reagents, increasing raw material prices impacting production costs, and intense competition among major players, leading to pricing pressure. Supply chain disruptions can also significantly affect production and delivery timelines, impacting overall market stability. The cumulative impact of these challenges may lead to xx% reduction in market growth in the short-term.
Forces Driving Flotation Reagent Market Growth
Several factors drive the growth of the flotation reagent market. Technological advancements in reagent formulations lead to improved efficiency and selectivity, while the rising demand for minerals and metals from various industries fuels consumption. Favorable government policies and investments in mining and infrastructure projects further boost market expansion. Furthermore, the increasing focus on sustainable mining practices and environmentally friendly reagents creates a compelling opportunity for market growth.
Long-Term Growth Catalysts in Flotation Reagent Market
Long-term growth in the flotation reagent market will be propelled by continuous innovation in reagent technology, leading to more effective and environmentally friendly solutions. Strategic partnerships and collaborations between reagent manufacturers and mining companies are expected to drive market growth. Expansion into new markets and applications will further contribute to the overall growth trajectory.
Emerging Opportunities in Flotation Reagent Market
Emerging opportunities in the flotation reagent market include the development of specialized reagents for processing complex ores and unconventional deposits. The growing adoption of digital technologies in the mining industry opens doors for smart reagents and predictive maintenance solutions. Additionally, exploring new markets, especially in developing economies, represents a significant growth opportunity. Increased focus on circular economy principles and resource recovery presents promising avenues for innovative reagent applications.
Key Milestones in Flotation Reagent Market Industry
- 2020: Clariant launched a new range of environmentally friendly flotation reagents.
- 2021: BASF SE invested in R&D for advanced reagent formulations.
- 2022: A major merger between two smaller reagent manufacturers reshaped the competitive landscape.
- 2023: Several companies introduced new digital solutions for optimizing reagent usage.
- 2024: Increased regulatory scrutiny led to stricter environmental standards for reagent production.
Strategic Outlook for Flotation Reagent Market
The flotation reagent market holds immense potential for growth, driven by technological innovations, expanding mining activities, and the growing emphasis on sustainable practices. Companies that invest in R&D, prioritize environmental sustainability, and strategically expand into new markets will be well-positioned to capture a significant share of this rapidly evolving market. The long-term outlook is positive, with continued growth anticipated throughout the forecast period.
Flotation Reagent Market Segmentation
-
1. Type
- 1.1. Collectors
- 1.2. Frothers
- 1.3. Dispersants
- 1.4. Flocculants
- 1.5. Others
-
2. Application
- 2.1. Explosives & Drilling
- 2.2. Mineral Processing
- 2.3. Water & Wastewater Treatment
- 2.4. Others
Flotation Reagent Market Segmentation By Geography
-
1. Asia Pacific
- 1.1. China
- 1.2. India
- 1.3. Japan
- 1.4. South Korea
- 1.5. Rest of Asia Pacific
-
2. North America
- 2.1. United States
- 2.2. Canada
- 2.3. Mexico
-
3. Europe
- 3.1. Germany
- 3.2. United Kingdom
- 3.3. France
- 3.4. Italy
- 3.5. Rest of Europe
-
4. South America
- 4.1. Brazil
- 4.2. Argentina
- 4.3. Rest of South America
-
5. Middle East and Africa
- 5.1. Saudi Arabia
- 5.2. South Africa
- 5.3. Rest of Middle East and Africa
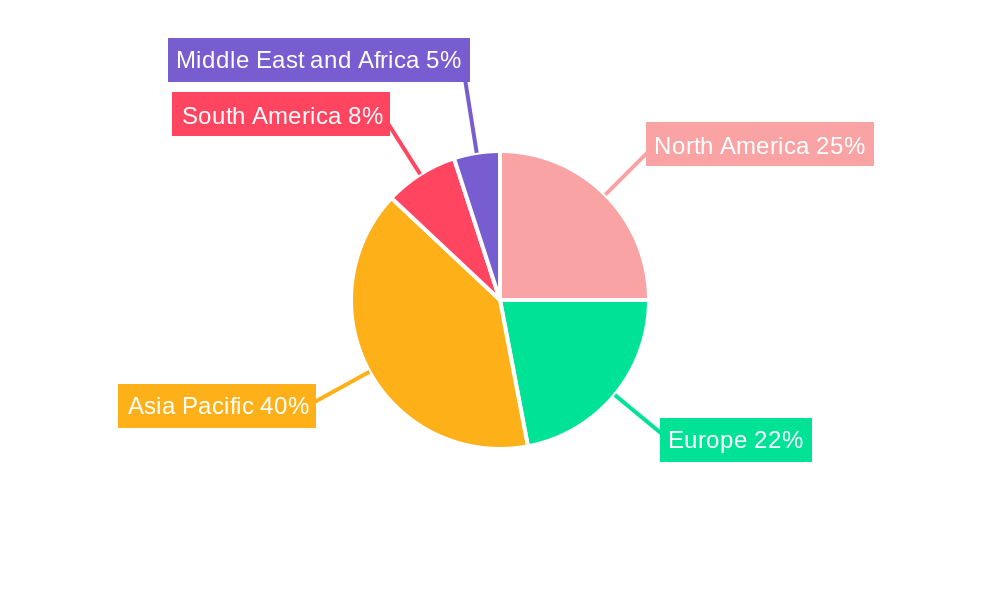
Flotation Reagent Market Regional Market Share
Geographic Coverage of Flotation Reagent Market
Flotation Reagent Market REPORT HIGHLIGHTS
| Aspects | Details |
|---|---|
| Study Period | 2020-2034 |
| Base Year | 2025 |
| Estimated Year | 2026 |
| Forecast Period | 2026-2034 |
| Historical Period | 2020-2025 |
| Growth Rate | CAGR of 4.2% from 2020-2034 |
| Segmentation |
|
Table of Contents
- 1. Introduction
- 1.1. Research Scope
- 1.2. Market Segmentation
- 1.3. Research Objective
- 1.4. Definitions and Assumptions
- 2. Executive Summary
- 2.1. Market Snapshot
- 3. Market Dynamics
- 3.1. Market Drivers
- 3.2. Market Restrains
- 3.3. Market Trends
- 3.4. Market Opportunities
- 4. Market Factor Analysis
- 4.1. Porters Five Forces
- 4.1.1. Bargaining Power of Suppliers
- 4.1.2. Bargaining Power of Buyers
- 4.1.3. Threat of New Entrants
- 4.1.4. Threat of Substitutes
- 4.1.5. Competitive Rivalry
- 4.2. PESTEL analysis
- 4.3. BCG Analysis
- 4.3.1. Stars (High Growth, High Market Share)
- 4.3.2. Cash Cows (Low Growth, High Market Share)
- 4.3.3. Question Mark (High Growth, Low Market Share)
- 4.3.4. Dogs (Low Growth, Low Market Share)
- 4.4. Ansoff Matrix Analysis
- 4.5. Supply Chain Analysis
- 4.6. Regulatory Landscape
- 4.7. Current Market Potential and Opportunity Assessment (TAM–SAM–SOM Framework)
- 4.8. MSR Analyst Note
- 4.1. Porters Five Forces
- 5. Market Analysis, Insights and Forecast 2021-2033
- 5.1. Market Analysis, Insights and Forecast - by Type
- 5.1.1. Collectors
- 5.1.2. Frothers
- 5.1.3. Dispersants
- 5.1.4. Flocculants
- 5.1.5. Others
- 5.2. Market Analysis, Insights and Forecast - by Application
- 5.2.1. Explosives & Drilling
- 5.2.2. Mineral Processing
- 5.2.3. Water & Wastewater Treatment
- 5.2.4. Others
- 5.3. Market Analysis, Insights and Forecast - by Region
- 5.3.1. Asia Pacific
- 5.3.2. North America
- 5.3.3. Europe
- 5.3.4. South America
- 5.3.5. Middle East and Africa
- 5.1. Market Analysis, Insights and Forecast - by Type
- 6. Global Flotation Reagent Market Analysis, Insights and Forecast, 2021-2033
- 6.1. Market Analysis, Insights and Forecast - by Type
- 6.1.1. Collectors
- 6.1.2. Frothers
- 6.1.3. Dispersants
- 6.1.4. Flocculants
- 6.1.5. Others
- 6.2. Market Analysis, Insights and Forecast - by Application
- 6.2.1. Explosives & Drilling
- 6.2.2. Mineral Processing
- 6.2.3. Water & Wastewater Treatment
- 6.2.4. Others
- 6.1. Market Analysis, Insights and Forecast - by Type
- 7. Asia Pacific Flotation Reagent Market Analysis, Insights and Forecast, 2020-2032
- 7.1. Market Analysis, Insights and Forecast - by Type
- 7.1.1. Collectors
- 7.1.2. Frothers
- 7.1.3. Dispersants
- 7.1.4. Flocculants
- 7.1.5. Others
- 7.2. Market Analysis, Insights and Forecast - by Application
- 7.2.1. Explosives & Drilling
- 7.2.2. Mineral Processing
- 7.2.3. Water & Wastewater Treatment
- 7.2.4. Others
- 7.1. Market Analysis, Insights and Forecast - by Type
- 8. North America Flotation Reagent Market Analysis, Insights and Forecast, 2020-2032
- 8.1. Market Analysis, Insights and Forecast - by Type
- 8.1.1. Collectors
- 8.1.2. Frothers
- 8.1.3. Dispersants
- 8.1.4. Flocculants
- 8.1.5. Others
- 8.2. Market Analysis, Insights and Forecast - by Application
- 8.2.1. Explosives & Drilling
- 8.2.2. Mineral Processing
- 8.2.3. Water & Wastewater Treatment
- 8.2.4. Others
- 8.1. Market Analysis, Insights and Forecast - by Type
- 9. Europe Flotation Reagent Market Analysis, Insights and Forecast, 2020-2032
- 9.1. Market Analysis, Insights and Forecast - by Type
- 9.1.1. Collectors
- 9.1.2. Frothers
- 9.1.3. Dispersants
- 9.1.4. Flocculants
- 9.1.5. Others
- 9.2. Market Analysis, Insights and Forecast - by Application
- 9.2.1. Explosives & Drilling
- 9.2.2. Mineral Processing
- 9.2.3. Water & Wastewater Treatment
- 9.2.4. Others
- 9.1. Market Analysis, Insights and Forecast - by Type
- 10. South America Flotation Reagent Market Analysis, Insights and Forecast, 2020-2032
- 10.1. Market Analysis, Insights and Forecast - by Type
- 10.1.1. Collectors
- 10.1.2. Frothers
- 10.1.3. Dispersants
- 10.1.4. Flocculants
- 10.1.5. Others
- 10.2. Market Analysis, Insights and Forecast - by Application
- 10.2.1. Explosives & Drilling
- 10.2.2. Mineral Processing
- 10.2.3. Water & Wastewater Treatment
- 10.2.4. Others
- 10.1. Market Analysis, Insights and Forecast - by Type
- 11. Middle East and Africa Flotation Reagent Market Analysis, Insights and Forecast, 2020-2032
- 11.1. Market Analysis, Insights and Forecast - by Type
- 11.1.1. Collectors
- 11.1.2. Frothers
- 11.1.3. Dispersants
- 11.1.4. Flocculants
- 11.1.5. Others
- 11.2. Market Analysis, Insights and Forecast - by Application
- 11.2.1. Explosives & Drilling
- 11.2.2. Mineral Processing
- 11.2.3. Water & Wastewater Treatment
- 11.2.4. Others
- 11.1. Market Analysis, Insights and Forecast - by Type
- 12. Competitive Analysis
- 12.1. Company Profiles
- 12.1.1 Chevron Phillips Chemical Company
- 12.1.1.1. Company Overview
- 12.1.1.2. Products
- 12.1.1.3. Company Financials
- 12.1.1.4. SWOT Analysis
- 12.1.2 Clariant
- 12.1.2.1. Company Overview
- 12.1.2.2. Products
- 12.1.2.3. Company Financials
- 12.1.2.4. SWOT Analysis
- 12.1.3 Solvay
- 12.1.3.1. Company Overview
- 12.1.3.2. Products
- 12.1.3.3. Company Financials
- 12.1.3.4. SWOT Analysis
- 12.1.4 Ecolab
- 12.1.4.1. Company Overview
- 12.1.4.2. Products
- 12.1.4.3. Company Financials
- 12.1.4.4. SWOT Analysis
- 12.1.5 Kemcore
- 12.1.5.1. Company Overview
- 12.1.5.2. Products
- 12.1.5.3. Company Financials
- 12.1.5.4. SWOT Analysis
- 12.1.6 BASF SE
- 12.1.6.1. Company Overview
- 12.1.6.2. Products
- 12.1.6.3. Company Financials
- 12.1.6.4. SWOT Analysis
- 12.1.7 Kemira
- 12.1.7.1. Company Overview
- 12.1.7.2. Products
- 12.1.7.3. Company Financials
- 12.1.7.4. SWOT Analysis
- 12.1.8 ArrMaz
- 12.1.8.1. Company Overview
- 12.1.8.2. Products
- 12.1.8.3. Company Financials
- 12.1.8.4. SWOT Analysis
- 12.1.9 IXOM
- 12.1.9.1. Company Overview
- 12.1.9.2. Products
- 12.1.9.3. Company Financials
- 12.1.9.4. SWOT Analysis
- 12.1.10 Evonik
- 12.1.10.1. Company Overview
- 12.1.10.2. Products
- 12.1.10.3. Company Financials
- 12.1.10.4. SWOT Analysis
- 12.1.1 Chevron Phillips Chemical Company
- 12.2. Market Entropy
- 12.2.1 Company's Key Areas Served
- 12.2.2 Recent Developments
- 12.3. Company Market Share Analysis 2025
- 12.3.1 Top 5 Companies Market Share Analysis
- 12.3.2 Top 3 Companies Market Share Analysis
- 12.4. List of Potential Customers
- 13. Research Methodology
List of Figures
- Figure 1: Global Flotation Reagent Market Revenue Breakdown (billion, %) by Region 2025 & 2033
- Figure 2: Global Flotation Reagent Market Volume Breakdown (K Tons, %) by Region 2025 & 2033
- Figure 3: Asia Pacific Flotation Reagent Market Revenue (billion), by Type 2025 & 2033
- Figure 4: Asia Pacific Flotation Reagent Market Volume (K Tons), by Type 2025 & 2033
- Figure 5: Asia Pacific Flotation Reagent Market Revenue Share (%), by Type 2025 & 2033
- Figure 6: Asia Pacific Flotation Reagent Market Volume Share (%), by Type 2025 & 2033
- Figure 7: Asia Pacific Flotation Reagent Market Revenue (billion), by Application 2025 & 2033
- Figure 8: Asia Pacific Flotation Reagent Market Volume (K Tons), by Application 2025 & 2033
- Figure 9: Asia Pacific Flotation Reagent Market Revenue Share (%), by Application 2025 & 2033
- Figure 10: Asia Pacific Flotation Reagent Market Volume Share (%), by Application 2025 & 2033
- Figure 11: Asia Pacific Flotation Reagent Market Revenue (billion), by Country 2025 & 2033
- Figure 12: Asia Pacific Flotation Reagent Market Volume (K Tons), by Country 2025 & 2033
- Figure 13: Asia Pacific Flotation Reagent Market Revenue Share (%), by Country 2025 & 2033
- Figure 14: Asia Pacific Flotation Reagent Market Volume Share (%), by Country 2025 & 2033
- Figure 15: North America Flotation Reagent Market Revenue (billion), by Type 2025 & 2033
- Figure 16: North America Flotation Reagent Market Volume (K Tons), by Type 2025 & 2033
- Figure 17: North America Flotation Reagent Market Revenue Share (%), by Type 2025 & 2033
- Figure 18: North America Flotation Reagent Market Volume Share (%), by Type 2025 & 2033
- Figure 19: North America Flotation Reagent Market Revenue (billion), by Application 2025 & 2033
- Figure 20: North America Flotation Reagent Market Volume (K Tons), by Application 2025 & 2033
- Figure 21: North America Flotation Reagent Market Revenue Share (%), by Application 2025 & 2033
- Figure 22: North America Flotation Reagent Market Volume Share (%), by Application 2025 & 2033
- Figure 23: North America Flotation Reagent Market Revenue (billion), by Country 2025 & 2033
- Figure 24: North America Flotation Reagent Market Volume (K Tons), by Country 2025 & 2033
- Figure 25: North America Flotation Reagent Market Revenue Share (%), by Country 2025 & 2033
- Figure 26: North America Flotation Reagent Market Volume Share (%), by Country 2025 & 2033
- Figure 27: Europe Flotation Reagent Market Revenue (billion), by Type 2025 & 2033
- Figure 28: Europe Flotation Reagent Market Volume (K Tons), by Type 2025 & 2033
- Figure 29: Europe Flotation Reagent Market Revenue Share (%), by Type 2025 & 2033
- Figure 30: Europe Flotation Reagent Market Volume Share (%), by Type 2025 & 2033
- Figure 31: Europe Flotation Reagent Market Revenue (billion), by Application 2025 & 2033
- Figure 32: Europe Flotation Reagent Market Volume (K Tons), by Application 2025 & 2033
- Figure 33: Europe Flotation Reagent Market Revenue Share (%), by Application 2025 & 2033
- Figure 34: Europe Flotation Reagent Market Volume Share (%), by Application 2025 & 2033
- Figure 35: Europe Flotation Reagent Market Revenue (billion), by Country 2025 & 2033
- Figure 36: Europe Flotation Reagent Market Volume (K Tons), by Country 2025 & 2033
- Figure 37: Europe Flotation Reagent Market Revenue Share (%), by Country 2025 & 2033
- Figure 38: Europe Flotation Reagent Market Volume Share (%), by Country 2025 & 2033
- Figure 39: South America Flotation Reagent Market Revenue (billion), by Type 2025 & 2033
- Figure 40: South America Flotation Reagent Market Volume (K Tons), by Type 2025 & 2033
- Figure 41: South America Flotation Reagent Market Revenue Share (%), by Type 2025 & 2033
- Figure 42: South America Flotation Reagent Market Volume Share (%), by Type 2025 & 2033
- Figure 43: South America Flotation Reagent Market Revenue (billion), by Application 2025 & 2033
- Figure 44: South America Flotation Reagent Market Volume (K Tons), by Application 2025 & 2033
- Figure 45: South America Flotation Reagent Market Revenue Share (%), by Application 2025 & 2033
- Figure 46: South America Flotation Reagent Market Volume Share (%), by Application 2025 & 2033
- Figure 47: South America Flotation Reagent Market Revenue (billion), by Country 2025 & 2033
- Figure 48: South America Flotation Reagent Market Volume (K Tons), by Country 2025 & 2033
- Figure 49: South America Flotation Reagent Market Revenue Share (%), by Country 2025 & 2033
- Figure 50: South America Flotation Reagent Market Volume Share (%), by Country 2025 & 2033
- Figure 51: Middle East and Africa Flotation Reagent Market Revenue (billion), by Type 2025 & 2033
- Figure 52: Middle East and Africa Flotation Reagent Market Volume (K Tons), by Type 2025 & 2033
- Figure 53: Middle East and Africa Flotation Reagent Market Revenue Share (%), by Type 2025 & 2033
- Figure 54: Middle East and Africa Flotation Reagent Market Volume Share (%), by Type 2025 & 2033
- Figure 55: Middle East and Africa Flotation Reagent Market Revenue (billion), by Application 2025 & 2033
- Figure 56: Middle East and Africa Flotation Reagent Market Volume (K Tons), by Application 2025 & 2033
- Figure 57: Middle East and Africa Flotation Reagent Market Revenue Share (%), by Application 2025 & 2033
- Figure 58: Middle East and Africa Flotation Reagent Market Volume Share (%), by Application 2025 & 2033
- Figure 59: Middle East and Africa Flotation Reagent Market Revenue (billion), by Country 2025 & 2033
- Figure 60: Middle East and Africa Flotation Reagent Market Volume (K Tons), by Country 2025 & 2033
- Figure 61: Middle East and Africa Flotation Reagent Market Revenue Share (%), by Country 2025 & 2033
- Figure 62: Middle East and Africa Flotation Reagent Market Volume Share (%), by Country 2025 & 2033
List of Tables
- Table 1: Global Flotation Reagent Market Revenue billion Forecast, by Type 2020 & 2033
- Table 2: Global Flotation Reagent Market Volume K Tons Forecast, by Type 2020 & 2033
- Table 3: Global Flotation Reagent Market Revenue billion Forecast, by Application 2020 & 2033
- Table 4: Global Flotation Reagent Market Volume K Tons Forecast, by Application 2020 & 2033
- Table 5: Global Flotation Reagent Market Revenue billion Forecast, by Region 2020 & 2033
- Table 6: Global Flotation Reagent Market Volume K Tons Forecast, by Region 2020 & 2033
- Table 7: Global Flotation Reagent Market Revenue billion Forecast, by Type 2020 & 2033
- Table 8: Global Flotation Reagent Market Volume K Tons Forecast, by Type 2020 & 2033
- Table 9: Global Flotation Reagent Market Revenue billion Forecast, by Application 2020 & 2033
- Table 10: Global Flotation Reagent Market Volume K Tons Forecast, by Application 2020 & 2033
- Table 11: Global Flotation Reagent Market Revenue billion Forecast, by Country 2020 & 2033
- Table 12: Global Flotation Reagent Market Volume K Tons Forecast, by Country 2020 & 2033
- Table 13: China Flotation Reagent Market Revenue (billion) Forecast, by Application 2020 & 2033
- Table 14: China Flotation Reagent Market Volume (K Tons) Forecast, by Application 2020 & 2033
- Table 15: India Flotation Reagent Market Revenue (billion) Forecast, by Application 2020 & 2033
- Table 16: India Flotation Reagent Market Volume (K Tons) Forecast, by Application 2020 & 2033
- Table 17: Japan Flotation Reagent Market Revenue (billion) Forecast, by Application 2020 & 2033
- Table 18: Japan Flotation Reagent Market Volume (K Tons) Forecast, by Application 2020 & 2033
- Table 19: South Korea Flotation Reagent Market Revenue (billion) Forecast, by Application 2020 & 2033
- Table 20: South Korea Flotation Reagent Market Volume (K Tons) Forecast, by Application 2020 & 2033
- Table 21: Rest of Asia Pacific Flotation Reagent Market Revenue (billion) Forecast, by Application 2020 & 2033
- Table 22: Rest of Asia Pacific Flotation Reagent Market Volume (K Tons) Forecast, by Application 2020 & 2033
- Table 23: Global Flotation Reagent Market Revenue billion Forecast, by Type 2020 & 2033
- Table 24: Global Flotation Reagent Market Volume K Tons Forecast, by Type 2020 & 2033
- Table 25: Global Flotation Reagent Market Revenue billion Forecast, by Application 2020 & 2033
- Table 26: Global Flotation Reagent Market Volume K Tons Forecast, by Application 2020 & 2033
- Table 27: Global Flotation Reagent Market Revenue billion Forecast, by Country 2020 & 2033
- Table 28: Global Flotation Reagent Market Volume K Tons Forecast, by Country 2020 & 2033
- Table 29: United States Flotation Reagent Market Revenue (billion) Forecast, by Application 2020 & 2033
- Table 30: United States Flotation Reagent Market Volume (K Tons) Forecast, by Application 2020 & 2033
- Table 31: Canada Flotation Reagent Market Revenue (billion) Forecast, by Application 2020 & 2033
- Table 32: Canada Flotation Reagent Market Volume (K Tons) Forecast, by Application 2020 & 2033
- Table 33: Mexico Flotation Reagent Market Revenue (billion) Forecast, by Application 2020 & 2033
- Table 34: Mexico Flotation Reagent Market Volume (K Tons) Forecast, by Application 2020 & 2033
- Table 35: Global Flotation Reagent Market Revenue billion Forecast, by Type 2020 & 2033
- Table 36: Global Flotation Reagent Market Volume K Tons Forecast, by Type 2020 & 2033
- Table 37: Global Flotation Reagent Market Revenue billion Forecast, by Application 2020 & 2033
- Table 38: Global Flotation Reagent Market Volume K Tons Forecast, by Application 2020 & 2033
- Table 39: Global Flotation Reagent Market Revenue billion Forecast, by Country 2020 & 2033
- Table 40: Global Flotation Reagent Market Volume K Tons Forecast, by Country 2020 & 2033
- Table 41: Germany Flotation Reagent Market Revenue (billion) Forecast, by Application 2020 & 2033
- Table 42: Germany Flotation Reagent Market Volume (K Tons) Forecast, by Application 2020 & 2033
- Table 43: United Kingdom Flotation Reagent Market Revenue (billion) Forecast, by Application 2020 & 2033
- Table 44: United Kingdom Flotation Reagent Market Volume (K Tons) Forecast, by Application 2020 & 2033
- Table 45: France Flotation Reagent Market Revenue (billion) Forecast, by Application 2020 & 2033
- Table 46: France Flotation Reagent Market Volume (K Tons) Forecast, by Application 2020 & 2033
- Table 47: Italy Flotation Reagent Market Revenue (billion) Forecast, by Application 2020 & 2033
- Table 48: Italy Flotation Reagent Market Volume (K Tons) Forecast, by Application 2020 & 2033
- Table 49: Rest of Europe Flotation Reagent Market Revenue (billion) Forecast, by Application 2020 & 2033
- Table 50: Rest of Europe Flotation Reagent Market Volume (K Tons) Forecast, by Application 2020 & 2033
- Table 51: Global Flotation Reagent Market Revenue billion Forecast, by Type 2020 & 2033
- Table 52: Global Flotation Reagent Market Volume K Tons Forecast, by Type 2020 & 2033
- Table 53: Global Flotation Reagent Market Revenue billion Forecast, by Application 2020 & 2033
- Table 54: Global Flotation Reagent Market Volume K Tons Forecast, by Application 2020 & 2033
- Table 55: Global Flotation Reagent Market Revenue billion Forecast, by Country 2020 & 2033
- Table 56: Global Flotation Reagent Market Volume K Tons Forecast, by Country 2020 & 2033
- Table 57: Brazil Flotation Reagent Market Revenue (billion) Forecast, by Application 2020 & 2033
- Table 58: Brazil Flotation Reagent Market Volume (K Tons) Forecast, by Application 2020 & 2033
- Table 59: Argentina Flotation Reagent Market Revenue (billion) Forecast, by Application 2020 & 2033
- Table 60: Argentina Flotation Reagent Market Volume (K Tons) Forecast, by Application 2020 & 2033
- Table 61: Rest of South America Flotation Reagent Market Revenue (billion) Forecast, by Application 2020 & 2033
- Table 62: Rest of South America Flotation Reagent Market Volume (K Tons) Forecast, by Application 2020 & 2033
- Table 63: Global Flotation Reagent Market Revenue billion Forecast, by Type 2020 & 2033
- Table 64: Global Flotation Reagent Market Volume K Tons Forecast, by Type 2020 & 2033
- Table 65: Global Flotation Reagent Market Revenue billion Forecast, by Application 2020 & 2033
- Table 66: Global Flotation Reagent Market Volume K Tons Forecast, by Application 2020 & 2033
- Table 67: Global Flotation Reagent Market Revenue billion Forecast, by Country 2020 & 2033
- Table 68: Global Flotation Reagent Market Volume K Tons Forecast, by Country 2020 & 2033
- Table 69: Saudi Arabia Flotation Reagent Market Revenue (billion) Forecast, by Application 2020 & 2033
- Table 70: Saudi Arabia Flotation Reagent Market Volume (K Tons) Forecast, by Application 2020 & 2033
- Table 71: South Africa Flotation Reagent Market Revenue (billion) Forecast, by Application 2020 & 2033
- Table 72: South Africa Flotation Reagent Market Volume (K Tons) Forecast, by Application 2020 & 2033
- Table 73: Rest of Middle East and Africa Flotation Reagent Market Revenue (billion) Forecast, by Application 2020 & 2033
- Table 74: Rest of Middle East and Africa Flotation Reagent Market Volume (K Tons) Forecast, by Application 2020 & 2033
Frequently Asked Questions
1. What is the projected Compound Annual Growth Rate (CAGR) of the Flotation Reagent Market?
The projected CAGR is approximately 4.2%.
2. Which companies are prominent players in the Flotation Reagent Market?
Key companies in the market include Chevron Phillips Chemical Company, Clariant, Solvay, Ecolab, Kemcore, BASF SE, Kemira, ArrMaz, IXOM, Evonik.
3. What are the main segments of the Flotation Reagent Market?
The market segments include Type, Application.
4. Can you provide details about the market size?
The market size is estimated to be USD 6 billion as of 2022.
5. What are some drivers contributing to market growth?
; Growing Demand from Water & Wastewater Treatment Industry 4.1.2 increasing applications in Mining Industry.
6. What are the notable trends driving market growth?
Water & Wastewater Treatment Segment to Uplift Flotation Reagent Market.
7. Are there any restraints impacting market growth?
; Unfavourable Conditions due to COVID-19 Outbreak; Other Restraints.
8. Can you provide examples of recent developments in the market?
N/A
9. What pricing options are available for accessing the report?
Pricing options include single-user, multi-user, and enterprise licenses priced at USD 4750, USD 5250, and USD 8750 respectively.
10. Is the market size provided in terms of value or volume?
The market size is provided in terms of value, measured in billion and volume, measured in K Tons.
11. Are there any specific market keywords associated with the report?
Yes, the market keyword associated with the report is "Flotation Reagent Market," which aids in identifying and referencing the specific market segment covered.
12. How do I determine which pricing option suits my needs best?
The pricing options vary based on user requirements and access needs. Individual users may opt for single-user licenses, while businesses requiring broader access may choose multi-user or enterprise licenses for cost-effective access to the report.
13. Are there any additional resources or data provided in the Flotation Reagent Market report?
While the report offers comprehensive insights, it's advisable to review the specific contents or supplementary materials provided to ascertain if additional resources or data are available.
14. How can I stay updated on further developments or reports in the Flotation Reagent Market?
To stay informed about further developments, trends, and reports in the Flotation Reagent Market, consider subscribing to industry newsletters, following relevant companies and organizations, or regularly checking reputable industry news sources and publications.
Methodology
Step 1 - Identification of Relevant Samples Size from Population Database


Step 2 - Approaches for Defining Global Market Size (Value, Volume* & Price*)

Note*: In applicable scenarios
Step 3 - Data Sources
Primary Research
- Web Analytics
- Survey Reports
- Research Institute
- Latest Research Reports
- Opinion Leaders
Secondary Research
- Annual Reports
- White Paper
- Latest Press Release
- Industry Association
- Paid Database
- Investor Presentations

Step 4 - Data Triangulation
Involves using different sources of information in order to increase the validity of a study
These sources are likely to be stakeholders in a program - participants, other researchers, program staff, other community members, and so on.
Then we put all data in single framework & apply various statistical tools to find out the dynamic on the market.
During the analysis stage, feedback from the stakeholder groups would be compared to determine areas of agreement as well as areas of divergence