

Key Insights
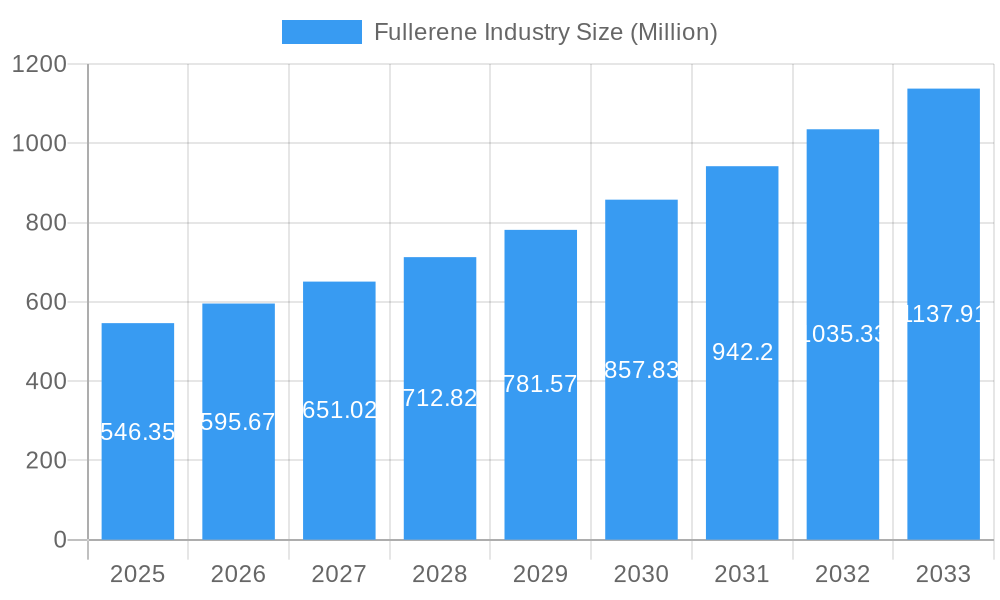
The fullerene market, valued at $546.35 million in 2025, is projected to experience robust growth, driven by increasing applications in diverse sectors. The Compound Annual Growth Rate (CAGR) of 8.97% from 2025 to 2033 indicates a significant expansion of this market. Key drivers include the rising demand for advanced materials in electronics, medicine, and energy storage. The unique properties of fullerenes, such as their high strength, conductivity, and biocompatibility, make them ideal for applications ranging from high-performance polymers and lubricants to drug delivery systems and solar cells. Emerging trends such as nanotechnology advancements and increasing research and development efforts are further fueling market growth. While challenges like high production costs and potential toxicity concerns exist, ongoing innovations in synthesis and functionalization techniques are mitigating these limitations. The market segmentation is likely to witness a dynamic shift, with the electronics and energy sectors potentially leading the growth trajectory due to substantial demand for high-performance materials and renewable energy solutions. Prominent players like NanoMaterials Ltd, IoLiTec, and Mitsubishi Corporation are actively shaping the market landscape through continuous product development and strategic partnerships.
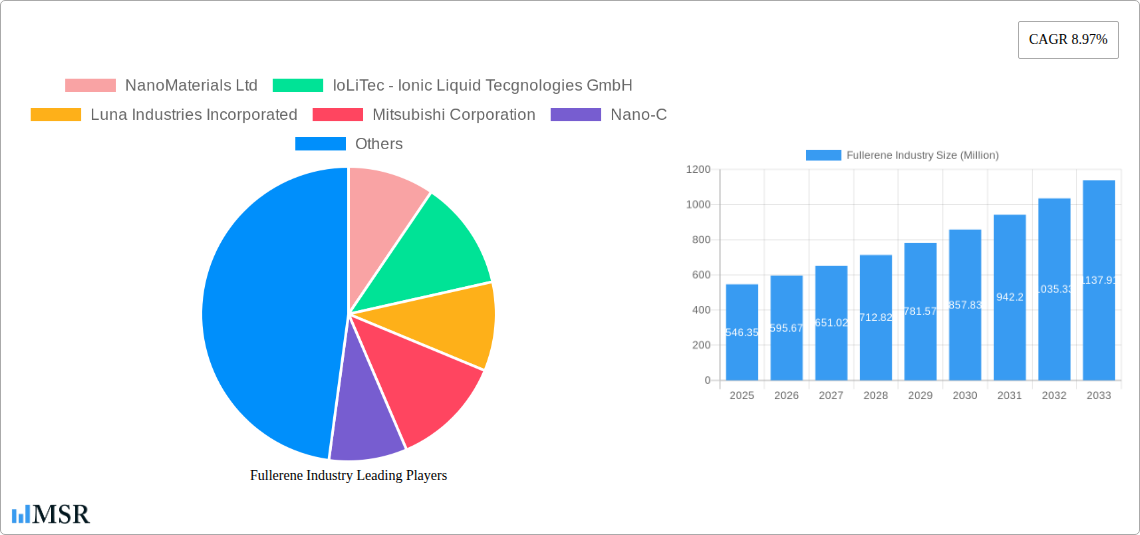
Fullerene Industry Market Size (In Million)
The forecast period (2025-2033) promises continued expansion of the fullerene market, driven by technological advancements and diversification of applications. The market is expected to see increased competition among existing players and the emergence of new entrants, leading to further innovation and price optimization. Strategic collaborations and mergers and acquisitions are likely to shape the industry consolidation, impacting market share and product diversification. Government initiatives promoting research and development in nanomaterials will also play a significant role in driving market growth and expanding the application range of fullerenes. Regional variations in market growth are anticipated, with regions possessing strong technological infrastructure and robust research ecosystems likely to experience faster expansion. Continued monitoring of evolving regulations and safety standards related to nanomaterials will be crucial for sustainable and responsible growth in the fullerene market.
Fullerene Industry Company Market Share
Fullerene Industry Market Report: 2019-2033 Forecast
This comprehensive report provides a detailed analysis of the Fullerene industry, encompassing market dynamics, key players, technological advancements, and future growth prospects. With a study period spanning 2019-2033, a base year of 2025, and a forecast period of 2025-2033, this report is an invaluable resource for industry stakeholders, investors, and researchers seeking actionable insights into this rapidly evolving market. The report offers a thorough examination of market concentration, trends, key segments, challenges, and opportunities, projecting a market size of xx Million by 2033 with a CAGR of xx%.
Fullerene Industry Market Concentration & Dynamics
This section delves into the competitive landscape of the Fullerene industry, analyzing market concentration, innovation ecosystems, regulatory frameworks, substitute products, end-user trends, and mergers & acquisitions (M&A) activities. The report assesses the market share held by key players, including but not limited to NanoMaterials Ltd, IoLiTec - Ionic Liquid Tecgnologies GmbH, Luna Industries Incorporated, Mitsubishi Corporation, Nano-C, Nanotech Industrial Solutions, SES Research Inc, POWDER NANO, and Nanografi Nanotechnology.
- Market Concentration: The Fullerene market exhibits a [describe level of concentration: e.g., moderately concentrated] structure, with the top five players accounting for approximately xx% of the global market share in 2025.
- Innovation Ecosystems: Significant investment in R&D across both established and emerging companies is driving innovation in Fullerene production and application development. Collaborative partnerships between academia and industry are fostering technological advancements.
- Regulatory Frameworks: Regulatory landscapes vary across different geographies, influencing the production, distribution, and application of Fullerenes. This report analyzes the impact of key regulations on market growth.
- Substitute Products: [Discuss substitute products and their competitive impact]
- End-User Trends: Growing demand across various end-use sectors like [list key end-use sectors] is fueling market expansion.
- M&A Activities: The Fullerene industry has witnessed [Number] M&A deals during the historical period (2019-2024), suggesting a trend of consolidation and expansion among key players.
Fullerene Industry Industry Insights & Trends
This section analyzes the factors driving market growth, examining technological disruptions and evolving consumer behaviors. The global Fullerene market size was valued at xx Million in 2024 and is projected to reach xx Million by 2033, exhibiting a CAGR of xx% during the forecast period (2025-2033). Growth is propelled by factors such as increasing demand for advanced materials in various industries, technological advancements in Fullerene synthesis and functionalization, and the expanding applications of Fullerenes in diverse sectors. Technological disruptions, including the development of novel synthesis techniques and the exploration of new applications, are reshaping the market landscape. Consumer preferences for sustainable and high-performance materials are also contributing to the increasing adoption of Fullerenes.
Key Markets & Segments Leading Fullerene Industry
This section identifies the dominant regions, countries, and segments within the Fullerene market. [Dominant Region/Country] is currently the leading market, driven by factors such as:
- Robust Economic Growth: Strong economic growth in [Dominant Region/Country] fuels demand for advanced materials.
- Developed Infrastructure: Well-developed infrastructure supports the production and distribution of Fullerenes.
- Favorable Government Policies: Supportive government policies incentivize investment in the Fullerene industry.
- High Adoption Rates: High adoption rates of Fullerenes across various sectors contribute to market dominance.
[Detailed dominance analysis providing insight into why this region/country/segment is leading]
Fullerene Industry Product Developments
Recent product innovations in the Fullerene industry focus on enhancing material properties, expanding applications, and improving cost-effectiveness. Technological advancements in synthesis, functionalization, and characterization techniques have led to the development of new Fullerene-based materials with improved performance characteristics. These innovations are driving competitiveness and creating new opportunities in various sectors.
Challenges in the Fullerene Industry Market
The Fullerene industry faces several challenges, including stringent regulatory approvals impacting production costs and market access, complexities in supply chain management leading to price volatility, and intense competition from alternative materials limiting market share gains. These challenges significantly impact market growth and profitability.
Forces Driving Fullerene Industry Growth
Technological advancements such as improved synthesis methods and novel applications, robust economic growth across key end-use sectors, and supportive government policies fostering research and development, are crucial factors driving Fullerene industry growth.
Challenges in the Fullerene Industry Market
Long-term growth in the Fullerene industry is fueled by continuous innovation in synthesis and functionalization techniques, strategic partnerships fostering technological advancements and market expansion, and exploration of novel applications across diverse sectors.
Emerging Opportunities in Fullerene Industry
Emerging opportunities arise from the exploration of new applications in sectors like [list sectors] and the development of sustainable and cost-effective production methods. New technologies, such as [mention emerging technologies], offer further avenues for growth. Changes in consumer preferences toward eco-friendly materials are also driving the adoption of Fullerenes in various applications.
Leading Players in the Fullerene Industry Sector
- NanoMaterials Ltd
- IoLiTec - Ionic Liquid Tecgnologies GmbH
- Luna Industries Incorporated
- Mitsubishi Corporation
- Nano-C
- Nanotech Industrial Solutions
- SES Research Inc
- POWDER NANO
- Nanografi Nano technology
Key Milestones in Fullerene Industry Industry
- [Year/Month]: [Milestone description and impact on market dynamics]
- [Year/Month]: [Milestone description and impact on market dynamics]
- [Year/Month]: [Milestone description and impact on market dynamics]
- Recent developments pertaining to the market studied will be covered in the complete report.
Strategic Outlook for Fullerene Industry Market
The Fullerene industry holds immense future potential, driven by continued innovation in material science, expanding applications across diverse sectors, and the growing demand for high-performance and sustainable materials. Strategic opportunities exist in collaborations, research and development, and market expansion into emerging regions, promising significant growth in the coming years.
Fullerene Industry Segmentation
-
1. Product Type
- 1.1. C60
- 1.2. C70
- 1.3. C76
- 1.4. Other Product Types
-
2. End-user Industry
- 2.1. Electrical and Electronics
- 2.2. Medical and Pharmaceuticals
- 2.3. Aerospace and Defense
- 2.4. Energy
- 2.5. Other End-user Industries
Fullerene Industry Segmentation By Geography
-
1. Asia Pacific
- 1.1. China
- 1.2. India
- 1.3. Japan
- 1.4. South Korea
- 1.5. ASEAN Countries
- 1.6. Rest of Asia Pacific
-
2. North America
- 2.1. United States
- 2.2. Canada
- 2.3. Mexico
-
3. Europe
- 3.1. Germany
- 3.2. United Kingdom
- 3.3. France
- 3.4. Italy
- 3.5. Rest of Europe
-
4. South America
- 4.1. Brazil
- 4.2. Argentina
- 4.3. Rest of South America
-
5. Middle East and Africa
- 5.1. Saudi Arabia
- 5.2. South Africa
- 5.3. Rest of Middle East and Africa
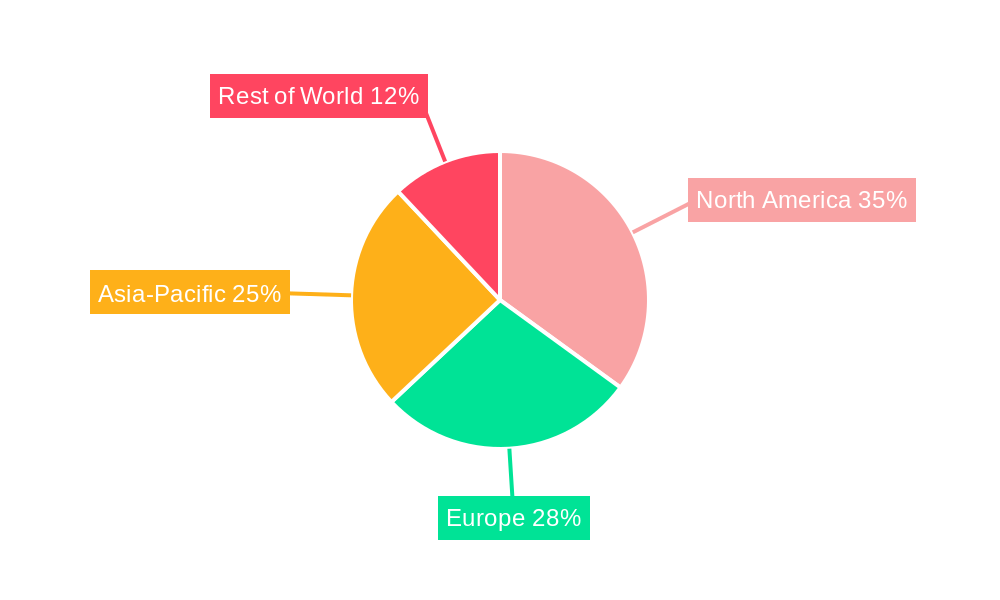
Fullerene Industry Regional Market Share
Geographic Coverage of Fullerene Industry
Fullerene Industry REPORT HIGHLIGHTS
| Aspects | Details |
|---|---|
| Study Period | 2020-2034 |
| Base Year | 2025 |
| Estimated Year | 2026 |
| Forecast Period | 2026-2034 |
| Historical Period | 2020-2025 |
| Growth Rate | CAGR of 8.97% from 2020-2034 |
| Segmentation |
|
Table of Contents
- 1. Introduction
- 1.1. Research Scope
- 1.2. Market Segmentation
- 1.3. Research Objective
- 1.4. Definitions and Assumptions
- 2. Executive Summary
- 2.1. Market Snapshot
- 3. Market Dynamics
- 3.1. Market Drivers
- 3.2. Market Restrains
- 3.3. Market Trends
- 3.4. Market Opportunities
- 4. Market Factor Analysis
- 4.1. Porters Five Forces
- 4.1.1. Bargaining Power of Suppliers
- 4.1.2. Bargaining Power of Buyers
- 4.1.3. Threat of New Entrants
- 4.1.4. Threat of Substitutes
- 4.1.5. Competitive Rivalry
- 4.2. PESTEL analysis
- 4.3. BCG Analysis
- 4.3.1. Stars (High Growth, High Market Share)
- 4.3.2. Cash Cows (Low Growth, High Market Share)
- 4.3.3. Question Mark (High Growth, Low Market Share)
- 4.3.4. Dogs (Low Growth, Low Market Share)
- 4.4. Ansoff Matrix Analysis
- 4.5. Supply Chain Analysis
- 4.6. Regulatory Landscape
- 4.7. Current Market Potential and Opportunity Assessment (TAM–SAM–SOM Framework)
- 4.8. MSR Analyst Note
- 4.1. Porters Five Forces
- 5. Market Analysis, Insights and Forecast 2021-2033
- 5.1. Market Analysis, Insights and Forecast - by Product Type
- 5.1.1. C60
- 5.1.2. C70
- 5.1.3. C76
- 5.1.4. Other Product Types
- 5.2. Market Analysis, Insights and Forecast - by End-user Industry
- 5.2.1. Electrical and Electronics
- 5.2.2. Medical and Pharmaceuticals
- 5.2.3. Aerospace and Defense
- 5.2.4. Energy
- 5.2.5. Other End-user Industries
- 5.3. Market Analysis, Insights and Forecast - by Region
- 5.3.1. Asia Pacific
- 5.3.2. North America
- 5.3.3. Europe
- 5.3.4. South America
- 5.3.5. Middle East and Africa
- 5.1. Market Analysis, Insights and Forecast - by Product Type
- 6. Global Fullerene Industry Analysis, Insights and Forecast, 2021-2033
- 6.1. Market Analysis, Insights and Forecast - by Product Type
- 6.1.1. C60
- 6.1.2. C70
- 6.1.3. C76
- 6.1.4. Other Product Types
- 6.2. Market Analysis, Insights and Forecast - by End-user Industry
- 6.2.1. Electrical and Electronics
- 6.2.2. Medical and Pharmaceuticals
- 6.2.3. Aerospace and Defense
- 6.2.4. Energy
- 6.2.5. Other End-user Industries
- 6.1. Market Analysis, Insights and Forecast - by Product Type
- 7. Asia Pacific Fullerene Industry Analysis, Insights and Forecast, 2020-2032
- 7.1. Market Analysis, Insights and Forecast - by Product Type
- 7.1.1. C60
- 7.1.2. C70
- 7.1.3. C76
- 7.1.4. Other Product Types
- 7.2. Market Analysis, Insights and Forecast - by End-user Industry
- 7.2.1. Electrical and Electronics
- 7.2.2. Medical and Pharmaceuticals
- 7.2.3. Aerospace and Defense
- 7.2.4. Energy
- 7.2.5. Other End-user Industries
- 7.1. Market Analysis, Insights and Forecast - by Product Type
- 8. North America Fullerene Industry Analysis, Insights and Forecast, 2020-2032
- 8.1. Market Analysis, Insights and Forecast - by Product Type
- 8.1.1. C60
- 8.1.2. C70
- 8.1.3. C76
- 8.1.4. Other Product Types
- 8.2. Market Analysis, Insights and Forecast - by End-user Industry
- 8.2.1. Electrical and Electronics
- 8.2.2. Medical and Pharmaceuticals
- 8.2.3. Aerospace and Defense
- 8.2.4. Energy
- 8.2.5. Other End-user Industries
- 8.1. Market Analysis, Insights and Forecast - by Product Type
- 9. Europe Fullerene Industry Analysis, Insights and Forecast, 2020-2032
- 9.1. Market Analysis, Insights and Forecast - by Product Type
- 9.1.1. C60
- 9.1.2. C70
- 9.1.3. C76
- 9.1.4. Other Product Types
- 9.2. Market Analysis, Insights and Forecast - by End-user Industry
- 9.2.1. Electrical and Electronics
- 9.2.2. Medical and Pharmaceuticals
- 9.2.3. Aerospace and Defense
- 9.2.4. Energy
- 9.2.5. Other End-user Industries
- 9.1. Market Analysis, Insights and Forecast - by Product Type
- 10. South America Fullerene Industry Analysis, Insights and Forecast, 2020-2032
- 10.1. Market Analysis, Insights and Forecast - by Product Type
- 10.1.1. C60
- 10.1.2. C70
- 10.1.3. C76
- 10.1.4. Other Product Types
- 10.2. Market Analysis, Insights and Forecast - by End-user Industry
- 10.2.1. Electrical and Electronics
- 10.2.2. Medical and Pharmaceuticals
- 10.2.3. Aerospace and Defense
- 10.2.4. Energy
- 10.2.5. Other End-user Industries
- 10.1. Market Analysis, Insights and Forecast - by Product Type
- 11. Middle East and Africa Fullerene Industry Analysis, Insights and Forecast, 2020-2032
- 11.1. Market Analysis, Insights and Forecast - by Product Type
- 11.1.1. C60
- 11.1.2. C70
- 11.1.3. C76
- 11.1.4. Other Product Types
- 11.2. Market Analysis, Insights and Forecast - by End-user Industry
- 11.2.1. Electrical and Electronics
- 11.2.2. Medical and Pharmaceuticals
- 11.2.3. Aerospace and Defense
- 11.2.4. Energy
- 11.2.5. Other End-user Industries
- 11.1. Market Analysis, Insights and Forecast - by Product Type
- 12. Competitive Analysis
- 12.1. Company Profiles
- 12.1.1 NanoMaterials Ltd
- 12.1.1.1. Company Overview
- 12.1.1.2. Products
- 12.1.1.3. Company Financials
- 12.1.1.4. SWOT Analysis
- 12.1.2 IoLiTec - Ionic Liquid Tecgnologies GmbH
- 12.1.2.1. Company Overview
- 12.1.2.2. Products
- 12.1.2.3. Company Financials
- 12.1.2.4. SWOT Analysis
- 12.1.3 Luna Industries Incorporated
- 12.1.3.1. Company Overview
- 12.1.3.2. Products
- 12.1.3.3. Company Financials
- 12.1.3.4. SWOT Analysis
- 12.1.4 Mitsubishi Corporation
- 12.1.4.1. Company Overview
- 12.1.4.2. Products
- 12.1.4.3. Company Financials
- 12.1.4.4. SWOT Analysis
- 12.1.5 Nano-C
- 12.1.5.1. Company Overview
- 12.1.5.2. Products
- 12.1.5.3. Company Financials
- 12.1.5.4. SWOT Analysis
- 12.1.6 Nanotech Industrial Solutions
- 12.1.6.1. Company Overview
- 12.1.6.2. Products
- 12.1.6.3. Company Financials
- 12.1.6.4. SWOT Analysis
- 12.1.7 SES Research Inc
- 12.1.7.1. Company Overview
- 12.1.7.2. Products
- 12.1.7.3. Company Financials
- 12.1.7.4. SWOT Analysis
- 12.1.8 POWDER NANO
- 12.1.8.1. Company Overview
- 12.1.8.2. Products
- 12.1.8.3. Company Financials
- 12.1.8.4. SWOT Analysis
- 12.1.9 Nanografi Nano technology*List Not Exhaustive
- 12.1.9.1. Company Overview
- 12.1.9.2. Products
- 12.1.9.3. Company Financials
- 12.1.9.4. SWOT Analysis
- 12.1.1 NanoMaterials Ltd
- 12.2. Market Entropy
- 12.2.1 Company's Key Areas Served
- 12.2.2 Recent Developments
- 12.3. Company Market Share Analysis 2025
- 12.3.1 Top 5 Companies Market Share Analysis
- 12.3.2 Top 3 Companies Market Share Analysis
- 12.4. List of Potential Customers
- 13. Research Methodology
List of Figures
- Figure 1: Global Fullerene Industry Revenue Breakdown (Million, %) by Region 2025 & 2033
- Figure 2: Global Fullerene Industry Volume Breakdown (Million, %) by Region 2025 & 2033
- Figure 3: Asia Pacific Fullerene Industry Revenue (Million), by Product Type 2025 & 2033
- Figure 4: Asia Pacific Fullerene Industry Volume (Million), by Product Type 2025 & 2033
- Figure 5: Asia Pacific Fullerene Industry Revenue Share (%), by Product Type 2025 & 2033
- Figure 6: Asia Pacific Fullerene Industry Volume Share (%), by Product Type 2025 & 2033
- Figure 7: Asia Pacific Fullerene Industry Revenue (Million), by End-user Industry 2025 & 2033
- Figure 8: Asia Pacific Fullerene Industry Volume (Million), by End-user Industry 2025 & 2033
- Figure 9: Asia Pacific Fullerene Industry Revenue Share (%), by End-user Industry 2025 & 2033
- Figure 10: Asia Pacific Fullerene Industry Volume Share (%), by End-user Industry 2025 & 2033
- Figure 11: Asia Pacific Fullerene Industry Revenue (Million), by Country 2025 & 2033
- Figure 12: Asia Pacific Fullerene Industry Volume (Million), by Country 2025 & 2033
- Figure 13: Asia Pacific Fullerene Industry Revenue Share (%), by Country 2025 & 2033
- Figure 14: Asia Pacific Fullerene Industry Volume Share (%), by Country 2025 & 2033
- Figure 15: North America Fullerene Industry Revenue (Million), by Product Type 2025 & 2033
- Figure 16: North America Fullerene Industry Volume (Million), by Product Type 2025 & 2033
- Figure 17: North America Fullerene Industry Revenue Share (%), by Product Type 2025 & 2033
- Figure 18: North America Fullerene Industry Volume Share (%), by Product Type 2025 & 2033
- Figure 19: North America Fullerene Industry Revenue (Million), by End-user Industry 2025 & 2033
- Figure 20: North America Fullerene Industry Volume (Million), by End-user Industry 2025 & 2033
- Figure 21: North America Fullerene Industry Revenue Share (%), by End-user Industry 2025 & 2033
- Figure 22: North America Fullerene Industry Volume Share (%), by End-user Industry 2025 & 2033
- Figure 23: North America Fullerene Industry Revenue (Million), by Country 2025 & 2033
- Figure 24: North America Fullerene Industry Volume (Million), by Country 2025 & 2033
- Figure 25: North America Fullerene Industry Revenue Share (%), by Country 2025 & 2033
- Figure 26: North America Fullerene Industry Volume Share (%), by Country 2025 & 2033
- Figure 27: Europe Fullerene Industry Revenue (Million), by Product Type 2025 & 2033
- Figure 28: Europe Fullerene Industry Volume (Million), by Product Type 2025 & 2033
- Figure 29: Europe Fullerene Industry Revenue Share (%), by Product Type 2025 & 2033
- Figure 30: Europe Fullerene Industry Volume Share (%), by Product Type 2025 & 2033
- Figure 31: Europe Fullerene Industry Revenue (Million), by End-user Industry 2025 & 2033
- Figure 32: Europe Fullerene Industry Volume (Million), by End-user Industry 2025 & 2033
- Figure 33: Europe Fullerene Industry Revenue Share (%), by End-user Industry 2025 & 2033
- Figure 34: Europe Fullerene Industry Volume Share (%), by End-user Industry 2025 & 2033
- Figure 35: Europe Fullerene Industry Revenue (Million), by Country 2025 & 2033
- Figure 36: Europe Fullerene Industry Volume (Million), by Country 2025 & 2033
- Figure 37: Europe Fullerene Industry Revenue Share (%), by Country 2025 & 2033
- Figure 38: Europe Fullerene Industry Volume Share (%), by Country 2025 & 2033
- Figure 39: South America Fullerene Industry Revenue (Million), by Product Type 2025 & 2033
- Figure 40: South America Fullerene Industry Volume (Million), by Product Type 2025 & 2033
- Figure 41: South America Fullerene Industry Revenue Share (%), by Product Type 2025 & 2033
- Figure 42: South America Fullerene Industry Volume Share (%), by Product Type 2025 & 2033
- Figure 43: South America Fullerene Industry Revenue (Million), by End-user Industry 2025 & 2033
- Figure 44: South America Fullerene Industry Volume (Million), by End-user Industry 2025 & 2033
- Figure 45: South America Fullerene Industry Revenue Share (%), by End-user Industry 2025 & 2033
- Figure 46: South America Fullerene Industry Volume Share (%), by End-user Industry 2025 & 2033
- Figure 47: South America Fullerene Industry Revenue (Million), by Country 2025 & 2033
- Figure 48: South America Fullerene Industry Volume (Million), by Country 2025 & 2033
- Figure 49: South America Fullerene Industry Revenue Share (%), by Country 2025 & 2033
- Figure 50: South America Fullerene Industry Volume Share (%), by Country 2025 & 2033
- Figure 51: Middle East and Africa Fullerene Industry Revenue (Million), by Product Type 2025 & 2033
- Figure 52: Middle East and Africa Fullerene Industry Volume (Million), by Product Type 2025 & 2033
- Figure 53: Middle East and Africa Fullerene Industry Revenue Share (%), by Product Type 2025 & 2033
- Figure 54: Middle East and Africa Fullerene Industry Volume Share (%), by Product Type 2025 & 2033
- Figure 55: Middle East and Africa Fullerene Industry Revenue (Million), by End-user Industry 2025 & 2033
- Figure 56: Middle East and Africa Fullerene Industry Volume (Million), by End-user Industry 2025 & 2033
- Figure 57: Middle East and Africa Fullerene Industry Revenue Share (%), by End-user Industry 2025 & 2033
- Figure 58: Middle East and Africa Fullerene Industry Volume Share (%), by End-user Industry 2025 & 2033
- Figure 59: Middle East and Africa Fullerene Industry Revenue (Million), by Country 2025 & 2033
- Figure 60: Middle East and Africa Fullerene Industry Volume (Million), by Country 2025 & 2033
- Figure 61: Middle East and Africa Fullerene Industry Revenue Share (%), by Country 2025 & 2033
- Figure 62: Middle East and Africa Fullerene Industry Volume Share (%), by Country 2025 & 2033
List of Tables
- Table 1: Global Fullerene Industry Revenue Million Forecast, by Product Type 2020 & 2033
- Table 2: Global Fullerene Industry Volume Million Forecast, by Product Type 2020 & 2033
- Table 3: Global Fullerene Industry Revenue Million Forecast, by End-user Industry 2020 & 2033
- Table 4: Global Fullerene Industry Volume Million Forecast, by End-user Industry 2020 & 2033
- Table 5: Global Fullerene Industry Revenue Million Forecast, by Region 2020 & 2033
- Table 6: Global Fullerene Industry Volume Million Forecast, by Region 2020 & 2033
- Table 7: Global Fullerene Industry Revenue Million Forecast, by Product Type 2020 & 2033
- Table 8: Global Fullerene Industry Volume Million Forecast, by Product Type 2020 & 2033
- Table 9: Global Fullerene Industry Revenue Million Forecast, by End-user Industry 2020 & 2033
- Table 10: Global Fullerene Industry Volume Million Forecast, by End-user Industry 2020 & 2033
- Table 11: Global Fullerene Industry Revenue Million Forecast, by Country 2020 & 2033
- Table 12: Global Fullerene Industry Volume Million Forecast, by Country 2020 & 2033
- Table 13: China Fullerene Industry Revenue (Million) Forecast, by Application 2020 & 2033
- Table 14: China Fullerene Industry Volume (Million) Forecast, by Application 2020 & 2033
- Table 15: India Fullerene Industry Revenue (Million) Forecast, by Application 2020 & 2033
- Table 16: India Fullerene Industry Volume (Million) Forecast, by Application 2020 & 2033
- Table 17: Japan Fullerene Industry Revenue (Million) Forecast, by Application 2020 & 2033
- Table 18: Japan Fullerene Industry Volume (Million) Forecast, by Application 2020 & 2033
- Table 19: South Korea Fullerene Industry Revenue (Million) Forecast, by Application 2020 & 2033
- Table 20: South Korea Fullerene Industry Volume (Million) Forecast, by Application 2020 & 2033
- Table 21: ASEAN Countries Fullerene Industry Revenue (Million) Forecast, by Application 2020 & 2033
- Table 22: ASEAN Countries Fullerene Industry Volume (Million) Forecast, by Application 2020 & 2033
- Table 23: Rest of Asia Pacific Fullerene Industry Revenue (Million) Forecast, by Application 2020 & 2033
- Table 24: Rest of Asia Pacific Fullerene Industry Volume (Million) Forecast, by Application 2020 & 2033
- Table 25: Global Fullerene Industry Revenue Million Forecast, by Product Type 2020 & 2033
- Table 26: Global Fullerene Industry Volume Million Forecast, by Product Type 2020 & 2033
- Table 27: Global Fullerene Industry Revenue Million Forecast, by End-user Industry 2020 & 2033
- Table 28: Global Fullerene Industry Volume Million Forecast, by End-user Industry 2020 & 2033
- Table 29: Global Fullerene Industry Revenue Million Forecast, by Country 2020 & 2033
- Table 30: Global Fullerene Industry Volume Million Forecast, by Country 2020 & 2033
- Table 31: United States Fullerene Industry Revenue (Million) Forecast, by Application 2020 & 2033
- Table 32: United States Fullerene Industry Volume (Million) Forecast, by Application 2020 & 2033
- Table 33: Canada Fullerene Industry Revenue (Million) Forecast, by Application 2020 & 2033
- Table 34: Canada Fullerene Industry Volume (Million) Forecast, by Application 2020 & 2033
- Table 35: Mexico Fullerene Industry Revenue (Million) Forecast, by Application 2020 & 2033
- Table 36: Mexico Fullerene Industry Volume (Million) Forecast, by Application 2020 & 2033
- Table 37: Global Fullerene Industry Revenue Million Forecast, by Product Type 2020 & 2033
- Table 38: Global Fullerene Industry Volume Million Forecast, by Product Type 2020 & 2033
- Table 39: Global Fullerene Industry Revenue Million Forecast, by End-user Industry 2020 & 2033
- Table 40: Global Fullerene Industry Volume Million Forecast, by End-user Industry 2020 & 2033
- Table 41: Global Fullerene Industry Revenue Million Forecast, by Country 2020 & 2033
- Table 42: Global Fullerene Industry Volume Million Forecast, by Country 2020 & 2033
- Table 43: Germany Fullerene Industry Revenue (Million) Forecast, by Application 2020 & 2033
- Table 44: Germany Fullerene Industry Volume (Million) Forecast, by Application 2020 & 2033
- Table 45: United Kingdom Fullerene Industry Revenue (Million) Forecast, by Application 2020 & 2033
- Table 46: United Kingdom Fullerene Industry Volume (Million) Forecast, by Application 2020 & 2033
- Table 47: France Fullerene Industry Revenue (Million) Forecast, by Application 2020 & 2033
- Table 48: France Fullerene Industry Volume (Million) Forecast, by Application 2020 & 2033
- Table 49: Italy Fullerene Industry Revenue (Million) Forecast, by Application 2020 & 2033
- Table 50: Italy Fullerene Industry Volume (Million) Forecast, by Application 2020 & 2033
- Table 51: Rest of Europe Fullerene Industry Revenue (Million) Forecast, by Application 2020 & 2033
- Table 52: Rest of Europe Fullerene Industry Volume (Million) Forecast, by Application 2020 & 2033
- Table 53: Global Fullerene Industry Revenue Million Forecast, by Product Type 2020 & 2033
- Table 54: Global Fullerene Industry Volume Million Forecast, by Product Type 2020 & 2033
- Table 55: Global Fullerene Industry Revenue Million Forecast, by End-user Industry 2020 & 2033
- Table 56: Global Fullerene Industry Volume Million Forecast, by End-user Industry 2020 & 2033
- Table 57: Global Fullerene Industry Revenue Million Forecast, by Country 2020 & 2033
- Table 58: Global Fullerene Industry Volume Million Forecast, by Country 2020 & 2033
- Table 59: Brazil Fullerene Industry Revenue (Million) Forecast, by Application 2020 & 2033
- Table 60: Brazil Fullerene Industry Volume (Million) Forecast, by Application 2020 & 2033
- Table 61: Argentina Fullerene Industry Revenue (Million) Forecast, by Application 2020 & 2033
- Table 62: Argentina Fullerene Industry Volume (Million) Forecast, by Application 2020 & 2033
- Table 63: Rest of South America Fullerene Industry Revenue (Million) Forecast, by Application 2020 & 2033
- Table 64: Rest of South America Fullerene Industry Volume (Million) Forecast, by Application 2020 & 2033
- Table 65: Global Fullerene Industry Revenue Million Forecast, by Product Type 2020 & 2033
- Table 66: Global Fullerene Industry Volume Million Forecast, by Product Type 2020 & 2033
- Table 67: Global Fullerene Industry Revenue Million Forecast, by End-user Industry 2020 & 2033
- Table 68: Global Fullerene Industry Volume Million Forecast, by End-user Industry 2020 & 2033
- Table 69: Global Fullerene Industry Revenue Million Forecast, by Country 2020 & 2033
- Table 70: Global Fullerene Industry Volume Million Forecast, by Country 2020 & 2033
- Table 71: Saudi Arabia Fullerene Industry Revenue (Million) Forecast, by Application 2020 & 2033
- Table 72: Saudi Arabia Fullerene Industry Volume (Million) Forecast, by Application 2020 & 2033
- Table 73: South Africa Fullerene Industry Revenue (Million) Forecast, by Application 2020 & 2033
- Table 74: South Africa Fullerene Industry Volume (Million) Forecast, by Application 2020 & 2033
- Table 75: Rest of Middle East and Africa Fullerene Industry Revenue (Million) Forecast, by Application 2020 & 2033
- Table 76: Rest of Middle East and Africa Fullerene Industry Volume (Million) Forecast, by Application 2020 & 2033
Frequently Asked Questions
1. What is the projected Compound Annual Growth Rate (CAGR) of the Fullerene Industry?
The projected CAGR is approximately 8.97%.
2. Which companies are prominent players in the Fullerene Industry?
Key companies in the market include NanoMaterials Ltd, IoLiTec - Ionic Liquid Tecgnologies GmbH, Luna Industries Incorporated, Mitsubishi Corporation, Nano-C, Nanotech Industrial Solutions, SES Research Inc, POWDER NANO, Nanografi Nano technology*List Not Exhaustive.
3. What are the main segments of the Fullerene Industry?
The market segments include Product Type, End-user Industry.
4. Can you provide details about the market size?
The market size is estimated to be USD 546.35 Million as of 2022.
5. What are some drivers contributing to market growth?
Increased usage in the Pharmaceutical Industry; Penetration in Surface Coatings Industry due to Strong Metal Matrix; Growing Demand of Fullerene as an Optical Limiter; Other Drivers.
6. What are the notable trends driving market growth?
Increasing Demand from Medical and Pharmaceutical Industry..
7. Are there any restraints impacting market growth?
Increased usage in the Pharmaceutical Industry; Penetration in Surface Coatings Industry due to Strong Metal Matrix; Growing Demand of Fullerene as an Optical Limiter; Other Drivers.
8. Can you provide examples of recent developments in the market?
Recent developments pertaining to the market studied will be covered in the complete report.
9. What pricing options are available for accessing the report?
Pricing options include single-user, multi-user, and enterprise licenses priced at USD 4750, USD 5250, and USD 8750 respectively.
10. Is the market size provided in terms of value or volume?
The market size is provided in terms of value, measured in Million and volume, measured in Million.
11. Are there any specific market keywords associated with the report?
Yes, the market keyword associated with the report is "Fullerene Industry," which aids in identifying and referencing the specific market segment covered.
12. How do I determine which pricing option suits my needs best?
The pricing options vary based on user requirements and access needs. Individual users may opt for single-user licenses, while businesses requiring broader access may choose multi-user or enterprise licenses for cost-effective access to the report.
13. Are there any additional resources or data provided in the Fullerene Industry report?
While the report offers comprehensive insights, it's advisable to review the specific contents or supplementary materials provided to ascertain if additional resources or data are available.
14. How can I stay updated on further developments or reports in the Fullerene Industry?
To stay informed about further developments, trends, and reports in the Fullerene Industry, consider subscribing to industry newsletters, following relevant companies and organizations, or regularly checking reputable industry news sources and publications.
Methodology
Step 1 - Identification of Relevant Samples Size from Population Database


Step 2 - Approaches for Defining Global Market Size (Value, Volume* & Price*)

Note*: In applicable scenarios
Step 3 - Data Sources
Primary Research
- Web Analytics
- Survey Reports
- Research Institute
- Latest Research Reports
- Opinion Leaders
Secondary Research
- Annual Reports
- White Paper
- Latest Press Release
- Industry Association
- Paid Database
- Investor Presentations

Step 4 - Data Triangulation
Involves using different sources of information in order to increase the validity of a study
These sources are likely to be stakeholders in a program - participants, other researchers, program staff, other community members, and so on.
Then we put all data in single framework & apply various statistical tools to find out the dynamic on the market.
During the analysis stage, feedback from the stakeholder groups would be compared to determine areas of agreement as well as areas of divergence