

Key Insights
The global graphite market, valued at $31.59 billion in 2025, is poised for substantial expansion. This growth is primarily propelled by the escalating demand for lithium-ion batteries, crucial for the burgeoning electric vehicle (EV) and energy storage systems (ESS) sectors. The market is projected to grow at a Compound Annual Growth Rate (CAGR) of 8.42% from 2025, supported by the increasing adoption of renewable energy and stringent environmental regulations favoring sustainable technologies. Key growth catalysts include the rising production of electric vehicles, the expansion of renewable energy infrastructure, and the growing need for high-performance materials across diverse industrial applications. The increasing utilization of graphite in advanced materials such as graphene and carbon nanotubes further enhances this positive market trajectory. While supply chain disruptions and raw material price volatility present potential challenges, advancements in graphite production and processing technologies are expected to mitigate these risks. The market is segmented by graphite type, with natural graphite currently dominating due to its cost-effectiveness. However, synthetic graphite is gaining prominence, especially for high-end applications like batteries, owing to its superior purity and consistency. The Asia-Pacific region, led by China, is anticipated to maintain market leadership due to its robust manufacturing capabilities and significant investments in the EV and energy storage sectors.
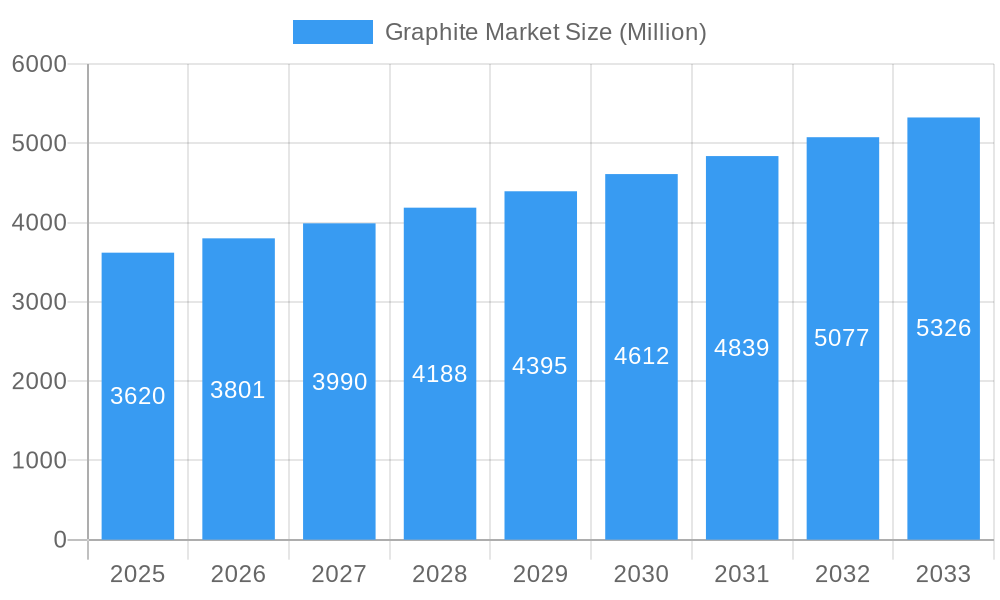
Graphite Market Market Size (In Billion)
Application-wise, the battery segment represents the largest market share, driving overall demand. The electronics industry also offers considerable opportunities, driven by continuous growth in consumer electronics and semiconductor manufacturing. The automotive sector, particularly for electric and hybrid vehicles, is a pivotal driver of graphite demand, indicating strong future growth prospects. Additionally, the metallurgy and refractories sectors continue to be significant contributors, with applications spanning steel production to high-temperature furnaces. Despite challenges related to resource availability and environmental concerns surrounding graphite extraction and processing, ongoing research and development in sustainable production techniques and recycling initiatives are set to address these issues. The competitive landscape features both established market leaders and emerging companies, fostering technological innovation and cost optimization. Strategic collaborations and mergers and acquisitions are also expected to influence market dynamics in the forthcoming years.
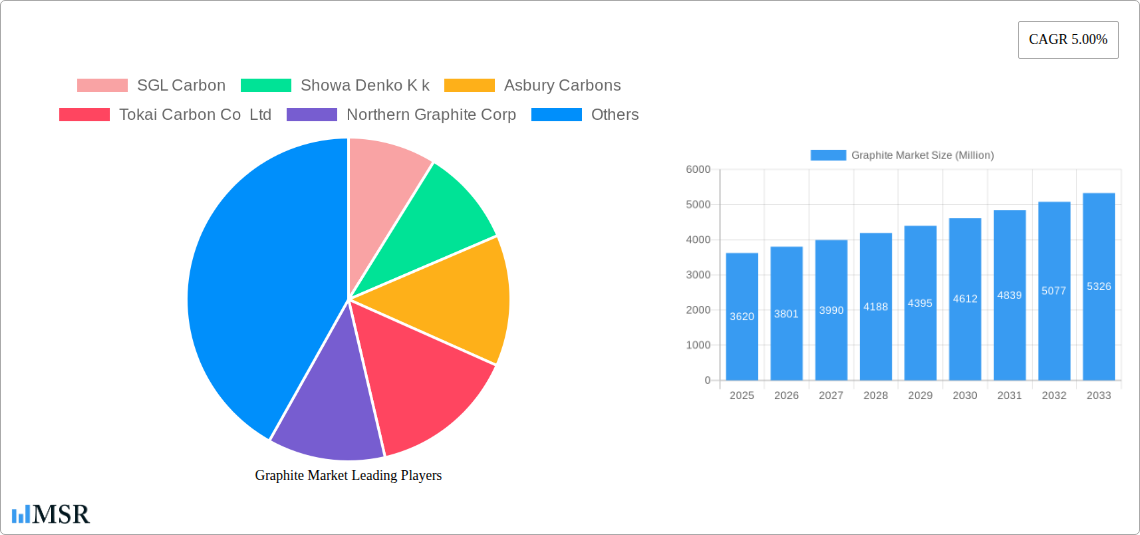
Graphite Market Company Market Share
Graphite Market Report: A Comprehensive Analysis (2019-2033)
This comprehensive report provides a detailed analysis of the global Graphite Market, encompassing market size, growth drivers, key segments, leading players, and future outlook. The study period covers 2019-2033, with 2025 as the base and estimated year. This in-depth analysis is crucial for stakeholders seeking to navigate the complexities of this rapidly evolving market. The report delves into the intricate dynamics of graphite production, consumption, and technological advancements, offering actionable insights to inform strategic decision-making. The market is projected to reach xx Million by 2033, exhibiting a CAGR of xx% during the forecast period (2025-2033).
Graphite Market Concentration & Dynamics
The global graphite market exhibits a moderately concentrated landscape, with several major players holding significant market share. However, the presence of numerous smaller regional players introduces a level of competitive dynamism. Market share data reveals that the top five players account for approximately xx% of the global market, with SGL Carbon, Showa Denko K.K., Asbury Carbons, and Tokai Carbon Co. Ltd. among the leading entities. The market's innovative ecosystem is driven by ongoing research and development in advanced graphite materials, particularly for high-performance applications like lithium-ion batteries. Regulatory frameworks vary across regions, impacting production and trade dynamics. Substitute products, such as other carbon-based materials, pose a competitive threat to certain graphite applications. End-user trends are shifting towards greater adoption of electric vehicles (EVs) and energy storage solutions, fueling demand for high-quality graphite. Mergers and acquisitions (M&A) activity has increased in recent years, reflecting consolidation efforts within the industry. Between 2019 and 2024, there were approximately xx M&A deals within the graphite sector.
- Market Concentration: Top 5 players hold approximately xx% market share.
- Innovation Ecosystem: Focus on advanced materials for high-performance applications.
- Regulatory Frameworks: Vary by region, impacting production and trade.
- Substitute Products: Other carbon-based materials pose competitive threat.
- End-User Trends: Growing demand driven by EV and energy storage sectors.
- M&A Activity: Approximately xx deals between 2019 and 2024.
Graphite Market Industry Insights & Trends
The global graphite market is experiencing significant growth fueled by several key factors. The increasing demand for lithium-ion batteries in electric vehicles (EVs), hybrid electric vehicles (HEVs), and portable electronic devices is a major growth driver. The global market size was valued at xx Million in 2024, and it's projected to reach xx Million by 2033, exhibiting robust growth, primarily driven by the burgeoning EV market. This surge in demand is coupled with technological disruptions, such as the development of new graphite-based materials with enhanced performance characteristics. Consumer behavior is evolving towards greater adoption of sustainable and environmentally friendly technologies, boosting demand for graphite in renewable energy applications. Moreover, continuous advancements in battery technology are increasing the energy density and efficiency of lithium-ion batteries, which, in turn, is positively affecting the graphite market.
Key Markets & Segments Leading Graphite Market
The Asia-Pacific region currently dominates the global graphite market, driven by strong economic growth, robust industrialization, and a large manufacturing base. China, in particular, plays a pivotal role as a major producer and consumer of graphite. Within the various segments, the battery application holds the largest market share, followed by refractories and electrodes. Natural graphite currently dominates the overall market in terms of volume, while synthetic graphite is witnessing considerable growth due to its superior properties for specific applications. The Automotive (including EV/HEV vehicles) end-user industry is exhibiting the highest growth rate.
- Dominant Region: Asia-Pacific, particularly China.
- Dominant Application: Batteries.
- Dominant Type: Natural Graphite (by volume); Synthetic Graphite (by growth rate).
- Fastest-Growing End-User Industry: Automotive (EV/HEV).
Drivers for Key Regions and Segments:
- Asia-Pacific: Strong economic growth, industrialization, large manufacturing base.
- Automotive: Rapid growth of EV and HEV market.
- Batteries: Increasing demand for energy storage solutions.
- Synthetic Graphite: Superior properties for specific applications.
Graphite Market Product Developments
Recent advancements in graphite technology have focused on improving the purity, consistency, and performance characteristics of graphite materials. This includes the development of novel synthetic graphite grades optimized for high-energy density batteries, as well as the exploration of advanced processing techniques to enhance the overall quality and efficiency of graphite production. These developments are vital for meeting the increasing demand for high-performance materials in various applications, from lithium-ion batteries to advanced composites.
Challenges in the Graphite Market Market
The graphite market faces several challenges. Supply chain disruptions, particularly related to raw material sourcing and geopolitical instability, can impact production and pricing. Furthermore, fluctuating raw material prices and intense competition from substitute materials pose significant challenges. Regulatory hurdles, including environmental regulations and trade restrictions, also present complexities for market participants. The overall impact of these challenges is estimated to reduce the market growth by approximately xx% annually.
Forces Driving Graphite Market Growth
Technological advancements in battery technology and the increasing demand for electric vehicles are key drivers of market growth. Favorable government policies promoting renewable energy and sustainable transportation are also boosting demand. Strong economic growth in emerging markets and ongoing industrialization contribute to the expansion of the graphite market. The rising use of graphite in other applications, such as lubricants and refractories, further fuels growth.
Long-Term Growth Catalysts in Graphite Market
Long-term growth in the graphite market will be driven by continuous innovation in graphite-based materials, expanding applications in emerging technologies, and strategic partnerships between raw material suppliers, battery manufacturers, and automotive companies. The exploration of new graphite deposits and advancements in processing techniques will further enhance market growth. Market expansion into new geographical regions and the development of sustainable and environmentally friendly graphite production methods will be crucial for long-term success.
Emerging Opportunities in Graphite Market
The development of advanced graphite materials with enhanced properties, for example, improved conductivity and higher energy density, represents a significant opportunity. New applications in various sectors, including aerospace, defense, and advanced composites, present promising prospects. The growing demand for sustainable and ethically sourced graphite provides opportunities for companies committed to responsible mining and processing practices. Expansion into new geographical markets, particularly in developing economies with growing energy demands, creates significant growth potential.
Leading Players in the Graphite Market Sector
- SGL Carbon
- Showa Denko K.K.
- Asbury Carbons
- Tokai Carbon Co. Ltd.
- Northern Graphite Corp
- Mason Graphite Inc
- Triton Minerals
- BTR New Material Group Co. Ltd.
- Jiangxi Zichen Technology Co. Ltd.
- Imerys
- Shanghai Shanshan Technology Co. Ltd.
- Syrah Resources Limited
- Shenzhen Xiangfenghua Technology Co. Ltd.
- Nippon Kokuen Group
Key Milestones in Graphite Market Industry
- October 2022: Syrah Resources Ltd. announced a supply agreement with LG Energy Solution Ltd. for 2 ktpa of graphite anode material (AAM) from 2025, increasing to at least 10 ktpa subsequently. This highlights the growing demand for graphite in the lithium-ion battery market and the strategic partnerships forming within the industry.
- October 2022: Imerys Graphite & Carbon launched the EMILI Project to expand its lithium exploitation capabilities. This underscores the growing importance of vertically integrated graphite producers in the battery supply chain.
Strategic Outlook for Graphite Market Market
The graphite market holds significant potential for growth over the next decade. Strategic opportunities exist for companies that can capitalize on technological advancements, secure reliable supply chains, and establish strong partnerships within the battery and automotive industries. Focus on sustainability and ethical sourcing will be crucial for long-term success. Companies that can innovate and adapt to the changing market dynamics will be well-positioned to capture significant market share.
Graphite Market Segmentation
-
1. Type
- 1.1. Natural Graphite
- 1.2. Synthetic Graphite
-
2. Application
- 2.1. Electrodes
- 2.2. Refractories, Casting, and Foundries
- 2.3. Batteries
- 2.4. Lubricants
- 2.5. Other Applications
-
3. End-user Industry
- 3.1. Electronics
- 3.2. Metallurgy
- 3.3. Automotive (Includes EV/HEV Vehicles)
- 3.4. Other End-user Industries
Graphite Market Segmentation By Geography
-
1. Asia Pacific
- 1.1. China
- 1.2. India
- 1.3. Japan
- 1.4. South Korea
- 1.5. Rest of Asia Pacific
-
2. North America
- 2.1. United States
- 2.2. Canada
- 2.3. Mexico
-
3. Europe
- 3.1. Germany
- 3.2. United Kingdom
- 3.3. Italy
- 3.4. France
- 3.5. Russia
- 3.6. Rest of Europe
-
4. South America
- 4.1. Brazil
- 4.2. Argentina
- 4.3. Rest of South America
-
5. Middle East and Africa
- 5.1. Saudi Arabia
- 5.2. South Africa
- 5.3. Rest of Middle East and Africa
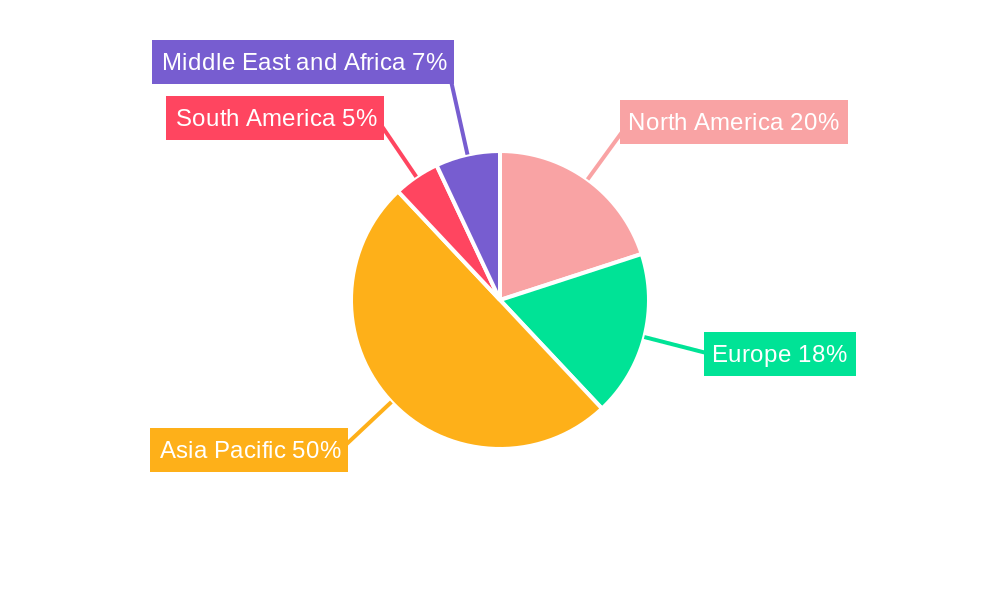
Graphite Market Regional Market Share
Geographic Coverage of Graphite Market
Graphite Market REPORT HIGHLIGHTS
| Aspects | Details |
|---|---|
| Study Period | 2020-2034 |
| Base Year | 2025 |
| Estimated Year | 2026 |
| Forecast Period | 2026-2034 |
| Historical Period | 2020-2025 |
| Growth Rate | CAGR of 8.42% from 2020-2034 |
| Segmentation |
|
Table of Contents
- 1. Introduction
- 1.1. Research Scope
- 1.2. Market Segmentation
- 1.3. Research Objective
- 1.4. Definitions and Assumptions
- 2. Executive Summary
- 2.1. Market Snapshot
- 3. Market Dynamics
- 3.1. Market Drivers
- 3.2. Market Restrains
- 3.3. Market Trends
- 3.4. Market Opportunities
- 4. Market Factor Analysis
- 4.1. Porters Five Forces
- 4.1.1. Bargaining Power of Suppliers
- 4.1.2. Bargaining Power of Buyers
- 4.1.3. Threat of New Entrants
- 4.1.4. Threat of Substitutes
- 4.1.5. Competitive Rivalry
- 4.2. PESTEL analysis
- 4.3. BCG Analysis
- 4.3.1. Stars (High Growth, High Market Share)
- 4.3.2. Cash Cows (Low Growth, High Market Share)
- 4.3.3. Question Mark (High Growth, Low Market Share)
- 4.3.4. Dogs (Low Growth, Low Market Share)
- 4.4. Ansoff Matrix Analysis
- 4.5. Supply Chain Analysis
- 4.6. Regulatory Landscape
- 4.7. Current Market Potential and Opportunity Assessment (TAM–SAM–SOM Framework)
- 4.8. MSR Analyst Note
- 4.1. Porters Five Forces
- 5. Market Analysis, Insights and Forecast 2021-2033
- 5.1. Market Analysis, Insights and Forecast - by Type
- 5.1.1. Natural Graphite
- 5.1.2. Synthetic Graphite
- 5.2. Market Analysis, Insights and Forecast - by Application
- 5.2.1. Electrodes
- 5.2.2. Refractories, Casting, and Foundries
- 5.2.3. Batteries
- 5.2.4. Lubricants
- 5.2.5. Other Applications
- 5.3. Market Analysis, Insights and Forecast - by End-user Industry
- 5.3.1. Electronics
- 5.3.2. Metallurgy
- 5.3.3. Automotive (Includes EV/HEV Vehicles)
- 5.3.4. Other End-user Industries
- 5.4. Market Analysis, Insights and Forecast - by Region
- 5.4.1. Asia Pacific
- 5.4.2. North America
- 5.4.3. Europe
- 5.4.4. South America
- 5.4.5. Middle East and Africa
- 5.1. Market Analysis, Insights and Forecast - by Type
- 6. Global Graphite Market Analysis, Insights and Forecast, 2021-2033
- 6.1. Market Analysis, Insights and Forecast - by Type
- 6.1.1. Natural Graphite
- 6.1.2. Synthetic Graphite
- 6.2. Market Analysis, Insights and Forecast - by Application
- 6.2.1. Electrodes
- 6.2.2. Refractories, Casting, and Foundries
- 6.2.3. Batteries
- 6.2.4. Lubricants
- 6.2.5. Other Applications
- 6.3. Market Analysis, Insights and Forecast - by End-user Industry
- 6.3.1. Electronics
- 6.3.2. Metallurgy
- 6.3.3. Automotive (Includes EV/HEV Vehicles)
- 6.3.4. Other End-user Industries
- 6.1. Market Analysis, Insights and Forecast - by Type
- 7. Asia Pacific Graphite Market Analysis, Insights and Forecast, 2020-2032
- 7.1. Market Analysis, Insights and Forecast - by Type
- 7.1.1. Natural Graphite
- 7.1.2. Synthetic Graphite
- 7.2. Market Analysis, Insights and Forecast - by Application
- 7.2.1. Electrodes
- 7.2.2. Refractories, Casting, and Foundries
- 7.2.3. Batteries
- 7.2.4. Lubricants
- 7.2.5. Other Applications
- 7.3. Market Analysis, Insights and Forecast - by End-user Industry
- 7.3.1. Electronics
- 7.3.2. Metallurgy
- 7.3.3. Automotive (Includes EV/HEV Vehicles)
- 7.3.4. Other End-user Industries
- 7.1. Market Analysis, Insights and Forecast - by Type
- 8. North America Graphite Market Analysis, Insights and Forecast, 2020-2032
- 8.1. Market Analysis, Insights and Forecast - by Type
- 8.1.1. Natural Graphite
- 8.1.2. Synthetic Graphite
- 8.2. Market Analysis, Insights and Forecast - by Application
- 8.2.1. Electrodes
- 8.2.2. Refractories, Casting, and Foundries
- 8.2.3. Batteries
- 8.2.4. Lubricants
- 8.2.5. Other Applications
- 8.3. Market Analysis, Insights and Forecast - by End-user Industry
- 8.3.1. Electronics
- 8.3.2. Metallurgy
- 8.3.3. Automotive (Includes EV/HEV Vehicles)
- 8.3.4. Other End-user Industries
- 8.1. Market Analysis, Insights and Forecast - by Type
- 9. Europe Graphite Market Analysis, Insights and Forecast, 2020-2032
- 9.1. Market Analysis, Insights and Forecast - by Type
- 9.1.1. Natural Graphite
- 9.1.2. Synthetic Graphite
- 9.2. Market Analysis, Insights and Forecast - by Application
- 9.2.1. Electrodes
- 9.2.2. Refractories, Casting, and Foundries
- 9.2.3. Batteries
- 9.2.4. Lubricants
- 9.2.5. Other Applications
- 9.3. Market Analysis, Insights and Forecast - by End-user Industry
- 9.3.1. Electronics
- 9.3.2. Metallurgy
- 9.3.3. Automotive (Includes EV/HEV Vehicles)
- 9.3.4. Other End-user Industries
- 9.1. Market Analysis, Insights and Forecast - by Type
- 10. South America Graphite Market Analysis, Insights and Forecast, 2020-2032
- 10.1. Market Analysis, Insights and Forecast - by Type
- 10.1.1. Natural Graphite
- 10.1.2. Synthetic Graphite
- 10.2. Market Analysis, Insights and Forecast - by Application
- 10.2.1. Electrodes
- 10.2.2. Refractories, Casting, and Foundries
- 10.2.3. Batteries
- 10.2.4. Lubricants
- 10.2.5. Other Applications
- 10.3. Market Analysis, Insights and Forecast - by End-user Industry
- 10.3.1. Electronics
- 10.3.2. Metallurgy
- 10.3.3. Automotive (Includes EV/HEV Vehicles)
- 10.3.4. Other End-user Industries
- 10.1. Market Analysis, Insights and Forecast - by Type
- 11. Middle East and Africa Graphite Market Analysis, Insights and Forecast, 2020-2032
- 11.1. Market Analysis, Insights and Forecast - by Type
- 11.1.1. Natural Graphite
- 11.1.2. Synthetic Graphite
- 11.2. Market Analysis, Insights and Forecast - by Application
- 11.2.1. Electrodes
- 11.2.2. Refractories, Casting, and Foundries
- 11.2.3. Batteries
- 11.2.4. Lubricants
- 11.2.5. Other Applications
- 11.3. Market Analysis, Insights and Forecast - by End-user Industry
- 11.3.1. Electronics
- 11.3.2. Metallurgy
- 11.3.3. Automotive (Includes EV/HEV Vehicles)
- 11.3.4. Other End-user Industries
- 11.1. Market Analysis, Insights and Forecast - by Type
- 12. Competitive Analysis
- 12.1. Company Profiles
- 12.1.1 SGL Carbon
- 12.1.1.1. Company Overview
- 12.1.1.2. Products
- 12.1.1.3. Company Financials
- 12.1.1.4. SWOT Analysis
- 12.1.2 Showa Denko K k
- 12.1.2.1. Company Overview
- 12.1.2.2. Products
- 12.1.2.3. Company Financials
- 12.1.2.4. SWOT Analysis
- 12.1.3 Asbury Carbons
- 12.1.3.1. Company Overview
- 12.1.3.2. Products
- 12.1.3.3. Company Financials
- 12.1.3.4. SWOT Analysis
- 12.1.4 Tokai Carbon Co Ltd
- 12.1.4.1. Company Overview
- 12.1.4.2. Products
- 12.1.4.3. Company Financials
- 12.1.4.4. SWOT Analysis
- 12.1.5 Northern Graphite Corp
- 12.1.5.1. Company Overview
- 12.1.5.2. Products
- 12.1.5.3. Company Financials
- 12.1.5.4. SWOT Analysis
- 12.1.6 Mason Graphite Inc
- 12.1.6.1. Company Overview
- 12.1.6.2. Products
- 12.1.6.3. Company Financials
- 12.1.6.4. SWOT Analysis
- 12.1.7 Triton Minerals
- 12.1.7.1. Company Overview
- 12.1.7.2. Products
- 12.1.7.3. Company Financials
- 12.1.7.4. SWOT Analysis
- 12.1.8 BTR New Material Group Co Ltd
- 12.1.8.1. Company Overview
- 12.1.8.2. Products
- 12.1.8.3. Company Financials
- 12.1.8.4. SWOT Analysis
- 12.1.9 Jiangxi Zichen Technology Co Ltd
- 12.1.9.1. Company Overview
- 12.1.9.2. Products
- 12.1.9.3. Company Financials
- 12.1.9.4. SWOT Analysis
- 12.1.10 Imerys
- 12.1.10.1. Company Overview
- 12.1.10.2. Products
- 12.1.10.3. Company Financials
- 12.1.10.4. SWOT Analysis
- 12.1.11 Shanghai Shanshan Technology Co Ltd
- 12.1.11.1. Company Overview
- 12.1.11.2. Products
- 12.1.11.3. Company Financials
- 12.1.11.4. SWOT Analysis
- 12.1.12 Syrah Resources Limited
- 12.1.12.1. Company Overview
- 12.1.12.2. Products
- 12.1.12.3. Company Financials
- 12.1.12.4. SWOT Analysis
- 12.1.13 Shenzhen Xiangfenghua Technology Co Ltd
- 12.1.13.1. Company Overview
- 12.1.13.2. Products
- 12.1.13.3. Company Financials
- 12.1.13.4. SWOT Analysis
- 12.1.14 Nippon Kokuen Group
- 12.1.14.1. Company Overview
- 12.1.14.2. Products
- 12.1.14.3. Company Financials
- 12.1.14.4. SWOT Analysis
- 12.1.1 SGL Carbon
- 12.2. Market Entropy
- 12.2.1 Company's Key Areas Served
- 12.2.2 Recent Developments
- 12.3. Company Market Share Analysis 2025
- 12.3.1 Top 5 Companies Market Share Analysis
- 12.3.2 Top 3 Companies Market Share Analysis
- 12.4. List of Potential Customers
- 13. Research Methodology
List of Figures
- Figure 1: Global Graphite Market Revenue Breakdown (billion, %) by Region 2025 & 2033
- Figure 2: Global Graphite Market Volume Breakdown (K Tons, %) by Region 2025 & 2033
- Figure 3: Asia Pacific Graphite Market Revenue (billion), by Type 2025 & 2033
- Figure 4: Asia Pacific Graphite Market Volume (K Tons), by Type 2025 & 2033
- Figure 5: Asia Pacific Graphite Market Revenue Share (%), by Type 2025 & 2033
- Figure 6: Asia Pacific Graphite Market Volume Share (%), by Type 2025 & 2033
- Figure 7: Asia Pacific Graphite Market Revenue (billion), by Application 2025 & 2033
- Figure 8: Asia Pacific Graphite Market Volume (K Tons), by Application 2025 & 2033
- Figure 9: Asia Pacific Graphite Market Revenue Share (%), by Application 2025 & 2033
- Figure 10: Asia Pacific Graphite Market Volume Share (%), by Application 2025 & 2033
- Figure 11: Asia Pacific Graphite Market Revenue (billion), by End-user Industry 2025 & 2033
- Figure 12: Asia Pacific Graphite Market Volume (K Tons), by End-user Industry 2025 & 2033
- Figure 13: Asia Pacific Graphite Market Revenue Share (%), by End-user Industry 2025 & 2033
- Figure 14: Asia Pacific Graphite Market Volume Share (%), by End-user Industry 2025 & 2033
- Figure 15: Asia Pacific Graphite Market Revenue (billion), by Country 2025 & 2033
- Figure 16: Asia Pacific Graphite Market Volume (K Tons), by Country 2025 & 2033
- Figure 17: Asia Pacific Graphite Market Revenue Share (%), by Country 2025 & 2033
- Figure 18: Asia Pacific Graphite Market Volume Share (%), by Country 2025 & 2033
- Figure 19: North America Graphite Market Revenue (billion), by Type 2025 & 2033
- Figure 20: North America Graphite Market Volume (K Tons), by Type 2025 & 2033
- Figure 21: North America Graphite Market Revenue Share (%), by Type 2025 & 2033
- Figure 22: North America Graphite Market Volume Share (%), by Type 2025 & 2033
- Figure 23: North America Graphite Market Revenue (billion), by Application 2025 & 2033
- Figure 24: North America Graphite Market Volume (K Tons), by Application 2025 & 2033
- Figure 25: North America Graphite Market Revenue Share (%), by Application 2025 & 2033
- Figure 26: North America Graphite Market Volume Share (%), by Application 2025 & 2033
- Figure 27: North America Graphite Market Revenue (billion), by End-user Industry 2025 & 2033
- Figure 28: North America Graphite Market Volume (K Tons), by End-user Industry 2025 & 2033
- Figure 29: North America Graphite Market Revenue Share (%), by End-user Industry 2025 & 2033
- Figure 30: North America Graphite Market Volume Share (%), by End-user Industry 2025 & 2033
- Figure 31: North America Graphite Market Revenue (billion), by Country 2025 & 2033
- Figure 32: North America Graphite Market Volume (K Tons), by Country 2025 & 2033
- Figure 33: North America Graphite Market Revenue Share (%), by Country 2025 & 2033
- Figure 34: North America Graphite Market Volume Share (%), by Country 2025 & 2033
- Figure 35: Europe Graphite Market Revenue (billion), by Type 2025 & 2033
- Figure 36: Europe Graphite Market Volume (K Tons), by Type 2025 & 2033
- Figure 37: Europe Graphite Market Revenue Share (%), by Type 2025 & 2033
- Figure 38: Europe Graphite Market Volume Share (%), by Type 2025 & 2033
- Figure 39: Europe Graphite Market Revenue (billion), by Application 2025 & 2033
- Figure 40: Europe Graphite Market Volume (K Tons), by Application 2025 & 2033
- Figure 41: Europe Graphite Market Revenue Share (%), by Application 2025 & 2033
- Figure 42: Europe Graphite Market Volume Share (%), by Application 2025 & 2033
- Figure 43: Europe Graphite Market Revenue (billion), by End-user Industry 2025 & 2033
- Figure 44: Europe Graphite Market Volume (K Tons), by End-user Industry 2025 & 2033
- Figure 45: Europe Graphite Market Revenue Share (%), by End-user Industry 2025 & 2033
- Figure 46: Europe Graphite Market Volume Share (%), by End-user Industry 2025 & 2033
- Figure 47: Europe Graphite Market Revenue (billion), by Country 2025 & 2033
- Figure 48: Europe Graphite Market Volume (K Tons), by Country 2025 & 2033
- Figure 49: Europe Graphite Market Revenue Share (%), by Country 2025 & 2033
- Figure 50: Europe Graphite Market Volume Share (%), by Country 2025 & 2033
- Figure 51: South America Graphite Market Revenue (billion), by Type 2025 & 2033
- Figure 52: South America Graphite Market Volume (K Tons), by Type 2025 & 2033
- Figure 53: South America Graphite Market Revenue Share (%), by Type 2025 & 2033
- Figure 54: South America Graphite Market Volume Share (%), by Type 2025 & 2033
- Figure 55: South America Graphite Market Revenue (billion), by Application 2025 & 2033
- Figure 56: South America Graphite Market Volume (K Tons), by Application 2025 & 2033
- Figure 57: South America Graphite Market Revenue Share (%), by Application 2025 & 2033
- Figure 58: South America Graphite Market Volume Share (%), by Application 2025 & 2033
- Figure 59: South America Graphite Market Revenue (billion), by End-user Industry 2025 & 2033
- Figure 60: South America Graphite Market Volume (K Tons), by End-user Industry 2025 & 2033
- Figure 61: South America Graphite Market Revenue Share (%), by End-user Industry 2025 & 2033
- Figure 62: South America Graphite Market Volume Share (%), by End-user Industry 2025 & 2033
- Figure 63: South America Graphite Market Revenue (billion), by Country 2025 & 2033
- Figure 64: South America Graphite Market Volume (K Tons), by Country 2025 & 2033
- Figure 65: South America Graphite Market Revenue Share (%), by Country 2025 & 2033
- Figure 66: South America Graphite Market Volume Share (%), by Country 2025 & 2033
- Figure 67: Middle East and Africa Graphite Market Revenue (billion), by Type 2025 & 2033
- Figure 68: Middle East and Africa Graphite Market Volume (K Tons), by Type 2025 & 2033
- Figure 69: Middle East and Africa Graphite Market Revenue Share (%), by Type 2025 & 2033
- Figure 70: Middle East and Africa Graphite Market Volume Share (%), by Type 2025 & 2033
- Figure 71: Middle East and Africa Graphite Market Revenue (billion), by Application 2025 & 2033
- Figure 72: Middle East and Africa Graphite Market Volume (K Tons), by Application 2025 & 2033
- Figure 73: Middle East and Africa Graphite Market Revenue Share (%), by Application 2025 & 2033
- Figure 74: Middle East and Africa Graphite Market Volume Share (%), by Application 2025 & 2033
- Figure 75: Middle East and Africa Graphite Market Revenue (billion), by End-user Industry 2025 & 2033
- Figure 76: Middle East and Africa Graphite Market Volume (K Tons), by End-user Industry 2025 & 2033
- Figure 77: Middle East and Africa Graphite Market Revenue Share (%), by End-user Industry 2025 & 2033
- Figure 78: Middle East and Africa Graphite Market Volume Share (%), by End-user Industry 2025 & 2033
- Figure 79: Middle East and Africa Graphite Market Revenue (billion), by Country 2025 & 2033
- Figure 80: Middle East and Africa Graphite Market Volume (K Tons), by Country 2025 & 2033
- Figure 81: Middle East and Africa Graphite Market Revenue Share (%), by Country 2025 & 2033
- Figure 82: Middle East and Africa Graphite Market Volume Share (%), by Country 2025 & 2033
List of Tables
- Table 1: Global Graphite Market Revenue billion Forecast, by Type 2020 & 2033
- Table 2: Global Graphite Market Volume K Tons Forecast, by Type 2020 & 2033
- Table 3: Global Graphite Market Revenue billion Forecast, by Application 2020 & 2033
- Table 4: Global Graphite Market Volume K Tons Forecast, by Application 2020 & 2033
- Table 5: Global Graphite Market Revenue billion Forecast, by End-user Industry 2020 & 2033
- Table 6: Global Graphite Market Volume K Tons Forecast, by End-user Industry 2020 & 2033
- Table 7: Global Graphite Market Revenue billion Forecast, by Region 2020 & 2033
- Table 8: Global Graphite Market Volume K Tons Forecast, by Region 2020 & 2033
- Table 9: Global Graphite Market Revenue billion Forecast, by Type 2020 & 2033
- Table 10: Global Graphite Market Volume K Tons Forecast, by Type 2020 & 2033
- Table 11: Global Graphite Market Revenue billion Forecast, by Application 2020 & 2033
- Table 12: Global Graphite Market Volume K Tons Forecast, by Application 2020 & 2033
- Table 13: Global Graphite Market Revenue billion Forecast, by End-user Industry 2020 & 2033
- Table 14: Global Graphite Market Volume K Tons Forecast, by End-user Industry 2020 & 2033
- Table 15: Global Graphite Market Revenue billion Forecast, by Country 2020 & 2033
- Table 16: Global Graphite Market Volume K Tons Forecast, by Country 2020 & 2033
- Table 17: China Graphite Market Revenue (billion) Forecast, by Application 2020 & 2033
- Table 18: China Graphite Market Volume (K Tons) Forecast, by Application 2020 & 2033
- Table 19: India Graphite Market Revenue (billion) Forecast, by Application 2020 & 2033
- Table 20: India Graphite Market Volume (K Tons) Forecast, by Application 2020 & 2033
- Table 21: Japan Graphite Market Revenue (billion) Forecast, by Application 2020 & 2033
- Table 22: Japan Graphite Market Volume (K Tons) Forecast, by Application 2020 & 2033
- Table 23: South Korea Graphite Market Revenue (billion) Forecast, by Application 2020 & 2033
- Table 24: South Korea Graphite Market Volume (K Tons) Forecast, by Application 2020 & 2033
- Table 25: Rest of Asia Pacific Graphite Market Revenue (billion) Forecast, by Application 2020 & 2033
- Table 26: Rest of Asia Pacific Graphite Market Volume (K Tons) Forecast, by Application 2020 & 2033
- Table 27: Global Graphite Market Revenue billion Forecast, by Type 2020 & 2033
- Table 28: Global Graphite Market Volume K Tons Forecast, by Type 2020 & 2033
- Table 29: Global Graphite Market Revenue billion Forecast, by Application 2020 & 2033
- Table 30: Global Graphite Market Volume K Tons Forecast, by Application 2020 & 2033
- Table 31: Global Graphite Market Revenue billion Forecast, by End-user Industry 2020 & 2033
- Table 32: Global Graphite Market Volume K Tons Forecast, by End-user Industry 2020 & 2033
- Table 33: Global Graphite Market Revenue billion Forecast, by Country 2020 & 2033
- Table 34: Global Graphite Market Volume K Tons Forecast, by Country 2020 & 2033
- Table 35: United States Graphite Market Revenue (billion) Forecast, by Application 2020 & 2033
- Table 36: United States Graphite Market Volume (K Tons) Forecast, by Application 2020 & 2033
- Table 37: Canada Graphite Market Revenue (billion) Forecast, by Application 2020 & 2033
- Table 38: Canada Graphite Market Volume (K Tons) Forecast, by Application 2020 & 2033
- Table 39: Mexico Graphite Market Revenue (billion) Forecast, by Application 2020 & 2033
- Table 40: Mexico Graphite Market Volume (K Tons) Forecast, by Application 2020 & 2033
- Table 41: Global Graphite Market Revenue billion Forecast, by Type 2020 & 2033
- Table 42: Global Graphite Market Volume K Tons Forecast, by Type 2020 & 2033
- Table 43: Global Graphite Market Revenue billion Forecast, by Application 2020 & 2033
- Table 44: Global Graphite Market Volume K Tons Forecast, by Application 2020 & 2033
- Table 45: Global Graphite Market Revenue billion Forecast, by End-user Industry 2020 & 2033
- Table 46: Global Graphite Market Volume K Tons Forecast, by End-user Industry 2020 & 2033
- Table 47: Global Graphite Market Revenue billion Forecast, by Country 2020 & 2033
- Table 48: Global Graphite Market Volume K Tons Forecast, by Country 2020 & 2033
- Table 49: Germany Graphite Market Revenue (billion) Forecast, by Application 2020 & 2033
- Table 50: Germany Graphite Market Volume (K Tons) Forecast, by Application 2020 & 2033
- Table 51: United Kingdom Graphite Market Revenue (billion) Forecast, by Application 2020 & 2033
- Table 52: United Kingdom Graphite Market Volume (K Tons) Forecast, by Application 2020 & 2033
- Table 53: Italy Graphite Market Revenue (billion) Forecast, by Application 2020 & 2033
- Table 54: Italy Graphite Market Volume (K Tons) Forecast, by Application 2020 & 2033
- Table 55: France Graphite Market Revenue (billion) Forecast, by Application 2020 & 2033
- Table 56: France Graphite Market Volume (K Tons) Forecast, by Application 2020 & 2033
- Table 57: Russia Graphite Market Revenue (billion) Forecast, by Application 2020 & 2033
- Table 58: Russia Graphite Market Volume (K Tons) Forecast, by Application 2020 & 2033
- Table 59: Rest of Europe Graphite Market Revenue (billion) Forecast, by Application 2020 & 2033
- Table 60: Rest of Europe Graphite Market Volume (K Tons) Forecast, by Application 2020 & 2033
- Table 61: Global Graphite Market Revenue billion Forecast, by Type 2020 & 2033
- Table 62: Global Graphite Market Volume K Tons Forecast, by Type 2020 & 2033
- Table 63: Global Graphite Market Revenue billion Forecast, by Application 2020 & 2033
- Table 64: Global Graphite Market Volume K Tons Forecast, by Application 2020 & 2033
- Table 65: Global Graphite Market Revenue billion Forecast, by End-user Industry 2020 & 2033
- Table 66: Global Graphite Market Volume K Tons Forecast, by End-user Industry 2020 & 2033
- Table 67: Global Graphite Market Revenue billion Forecast, by Country 2020 & 2033
- Table 68: Global Graphite Market Volume K Tons Forecast, by Country 2020 & 2033
- Table 69: Brazil Graphite Market Revenue (billion) Forecast, by Application 2020 & 2033
- Table 70: Brazil Graphite Market Volume (K Tons) Forecast, by Application 2020 & 2033
- Table 71: Argentina Graphite Market Revenue (billion) Forecast, by Application 2020 & 2033
- Table 72: Argentina Graphite Market Volume (K Tons) Forecast, by Application 2020 & 2033
- Table 73: Rest of South America Graphite Market Revenue (billion) Forecast, by Application 2020 & 2033
- Table 74: Rest of South America Graphite Market Volume (K Tons) Forecast, by Application 2020 & 2033
- Table 75: Global Graphite Market Revenue billion Forecast, by Type 2020 & 2033
- Table 76: Global Graphite Market Volume K Tons Forecast, by Type 2020 & 2033
- Table 77: Global Graphite Market Revenue billion Forecast, by Application 2020 & 2033
- Table 78: Global Graphite Market Volume K Tons Forecast, by Application 2020 & 2033
- Table 79: Global Graphite Market Revenue billion Forecast, by End-user Industry 2020 & 2033
- Table 80: Global Graphite Market Volume K Tons Forecast, by End-user Industry 2020 & 2033
- Table 81: Global Graphite Market Revenue billion Forecast, by Country 2020 & 2033
- Table 82: Global Graphite Market Volume K Tons Forecast, by Country 2020 & 2033
- Table 83: Saudi Arabia Graphite Market Revenue (billion) Forecast, by Application 2020 & 2033
- Table 84: Saudi Arabia Graphite Market Volume (K Tons) Forecast, by Application 2020 & 2033
- Table 85: South Africa Graphite Market Revenue (billion) Forecast, by Application 2020 & 2033
- Table 86: South Africa Graphite Market Volume (K Tons) Forecast, by Application 2020 & 2033
- Table 87: Rest of Middle East and Africa Graphite Market Revenue (billion) Forecast, by Application 2020 & 2033
- Table 88: Rest of Middle East and Africa Graphite Market Volume (K Tons) Forecast, by Application 2020 & 2033
Frequently Asked Questions
1. What is the projected Compound Annual Growth Rate (CAGR) of the Graphite Market?
The projected CAGR is approximately 8.42%.
2. Which companies are prominent players in the Graphite Market?
Key companies in the market include SGL Carbon, Showa Denko K k, Asbury Carbons, Tokai Carbon Co Ltd, Northern Graphite Corp, Mason Graphite Inc, Triton Minerals, BTR New Material Group Co Ltd, Jiangxi Zichen Technology Co Ltd, Imerys, Shanghai Shanshan Technology Co Ltd, Syrah Resources Limited, Shenzhen Xiangfenghua Technology Co Ltd, Nippon Kokuen Group.
3. What are the main segments of the Graphite Market?
The market segments include Type, Application, End-user Industry.
4. Can you provide details about the market size?
The market size is estimated to be USD 31.59 billion as of 2022.
5. What are some drivers contributing to market growth?
Augmenting Demand from the Burgeoning Lithium-ion Battery Industry; Increase In Steel Production in Asia and the Middle East.
6. What are the notable trends driving market growth?
The Metallurgy Segment is Expected to Dominate the Market.
7. Are there any restraints impacting market growth?
Stringent Environmental Regulations; Other Restraints.
8. Can you provide examples of recent developments in the market?
October 2022: Syrah Resources Ltd. announced it would supply a key lithium-ion battery component to South Korea's LG Energy Solution Ltd. According to the agreement, the company was to provide 2 kilotons per annum of graphite to LG Energy Solution Ltd. active anode material (AAM) from 2025 and increase it to at least 10 ktpa after its production capacity at its Vidalia facility in Louisiana.
9. What pricing options are available for accessing the report?
Pricing options include single-user, multi-user, and enterprise licenses priced at USD 4750, USD 5250, and USD 8750 respectively.
10. Is the market size provided in terms of value or volume?
The market size is provided in terms of value, measured in billion and volume, measured in K Tons.
11. Are there any specific market keywords associated with the report?
Yes, the market keyword associated with the report is "Graphite Market," which aids in identifying and referencing the specific market segment covered.
12. How do I determine which pricing option suits my needs best?
The pricing options vary based on user requirements and access needs. Individual users may opt for single-user licenses, while businesses requiring broader access may choose multi-user or enterprise licenses for cost-effective access to the report.
13. Are there any additional resources or data provided in the Graphite Market report?
While the report offers comprehensive insights, it's advisable to review the specific contents or supplementary materials provided to ascertain if additional resources or data are available.
14. How can I stay updated on further developments or reports in the Graphite Market?
To stay informed about further developments, trends, and reports in the Graphite Market, consider subscribing to industry newsletters, following relevant companies and organizations, or regularly checking reputable industry news sources and publications.
Methodology
Step 1 - Identification of Relevant Samples Size from Population Database


Step 2 - Approaches for Defining Global Market Size (Value, Volume* & Price*)

Note*: In applicable scenarios
Step 3 - Data Sources
Primary Research
- Web Analytics
- Survey Reports
- Research Institute
- Latest Research Reports
- Opinion Leaders
Secondary Research
- Annual Reports
- White Paper
- Latest Press Release
- Industry Association
- Paid Database
- Investor Presentations

Step 4 - Data Triangulation
Involves using different sources of information in order to increase the validity of a study
These sources are likely to be stakeholders in a program - participants, other researchers, program staff, other community members, and so on.
Then we put all data in single framework & apply various statistical tools to find out the dynamic on the market.
During the analysis stage, feedback from the stakeholder groups would be compared to determine areas of agreement as well as areas of divergence