

Key Insights
The global gum rosin market, valued at approximately $2632.6 million in 2025, is projected to experience robust expansion with a compound annual growth rate (CAGR) of 4.4% from 2025 to 2033. This growth is propelled by escalating demand across key applications, notably paper sizing, printing inks, and adhesives and sealants. The burgeoning construction industry and the expanding packaging sector further stimulate market advancement, leveraging rosin's extensive utility. Additionally, the increasing adoption of sustainable and bio-based materials bolsters the gum rosin market's positive trajectory, owing to its renewable origin from pine trees. Challenges include raw material price volatility and the availability of synthetic substitutes. Regionally, Asia-Pacific exhibits strong growth, spearheaded by China and India's dynamic economies and substantial rosin consumption. North America and Europe remain significant markets, though their growth may be moderated by market saturation and competition from synthetic alternatives. Key market participants are pursuing strategic expansion, including partnerships and capacity investments, to secure market share and meet rising demand.
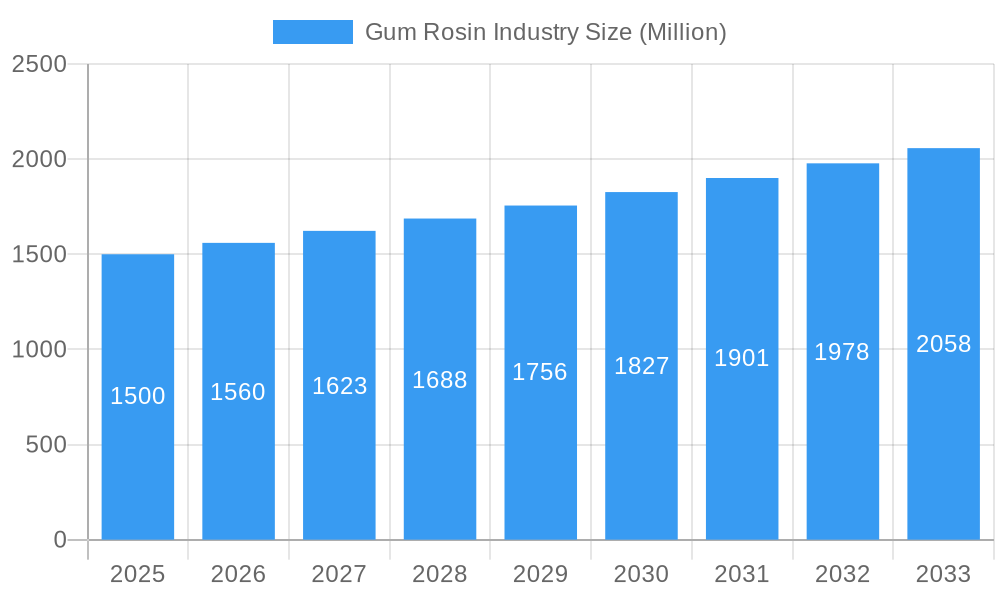
Gum Rosin Industry Market Size (In Billion)
Within application segmentation, paper sizing currently leads the market, driven by rosin's critical role in improving paper strength and printability. However, the growing demand for adhesives and sealants in construction and packaging applications is expected to significantly propel the growth of this segment. The competitive landscape is characterized by a fragmented structure with numerous global players. These entities prioritize innovation and product differentiation to maintain a competitive advantage. Future expansion hinges on sustained demand from core application areas, effective management of raw material costs, and the exploration of novel applications in emerging sectors. Continuous research and development focused on enhancing rosin's performance and creating value-added derivatives will be instrumental in driving further market growth.
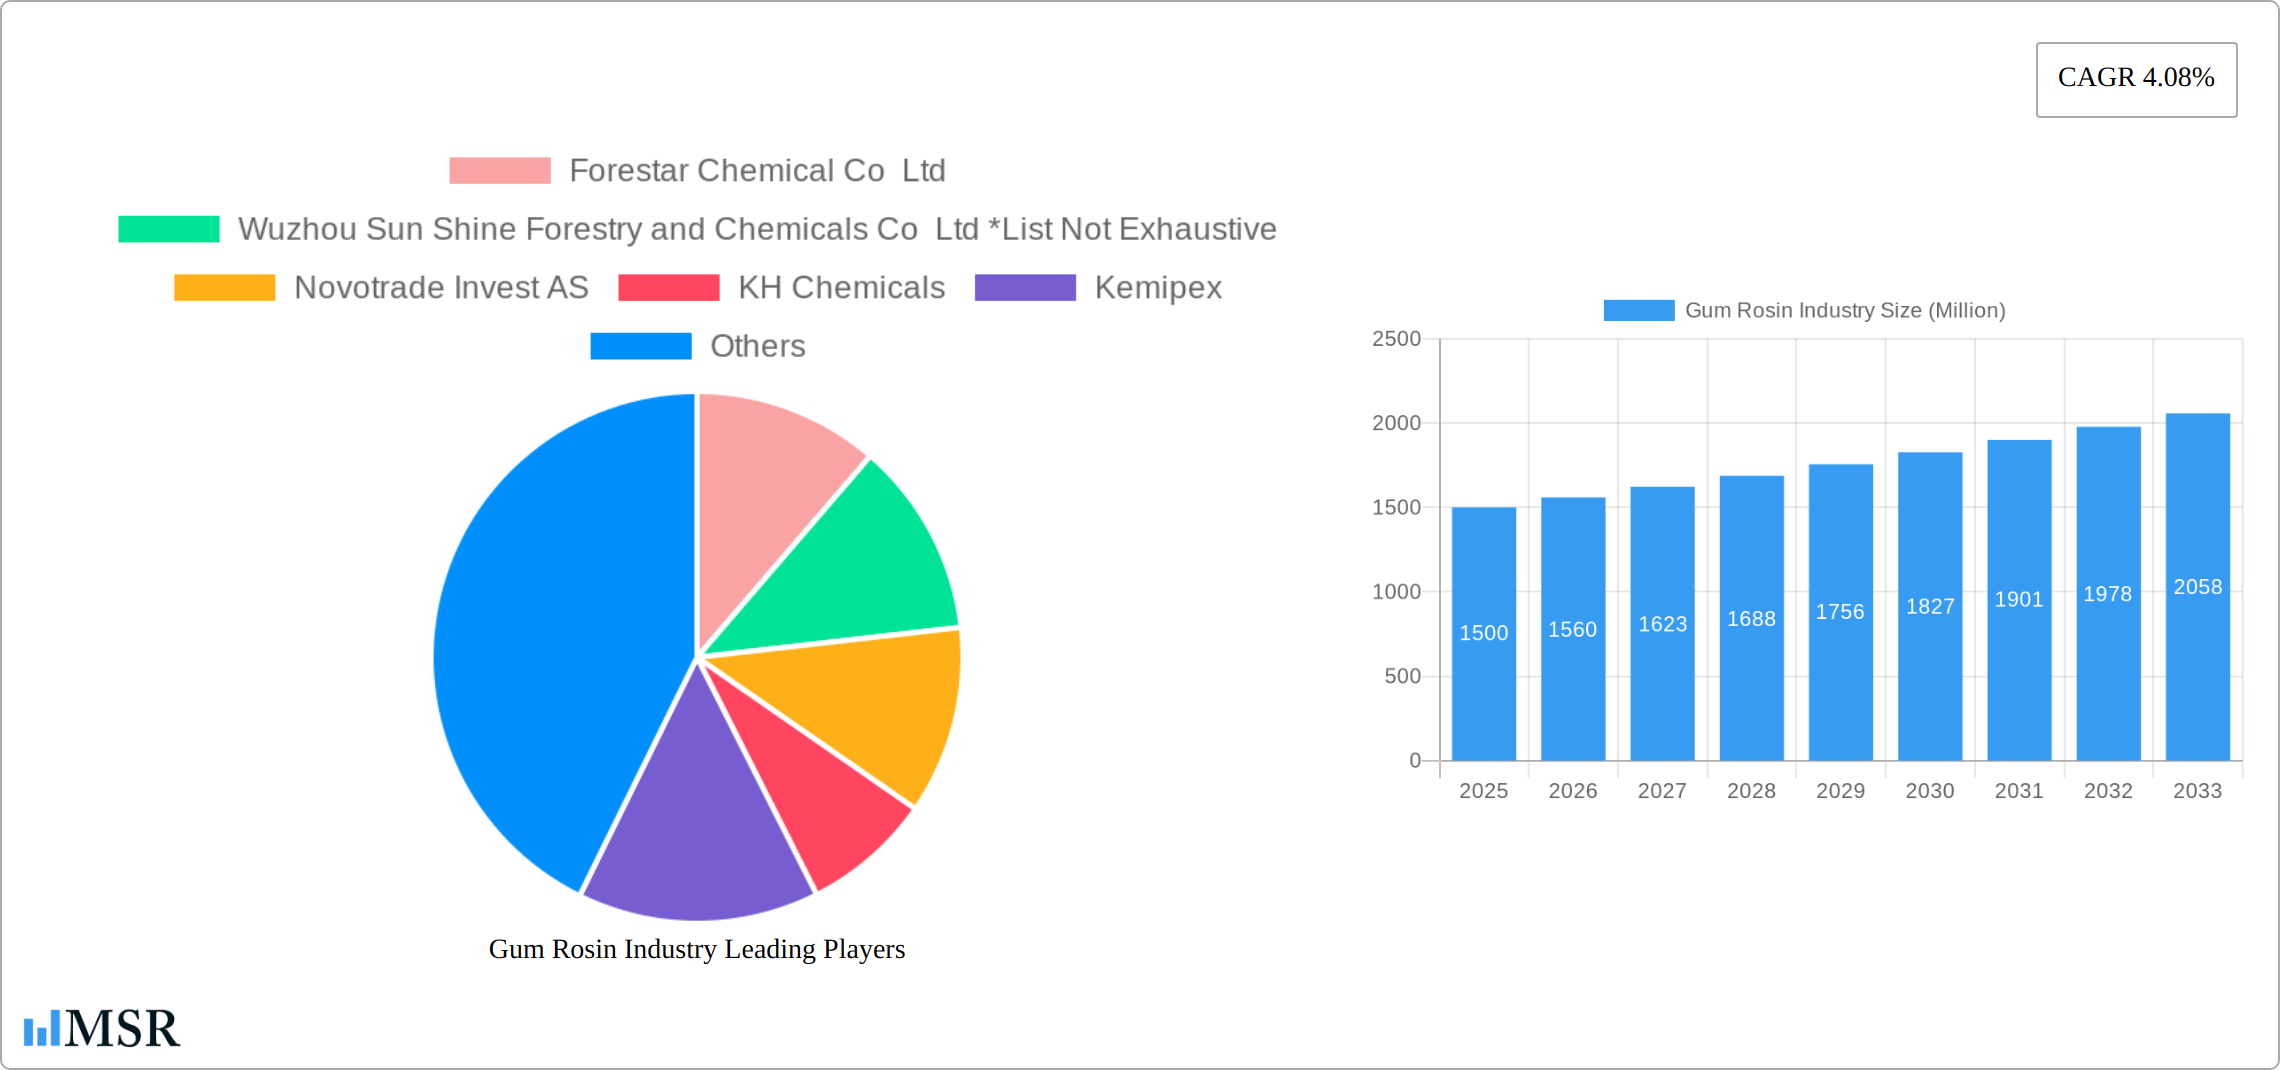
Gum Rosin Industry Company Market Share
Gum Rosin Industry: A Comprehensive Market Report (2019-2033)
This comprehensive report provides a detailed analysis of the global Gum Rosin industry, offering invaluable insights for stakeholders seeking to navigate this dynamic market. Covering the period from 2019 to 2033, with a focus on 2025, this report unveils key trends, challenges, and opportunities shaping the future of Gum Rosin production and consumption. The study incorporates detailed market sizing, forecasts, and competitive landscapes, incorporating data from key players like Forestar Chemical Co Ltd, Wuzhou Sun Shine Forestry and Chemicals Co Ltd, Novotrade Invest AS, KH Chemicals, Kemipex, PT INDOPICRI (Indonesia Pine Chemical Industri), Harima Chemicals Group Inc, Guangxi Dinghong Resin Co Ltd, Finjetchemical Co Ltd, Silver Fern Chemical Inc, Guangxi Tone Resin Chemical Co Ltd, United Resins, Foreverest Resources Ltd, Arakawa Chemical Industries Ltd, and DRT (Dérivés Résiniques et Terpéniques). The report's findings are crucial for strategic decision-making, investment planning, and competitive advantage in this evolving market. The total market size is estimated at xx Million in 2025.
Gum Rosin Industry Market Concentration & Dynamics
This section assesses the competitive landscape of the Gum Rosin market, examining market concentration, innovation, regulations, substitute products, end-user trends, and mergers and acquisitions (M&A) activity. The global Gum Rosin market exhibits a moderately concentrated structure, with the top five players holding an estimated xx% market share in 2025. Innovation within the industry focuses on improving rosin quality, developing sustainable sourcing practices, and expanding into new applications. Regulatory frameworks, varying by region, primarily address environmental concerns and product safety. Substitute products, such as synthetic resins, pose a competitive threat, although natural rosin maintains advantages in specific applications. End-user trends show increasing demand from the paper sizing and adhesives segments. M&A activity has been relatively low in recent years, with approximately xx deals recorded between 2019 and 2024.
- Market Share: Top 5 players hold approximately xx% of the market in 2025.
- M&A Activity: Approximately xx deals recorded between 2019 and 2024.
- Innovation Focus: Sustainable sourcing, improved quality, new applications.
- Regulatory Landscape: Varies by region, focusing on environmental impact and safety.
- Substitute Products: Synthetic resins are key competitors.
Gum Rosin Industry Industry Insights & Trends
The global gum rosin market is experiencing robust growth, fueled by increasing demand across diverse sectors. While precise market size figures fluctuate, the market demonstrates a significant and consistent Compound Annual Growth Rate (CAGR) throughout the forecast period (2025-2033), projected to reach [Insert Updated Market Size Estimate for 2025 and updated CAGR] by [Insert Updated Year]. This expansion is driven by several key factors. The burgeoning paper and packaging industry remains a major consumer, alongside the booming construction sector's reliance on gum rosin-based adhesives and sealants. Furthermore, the automotive industry's continued use of gum rosin in paints and coatings contributes significantly to market growth. Technological innovations, such as refined extraction and purification methods, are enhancing product quality and manufacturing efficiency, leading to greater market penetration. The growing consumer preference for sustainable and eco-friendly materials further propels market expansion. However, challenges persist, including raw material price volatility and the presence of substitute products, which may impact market growth trajectories.
Key Markets & Segments Leading Gum Rosin Industry
The Asia-Pacific region dominates the Gum Rosin market, driven by robust economic growth, expanding industrialization, and significant demand from China and India. Within applications, paper sizing holds the largest market share, followed by adhesives and sealants.
- Dominant Region: Asia-Pacific
- Dominant Segment: Paper Sizing
- Key Drivers:
- Asia-Pacific: Rapid economic growth, increasing industrialization, rising construction, and high paper consumption.
- Paper Sizing: Essential role in paper manufacturing, large scale paper production.
- Adhesives and Sealants: Growth driven by construction and packaging industries.
Gum Rosin Industry Product Developments
Recent advancements in the gum rosin industry center on the development of modified rosins exhibiting enhanced properties. These modifications focus on improving tack, adhesion, water resistance, and other performance characteristics. This innovation has broadened the application of gum rosin into specialized and high-value markets, including high-performance coatings, advanced adhesives, and other niche applications. These improvements provide manufacturers with a competitive edge in meeting the growing demand for superior, specialized products. Further research is exploring bio-based alternatives and sustainable sourcing methods to address environmental concerns and enhance the long-term sustainability of the industry.
Challenges in the Gum Rosin Industry Market
The Gum Rosin industry faces challenges including fluctuating raw material prices, competition from synthetic resins, and environmental regulations impacting sourcing and production. These factors can lead to price volatility and affect profit margins. Supply chain disruptions and transportation costs also pose significant challenges.
Forces Driving Gum Rosin Industry Growth
Several key factors contribute to the sustained growth of the gum rosin industry. The rising demand from rapidly developing economies represents a significant market expansion opportunity. Technological advancements continue to play a crucial role, yielding higher-quality and more specialized rosin products tailored to specific applications. The increasing global preference for natural and sustainable materials resonates strongly with the inherent bio-based nature of gum rosin, providing a compelling market advantage. Supportive government initiatives promoting sustainable forestry practices further contribute to the industry's growth and long-term viability. Moreover, ongoing research and development efforts are focused on improving the efficiency of extraction processes, minimizing waste, and developing new applications for this versatile material.
Long-Term Growth Catalysts in the Gum Rosin Industry
Long-term growth will be fueled by continuous innovation in rosin modification, strategic partnerships to secure sustainable raw material supplies, and expansions into new and emerging markets, particularly in developing economies with high growth potential.
Emerging Opportunities in Gum Rosin Industry
Emerging opportunities exist in developing bio-based and sustainable rosin products, exploring new applications in advanced materials and green technologies, and tapping into growing demand from specialized sectors like electronics and renewable energy.
Leading Players in the Gum Rosin Industry Sector
- Forestar Chemical Co Ltd
- Wuzhou Sun Shine Forestry and Chemicals Co Ltd
- Novotrade Invest AS
- KH Chemicals
- Kemipex
- PT INDOPICRI (Indonesia Pine Chemical Industri)
- Harima Chemicals Group Inc
- Guangxi Dinghong Resin Co Ltd
- Finjetchemical Co Ltd
- Silver Fern Chemical Inc
- Guangxi Tone Resin Chemical Co Ltd
- United Resins
- Foreverest Resources Ltd
- Arakawa Chemical Industries Ltd
- DRT (Dérivés Résiniques et Terpéniques)
Key Milestones in Gum Rosin Industry Industry
- 2020: Increased industry focus on sustainability and environmentally responsible sourcing practices.
- 2021: Launch of a new modified rosin with significantly enhanced adhesion properties by a leading manufacturer, expanding application possibilities.
- 2022: Substantial investments in research and development aimed at creating bio-based rosin alternatives and improving production efficiency.
- 2023: Acquisition of a smaller rosin producer by a larger multinational company, signifying industry consolidation and increased market share.
- [Insert Year]: [Insert Significant Recent Milestone - e.g., New patent filed, New market entry, etc.]
Strategic Outlook for Gum Rosin Industry Market
The Gum Rosin market presents significant long-term growth potential driven by ongoing innovation, expanding applications, and the increasing demand for sustainable materials. Companies that focus on sustainable sourcing, product diversification, and strategic partnerships will be well-positioned to capitalize on these opportunities.
Gum Rosin Industry Segmentation
-
1. Application
- 1.1. Paper Sizing
- 1.2. Printing Ink
- 1.3. Adhesives and Sealants
- 1.4. Rubber
- 1.5. Paints and Coatings
- 1.6. Other Applications
Gum Rosin Industry Segmentation By Geography
-
1. Asia Pacific
- 1.1. China
- 1.2. India
- 1.3. Japan
- 1.4. South Korea
- 1.5. Rest of Asia Pacific
-
2. North America
- 2.1. United States
- 2.2. Canada
- 2.3. Mexico
-
3. Europe
- 3.1. Germany
- 3.2. United Kingdom
- 3.3. Italy
- 3.4. France
- 3.5. Rest of Europe
-
4. South America
- 4.1. Brazil
- 4.2. Argentina
- 4.3. Rest of South America
-
5. Middle East and Africa
- 5.1. Saudi Arabia
- 5.2. South Africa
- 5.3. Rest of Middle East and Africa
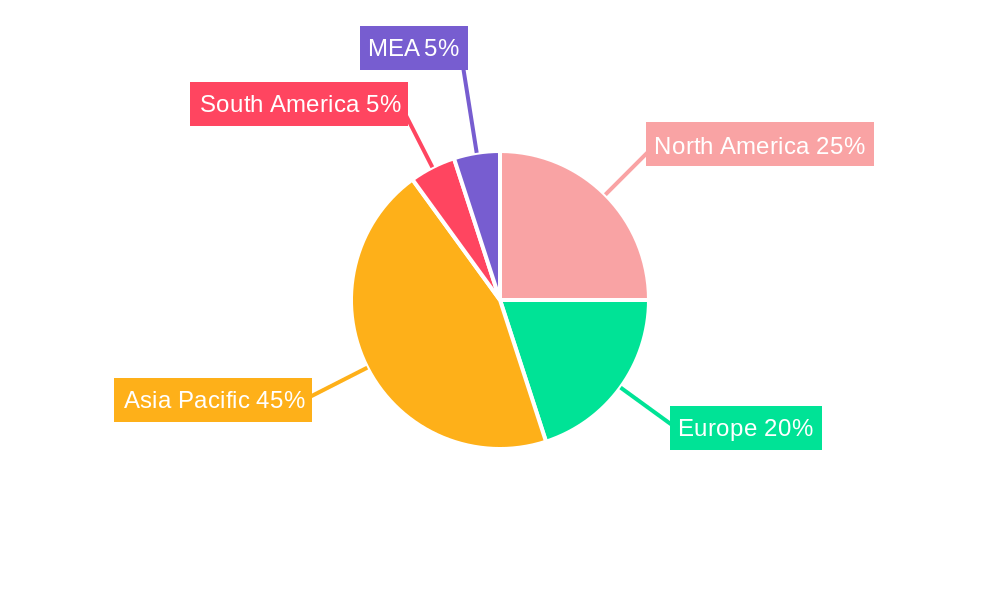
Gum Rosin Industry Regional Market Share
Geographic Coverage of Gum Rosin Industry
Gum Rosin Industry REPORT HIGHLIGHTS
| Aspects | Details |
|---|---|
| Study Period | 2020-2034 |
| Base Year | 2025 |
| Estimated Year | 2026 |
| Forecast Period | 2026-2034 |
| Historical Period | 2020-2025 |
| Growth Rate | CAGR of 4.4% from 2020-2034 |
| Segmentation |
|
Table of Contents
- 1. Introduction
- 1.1. Research Scope
- 1.2. Market Segmentation
- 1.3. Research Objective
- 1.4. Definitions and Assumptions
- 2. Executive Summary
- 2.1. Market Snapshot
- 3. Market Dynamics
- 3.1. Market Drivers
- 3.2. Market Restrains
- 3.3. Market Trends
- 3.4. Market Opportunities
- 4. Market Factor Analysis
- 4.1. Porters Five Forces
- 4.1.1. Bargaining Power of Suppliers
- 4.1.2. Bargaining Power of Buyers
- 4.1.3. Threat of New Entrants
- 4.1.4. Threat of Substitutes
- 4.1.5. Competitive Rivalry
- 4.2. PESTEL analysis
- 4.3. BCG Analysis
- 4.3.1. Stars (High Growth, High Market Share)
- 4.3.2. Cash Cows (Low Growth, High Market Share)
- 4.3.3. Question Mark (High Growth, Low Market Share)
- 4.3.4. Dogs (Low Growth, Low Market Share)
- 4.4. Ansoff Matrix Analysis
- 4.5. Supply Chain Analysis
- 4.6. Regulatory Landscape
- 4.7. Current Market Potential and Opportunity Assessment (TAM–SAM–SOM Framework)
- 4.8. MSR Analyst Note
- 4.1. Porters Five Forces
- 5. Market Analysis, Insights and Forecast 2021-2033
- 5.1. Market Analysis, Insights and Forecast - by Application
- 5.1.1. Paper Sizing
- 5.1.2. Printing Ink
- 5.1.3. Adhesives and Sealants
- 5.1.4. Rubber
- 5.1.5. Paints and Coatings
- 5.1.6. Other Applications
- 5.2. Market Analysis, Insights and Forecast - by Region
- 5.2.1. Asia Pacific
- 5.2.2. North America
- 5.2.3. Europe
- 5.2.4. South America
- 5.2.5. Middle East and Africa
- 5.1. Market Analysis, Insights and Forecast - by Application
- 6. Global Gum Rosin Industry Analysis, Insights and Forecast, 2021-2033
- 6.1. Market Analysis, Insights and Forecast - by Application
- 6.1.1. Paper Sizing
- 6.1.2. Printing Ink
- 6.1.3. Adhesives and Sealants
- 6.1.4. Rubber
- 6.1.5. Paints and Coatings
- 6.1.6. Other Applications
- 6.1. Market Analysis, Insights and Forecast - by Application
- 7. Asia Pacific Gum Rosin Industry Analysis, Insights and Forecast, 2020-2032
- 7.1. Market Analysis, Insights and Forecast - by Application
- 7.1.1. Paper Sizing
- 7.1.2. Printing Ink
- 7.1.3. Adhesives and Sealants
- 7.1.4. Rubber
- 7.1.5. Paints and Coatings
- 7.1.6. Other Applications
- 7.1. Market Analysis, Insights and Forecast - by Application
- 8. North America Gum Rosin Industry Analysis, Insights and Forecast, 2020-2032
- 8.1. Market Analysis, Insights and Forecast - by Application
- 8.1.1. Paper Sizing
- 8.1.2. Printing Ink
- 8.1.3. Adhesives and Sealants
- 8.1.4. Rubber
- 8.1.5. Paints and Coatings
- 8.1.6. Other Applications
- 8.1. Market Analysis, Insights and Forecast - by Application
- 9. Europe Gum Rosin Industry Analysis, Insights and Forecast, 2020-2032
- 9.1. Market Analysis, Insights and Forecast - by Application
- 9.1.1. Paper Sizing
- 9.1.2. Printing Ink
- 9.1.3. Adhesives and Sealants
- 9.1.4. Rubber
- 9.1.5. Paints and Coatings
- 9.1.6. Other Applications
- 9.1. Market Analysis, Insights and Forecast - by Application
- 10. South America Gum Rosin Industry Analysis, Insights and Forecast, 2020-2032
- 10.1. Market Analysis, Insights and Forecast - by Application
- 10.1.1. Paper Sizing
- 10.1.2. Printing Ink
- 10.1.3. Adhesives and Sealants
- 10.1.4. Rubber
- 10.1.5. Paints and Coatings
- 10.1.6. Other Applications
- 10.1. Market Analysis, Insights and Forecast - by Application
- 11. Middle East and Africa Gum Rosin Industry Analysis, Insights and Forecast, 2020-2032
- 11.1. Market Analysis, Insights and Forecast - by Application
- 11.1.1. Paper Sizing
- 11.1.2. Printing Ink
- 11.1.3. Adhesives and Sealants
- 11.1.4. Rubber
- 11.1.5. Paints and Coatings
- 11.1.6. Other Applications
- 11.1. Market Analysis, Insights and Forecast - by Application
- 12. Competitive Analysis
- 12.1. Company Profiles
- 12.1.1 Forestar Chemical Co Ltd
- 12.1.1.1. Company Overview
- 12.1.1.2. Products
- 12.1.1.3. Company Financials
- 12.1.1.4. SWOT Analysis
- 12.1.2 Wuzhou Sun Shine Forestry and Chemicals Co Ltd *List Not Exhaustive
- 12.1.2.1. Company Overview
- 12.1.2.2. Products
- 12.1.2.3. Company Financials
- 12.1.2.4. SWOT Analysis
- 12.1.3 Novotrade Invest AS
- 12.1.3.1. Company Overview
- 12.1.3.2. Products
- 12.1.3.3. Company Financials
- 12.1.3.4. SWOT Analysis
- 12.1.4 KH Chemicals
- 12.1.4.1. Company Overview
- 12.1.4.2. Products
- 12.1.4.3. Company Financials
- 12.1.4.4. SWOT Analysis
- 12.1.5 Kemipex
- 12.1.5.1. Company Overview
- 12.1.5.2. Products
- 12.1.5.3. Company Financials
- 12.1.5.4. SWOT Analysis
- 12.1.6 PT INDOPICRI ( Indonesia Pine Chemical Industri )
- 12.1.6.1. Company Overview
- 12.1.6.2. Products
- 12.1.6.3. Company Financials
- 12.1.6.4. SWOT Analysis
- 12.1.7 Harima Chemicals Group Inc
- 12.1.7.1. Company Overview
- 12.1.7.2. Products
- 12.1.7.3. Company Financials
- 12.1.7.4. SWOT Analysis
- 12.1.8 Guangxi Dinghong Resin Co Ltd
- 12.1.8.1. Company Overview
- 12.1.8.2. Products
- 12.1.8.3. Company Financials
- 12.1.8.4. SWOT Analysis
- 12.1.9 Finjetchemical Co Ltd
- 12.1.9.1. Company Overview
- 12.1.9.2. Products
- 12.1.9.3. Company Financials
- 12.1.9.4. SWOT Analysis
- 12.1.10 Silver Fern Chemical Inc
- 12.1.10.1. Company Overview
- 12.1.10.2. Products
- 12.1.10.3. Company Financials
- 12.1.10.4. SWOT Analysis
- 12.1.11 Guangxi Tone Resin Chemical Co Ltd
- 12.1.11.1. Company Overview
- 12.1.11.2. Products
- 12.1.11.3. Company Financials
- 12.1.11.4. SWOT Analysis
- 12.1.12 United Resins
- 12.1.12.1. Company Overview
- 12.1.12.2. Products
- 12.1.12.3. Company Financials
- 12.1.12.4. SWOT Analysis
- 12.1.13 Foreverest Resources Ltd
- 12.1.13.1. Company Overview
- 12.1.13.2. Products
- 12.1.13.3. Company Financials
- 12.1.13.4. SWOT Analysis
- 12.1.14 Arakawa Chemical Industries Ltd
- 12.1.14.1. Company Overview
- 12.1.14.2. Products
- 12.1.14.3. Company Financials
- 12.1.14.4. SWOT Analysis
- 12.1.15 DRT (Dérivés Résiniques et Terpéniques)
- 12.1.15.1. Company Overview
- 12.1.15.2. Products
- 12.1.15.3. Company Financials
- 12.1.15.4. SWOT Analysis
- 12.1.1 Forestar Chemical Co Ltd
- 12.2. Market Entropy
- 12.2.1 Company's Key Areas Served
- 12.2.2 Recent Developments
- 12.3. Company Market Share Analysis 2025
- 12.3.1 Top 5 Companies Market Share Analysis
- 12.3.2 Top 3 Companies Market Share Analysis
- 12.4. List of Potential Customers
- 13. Research Methodology
List of Figures
- Figure 1: Global Gum Rosin Industry Revenue Breakdown (million, %) by Region 2025 & 2033
- Figure 2: Global Gum Rosin Industry Volume Breakdown (K Tons, %) by Region 2025 & 2033
- Figure 3: Asia Pacific Gum Rosin Industry Revenue (million), by Application 2025 & 2033
- Figure 4: Asia Pacific Gum Rosin Industry Volume (K Tons), by Application 2025 & 2033
- Figure 5: Asia Pacific Gum Rosin Industry Revenue Share (%), by Application 2025 & 2033
- Figure 6: Asia Pacific Gum Rosin Industry Volume Share (%), by Application 2025 & 2033
- Figure 7: Asia Pacific Gum Rosin Industry Revenue (million), by Country 2025 & 2033
- Figure 8: Asia Pacific Gum Rosin Industry Volume (K Tons), by Country 2025 & 2033
- Figure 9: Asia Pacific Gum Rosin Industry Revenue Share (%), by Country 2025 & 2033
- Figure 10: Asia Pacific Gum Rosin Industry Volume Share (%), by Country 2025 & 2033
- Figure 11: North America Gum Rosin Industry Revenue (million), by Application 2025 & 2033
- Figure 12: North America Gum Rosin Industry Volume (K Tons), by Application 2025 & 2033
- Figure 13: North America Gum Rosin Industry Revenue Share (%), by Application 2025 & 2033
- Figure 14: North America Gum Rosin Industry Volume Share (%), by Application 2025 & 2033
- Figure 15: North America Gum Rosin Industry Revenue (million), by Country 2025 & 2033
- Figure 16: North America Gum Rosin Industry Volume (K Tons), by Country 2025 & 2033
- Figure 17: North America Gum Rosin Industry Revenue Share (%), by Country 2025 & 2033
- Figure 18: North America Gum Rosin Industry Volume Share (%), by Country 2025 & 2033
- Figure 19: Europe Gum Rosin Industry Revenue (million), by Application 2025 & 2033
- Figure 20: Europe Gum Rosin Industry Volume (K Tons), by Application 2025 & 2033
- Figure 21: Europe Gum Rosin Industry Revenue Share (%), by Application 2025 & 2033
- Figure 22: Europe Gum Rosin Industry Volume Share (%), by Application 2025 & 2033
- Figure 23: Europe Gum Rosin Industry Revenue (million), by Country 2025 & 2033
- Figure 24: Europe Gum Rosin Industry Volume (K Tons), by Country 2025 & 2033
- Figure 25: Europe Gum Rosin Industry Revenue Share (%), by Country 2025 & 2033
- Figure 26: Europe Gum Rosin Industry Volume Share (%), by Country 2025 & 2033
- Figure 27: South America Gum Rosin Industry Revenue (million), by Application 2025 & 2033
- Figure 28: South America Gum Rosin Industry Volume (K Tons), by Application 2025 & 2033
- Figure 29: South America Gum Rosin Industry Revenue Share (%), by Application 2025 & 2033
- Figure 30: South America Gum Rosin Industry Volume Share (%), by Application 2025 & 2033
- Figure 31: South America Gum Rosin Industry Revenue (million), by Country 2025 & 2033
- Figure 32: South America Gum Rosin Industry Volume (K Tons), by Country 2025 & 2033
- Figure 33: South America Gum Rosin Industry Revenue Share (%), by Country 2025 & 2033
- Figure 34: South America Gum Rosin Industry Volume Share (%), by Country 2025 & 2033
- Figure 35: Middle East and Africa Gum Rosin Industry Revenue (million), by Application 2025 & 2033
- Figure 36: Middle East and Africa Gum Rosin Industry Volume (K Tons), by Application 2025 & 2033
- Figure 37: Middle East and Africa Gum Rosin Industry Revenue Share (%), by Application 2025 & 2033
- Figure 38: Middle East and Africa Gum Rosin Industry Volume Share (%), by Application 2025 & 2033
- Figure 39: Middle East and Africa Gum Rosin Industry Revenue (million), by Country 2025 & 2033
- Figure 40: Middle East and Africa Gum Rosin Industry Volume (K Tons), by Country 2025 & 2033
- Figure 41: Middle East and Africa Gum Rosin Industry Revenue Share (%), by Country 2025 & 2033
- Figure 42: Middle East and Africa Gum Rosin Industry Volume Share (%), by Country 2025 & 2033
List of Tables
- Table 1: Global Gum Rosin Industry Revenue million Forecast, by Application 2020 & 2033
- Table 2: Global Gum Rosin Industry Volume K Tons Forecast, by Application 2020 & 2033
- Table 3: Global Gum Rosin Industry Revenue million Forecast, by Region 2020 & 2033
- Table 4: Global Gum Rosin Industry Volume K Tons Forecast, by Region 2020 & 2033
- Table 5: Global Gum Rosin Industry Revenue million Forecast, by Application 2020 & 2033
- Table 6: Global Gum Rosin Industry Volume K Tons Forecast, by Application 2020 & 2033
- Table 7: Global Gum Rosin Industry Revenue million Forecast, by Country 2020 & 2033
- Table 8: Global Gum Rosin Industry Volume K Tons Forecast, by Country 2020 & 2033
- Table 9: China Gum Rosin Industry Revenue (million) Forecast, by Application 2020 & 2033
- Table 10: China Gum Rosin Industry Volume (K Tons) Forecast, by Application 2020 & 2033
- Table 11: India Gum Rosin Industry Revenue (million) Forecast, by Application 2020 & 2033
- Table 12: India Gum Rosin Industry Volume (K Tons) Forecast, by Application 2020 & 2033
- Table 13: Japan Gum Rosin Industry Revenue (million) Forecast, by Application 2020 & 2033
- Table 14: Japan Gum Rosin Industry Volume (K Tons) Forecast, by Application 2020 & 2033
- Table 15: South Korea Gum Rosin Industry Revenue (million) Forecast, by Application 2020 & 2033
- Table 16: South Korea Gum Rosin Industry Volume (K Tons) Forecast, by Application 2020 & 2033
- Table 17: Rest of Asia Pacific Gum Rosin Industry Revenue (million) Forecast, by Application 2020 & 2033
- Table 18: Rest of Asia Pacific Gum Rosin Industry Volume (K Tons) Forecast, by Application 2020 & 2033
- Table 19: Global Gum Rosin Industry Revenue million Forecast, by Application 2020 & 2033
- Table 20: Global Gum Rosin Industry Volume K Tons Forecast, by Application 2020 & 2033
- Table 21: Global Gum Rosin Industry Revenue million Forecast, by Country 2020 & 2033
- Table 22: Global Gum Rosin Industry Volume K Tons Forecast, by Country 2020 & 2033
- Table 23: United States Gum Rosin Industry Revenue (million) Forecast, by Application 2020 & 2033
- Table 24: United States Gum Rosin Industry Volume (K Tons) Forecast, by Application 2020 & 2033
- Table 25: Canada Gum Rosin Industry Revenue (million) Forecast, by Application 2020 & 2033
- Table 26: Canada Gum Rosin Industry Volume (K Tons) Forecast, by Application 2020 & 2033
- Table 27: Mexico Gum Rosin Industry Revenue (million) Forecast, by Application 2020 & 2033
- Table 28: Mexico Gum Rosin Industry Volume (K Tons) Forecast, by Application 2020 & 2033
- Table 29: Global Gum Rosin Industry Revenue million Forecast, by Application 2020 & 2033
- Table 30: Global Gum Rosin Industry Volume K Tons Forecast, by Application 2020 & 2033
- Table 31: Global Gum Rosin Industry Revenue million Forecast, by Country 2020 & 2033
- Table 32: Global Gum Rosin Industry Volume K Tons Forecast, by Country 2020 & 2033
- Table 33: Germany Gum Rosin Industry Revenue (million) Forecast, by Application 2020 & 2033
- Table 34: Germany Gum Rosin Industry Volume (K Tons) Forecast, by Application 2020 & 2033
- Table 35: United Kingdom Gum Rosin Industry Revenue (million) Forecast, by Application 2020 & 2033
- Table 36: United Kingdom Gum Rosin Industry Volume (K Tons) Forecast, by Application 2020 & 2033
- Table 37: Italy Gum Rosin Industry Revenue (million) Forecast, by Application 2020 & 2033
- Table 38: Italy Gum Rosin Industry Volume (K Tons) Forecast, by Application 2020 & 2033
- Table 39: France Gum Rosin Industry Revenue (million) Forecast, by Application 2020 & 2033
- Table 40: France Gum Rosin Industry Volume (K Tons) Forecast, by Application 2020 & 2033
- Table 41: Rest of Europe Gum Rosin Industry Revenue (million) Forecast, by Application 2020 & 2033
- Table 42: Rest of Europe Gum Rosin Industry Volume (K Tons) Forecast, by Application 2020 & 2033
- Table 43: Global Gum Rosin Industry Revenue million Forecast, by Application 2020 & 2033
- Table 44: Global Gum Rosin Industry Volume K Tons Forecast, by Application 2020 & 2033
- Table 45: Global Gum Rosin Industry Revenue million Forecast, by Country 2020 & 2033
- Table 46: Global Gum Rosin Industry Volume K Tons Forecast, by Country 2020 & 2033
- Table 47: Brazil Gum Rosin Industry Revenue (million) Forecast, by Application 2020 & 2033
- Table 48: Brazil Gum Rosin Industry Volume (K Tons) Forecast, by Application 2020 & 2033
- Table 49: Argentina Gum Rosin Industry Revenue (million) Forecast, by Application 2020 & 2033
- Table 50: Argentina Gum Rosin Industry Volume (K Tons) Forecast, by Application 2020 & 2033
- Table 51: Rest of South America Gum Rosin Industry Revenue (million) Forecast, by Application 2020 & 2033
- Table 52: Rest of South America Gum Rosin Industry Volume (K Tons) Forecast, by Application 2020 & 2033
- Table 53: Global Gum Rosin Industry Revenue million Forecast, by Application 2020 & 2033
- Table 54: Global Gum Rosin Industry Volume K Tons Forecast, by Application 2020 & 2033
- Table 55: Global Gum Rosin Industry Revenue million Forecast, by Country 2020 & 2033
- Table 56: Global Gum Rosin Industry Volume K Tons Forecast, by Country 2020 & 2033
- Table 57: Saudi Arabia Gum Rosin Industry Revenue (million) Forecast, by Application 2020 & 2033
- Table 58: Saudi Arabia Gum Rosin Industry Volume (K Tons) Forecast, by Application 2020 & 2033
- Table 59: South Africa Gum Rosin Industry Revenue (million) Forecast, by Application 2020 & 2033
- Table 60: South Africa Gum Rosin Industry Volume (K Tons) Forecast, by Application 2020 & 2033
- Table 61: Rest of Middle East and Africa Gum Rosin Industry Revenue (million) Forecast, by Application 2020 & 2033
- Table 62: Rest of Middle East and Africa Gum Rosin Industry Volume (K Tons) Forecast, by Application 2020 & 2033
Frequently Asked Questions
1. What is the projected Compound Annual Growth Rate (CAGR) of the Gum Rosin Industry?
The projected CAGR is approximately 4.4%.
2. Which companies are prominent players in the Gum Rosin Industry?
Key companies in the market include Forestar Chemical Co Ltd, Wuzhou Sun Shine Forestry and Chemicals Co Ltd *List Not Exhaustive, Novotrade Invest AS, KH Chemicals, Kemipex, PT INDOPICRI ( Indonesia Pine Chemical Industri ), Harima Chemicals Group Inc, Guangxi Dinghong Resin Co Ltd, Finjetchemical Co Ltd, Silver Fern Chemical Inc, Guangxi Tone Resin Chemical Co Ltd, United Resins, Foreverest Resources Ltd, Arakawa Chemical Industries Ltd, DRT (Dérivés Résiniques et Terpéniques).
3. What are the main segments of the Gum Rosin Industry?
The market segments include Application.
4. Can you provide details about the market size?
The market size is estimated to be USD 2632.6 million as of 2022.
5. What are some drivers contributing to market growth?
Growing Demand for Bio-based Adhesives and Sealants; Burgeoning Paper Packaging Industry; Other Drivers.
6. What are the notable trends driving market growth?
The Adhesives and Sealants Segment is Expected to Dominate the Market.
7. Are there any restraints impacting market growth?
Shift of Interest toward Tall Oil Rosin-based Phenolic Resins; Other Restraints.
8. Can you provide examples of recent developments in the market?
N/A
9. What pricing options are available for accessing the report?
Pricing options include single-user, multi-user, and enterprise licenses priced at USD 4750, USD 5250, and USD 8750 respectively.
10. Is the market size provided in terms of value or volume?
The market size is provided in terms of value, measured in million and volume, measured in K Tons.
11. Are there any specific market keywords associated with the report?
Yes, the market keyword associated with the report is "Gum Rosin Industry," which aids in identifying and referencing the specific market segment covered.
12. How do I determine which pricing option suits my needs best?
The pricing options vary based on user requirements and access needs. Individual users may opt for single-user licenses, while businesses requiring broader access may choose multi-user or enterprise licenses for cost-effective access to the report.
13. Are there any additional resources or data provided in the Gum Rosin Industry report?
While the report offers comprehensive insights, it's advisable to review the specific contents or supplementary materials provided to ascertain if additional resources or data are available.
14. How can I stay updated on further developments or reports in the Gum Rosin Industry?
To stay informed about further developments, trends, and reports in the Gum Rosin Industry, consider subscribing to industry newsletters, following relevant companies and organizations, or regularly checking reputable industry news sources and publications.
Methodology
Step 1 - Identification of Relevant Samples Size from Population Database


Step 2 - Approaches for Defining Global Market Size (Value, Volume* & Price*)

Note*: In applicable scenarios
Step 3 - Data Sources
Primary Research
- Web Analytics
- Survey Reports
- Research Institute
- Latest Research Reports
- Opinion Leaders
Secondary Research
- Annual Reports
- White Paper
- Latest Press Release
- Industry Association
- Paid Database
- Investor Presentations

Step 4 - Data Triangulation
Involves using different sources of information in order to increase the validity of a study
These sources are likely to be stakeholders in a program - participants, other researchers, program staff, other community members, and so on.
Then we put all data in single framework & apply various statistical tools to find out the dynamic on the market.
During the analysis stage, feedback from the stakeholder groups would be compared to determine areas of agreement as well as areas of divergence