

Key Insights
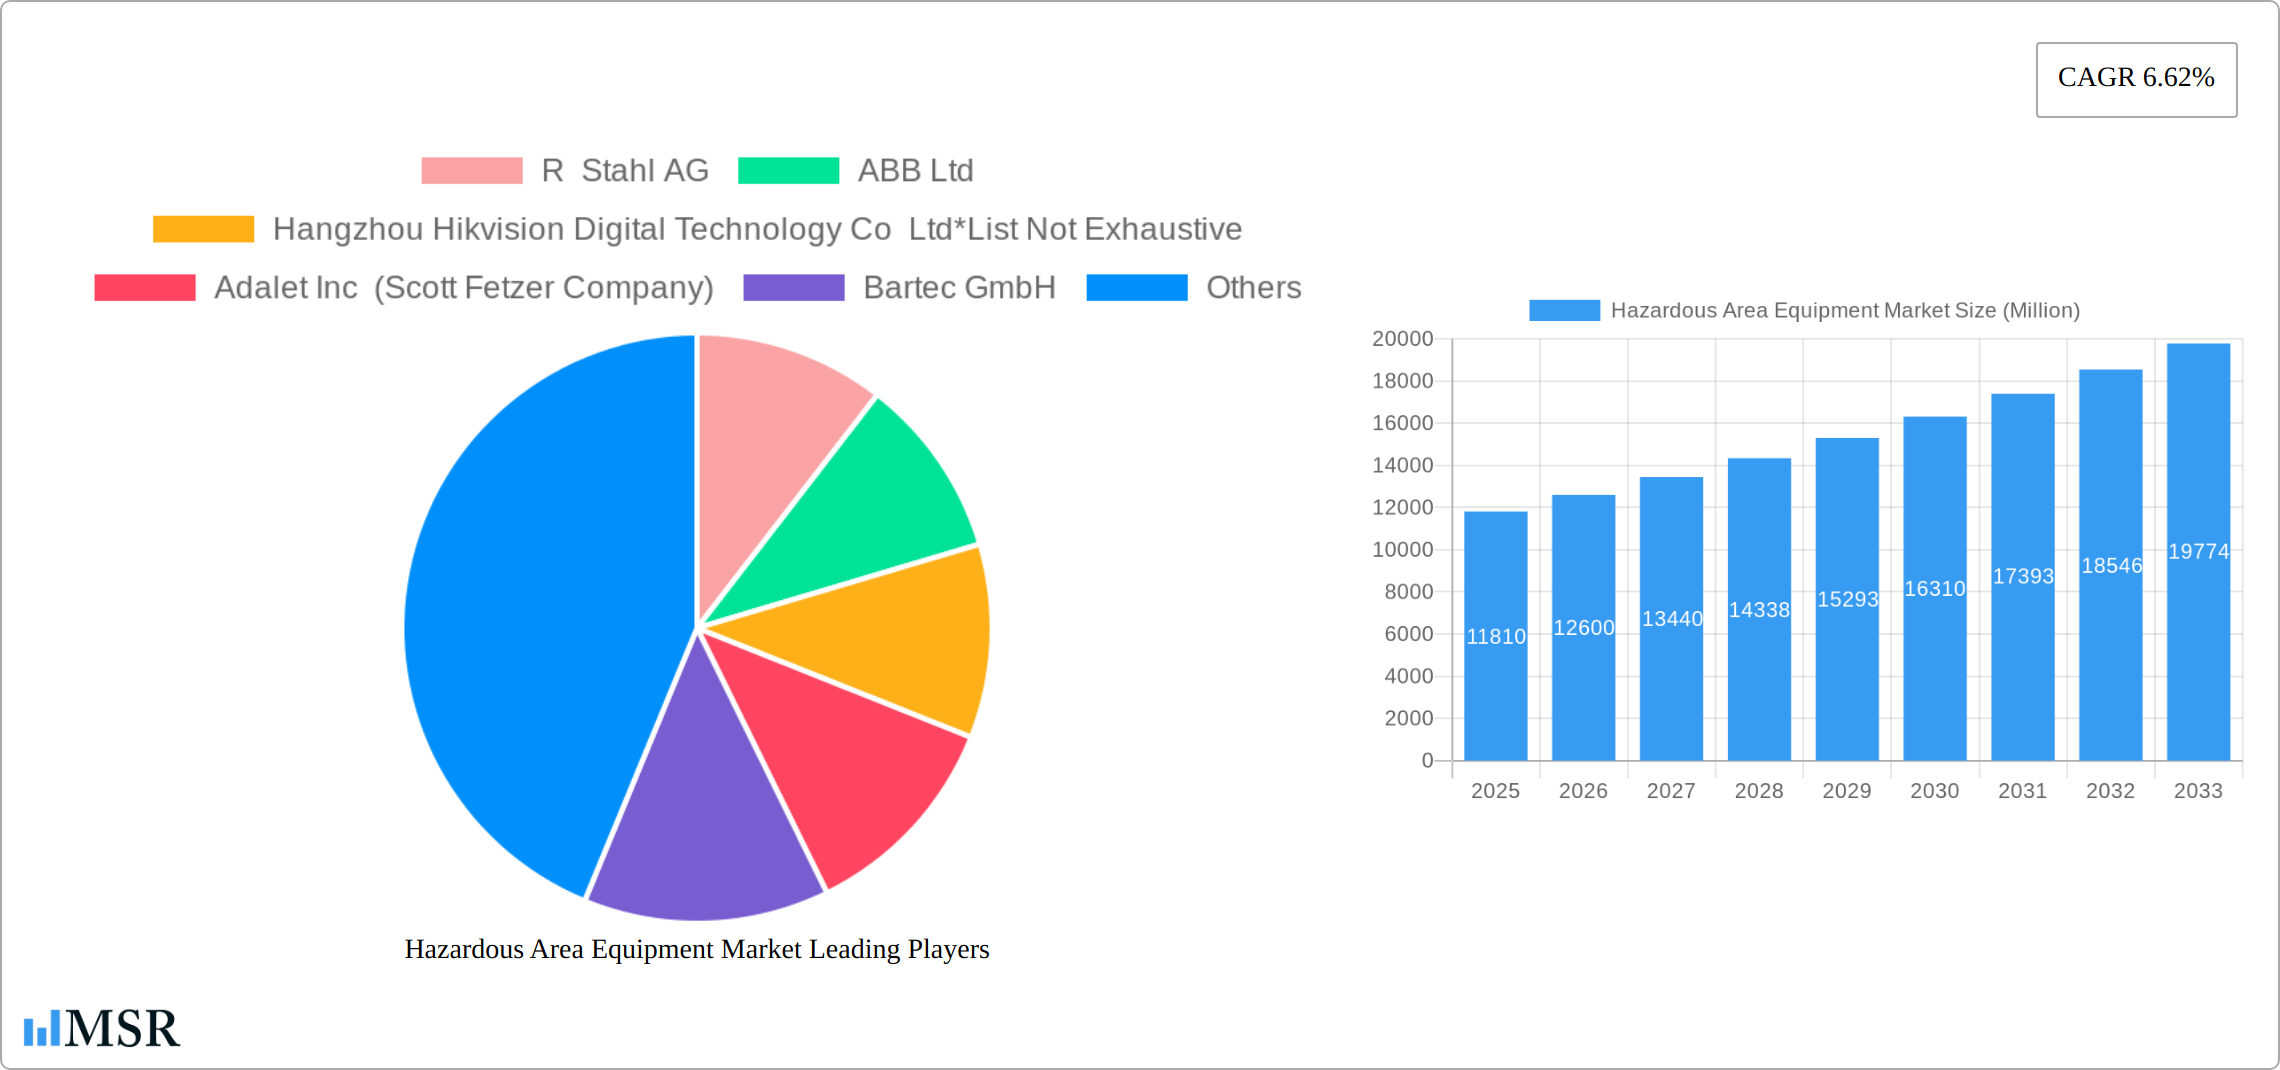
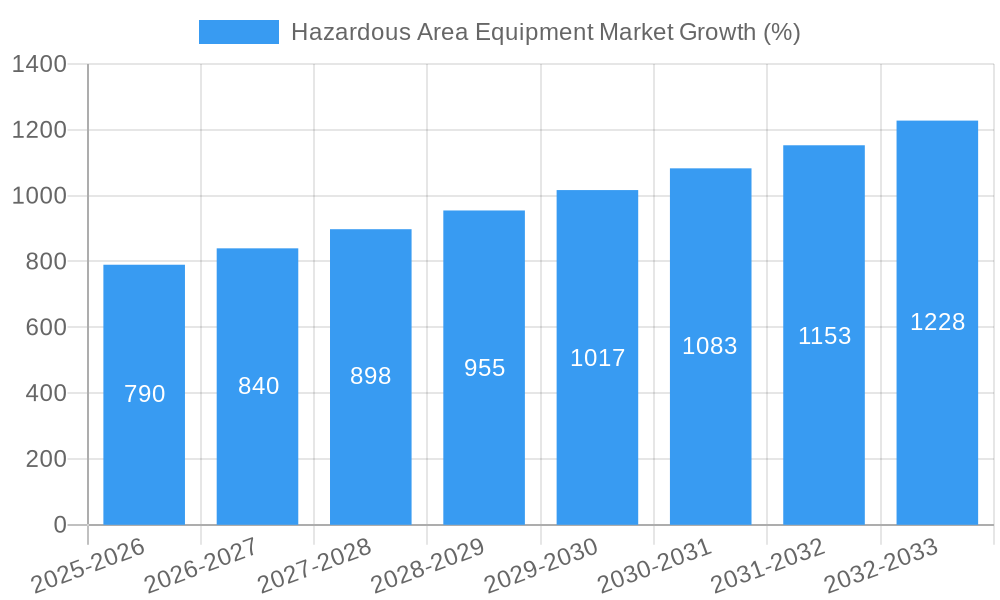
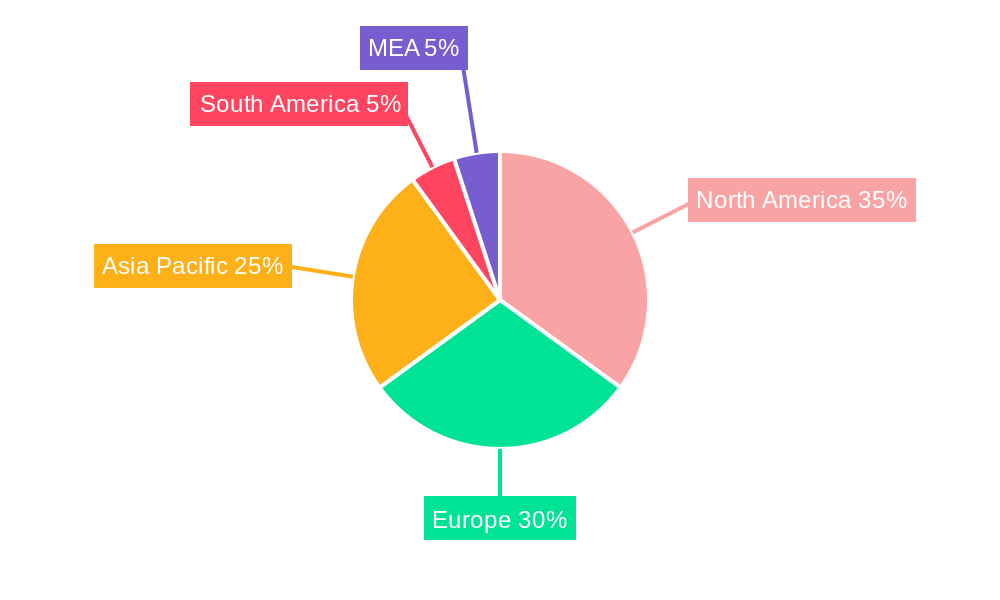
The Hazardous Area Equipment market, valued at $11.81 billion in 2025, is projected to experience robust growth, driven by increasing investments in infrastructure projects globally, particularly within the oil and gas, energy, and chemical sectors. Stringent safety regulations mandating the use of intrinsically safe equipment in hazardous environments are a major catalyst. The market's expansion is further fueled by the growing adoption of automation and digitalization technologies within industrial settings, enhancing operational efficiency and safety. Key growth segments include power supply systems, electric motors, and advanced surveillance technologies, which are witnessing significant technological advancements, boosting demand. Geographically, North America and Europe currently hold significant market shares, driven by established industrial bases and stringent safety regulations. However, the Asia-Pacific region is poised for substantial growth due to rapid industrialization and expanding energy infrastructure projects in countries like China and India. Competitive landscape analysis reveals the presence of both established global players and regional manufacturers, leading to intense competition and continuous innovation in product development and cost optimization strategies.
Despite the positive outlook, the market faces certain challenges. Fluctuations in raw material prices, particularly for metals and electronic components, can impact production costs and profitability. Moreover, the high initial investment required for implementing hazardous area equipment, especially in smaller companies, might act as a restraint. Furthermore, potential supply chain disruptions and economic downturns can impact market growth. However, the long-term outlook remains positive, driven by the continuous demand for safe and efficient operations in hazardous environments across various industries globally. This trend is anticipated to drive further innovation and technological advancements within the hazardous area equipment sector in the coming years, bolstering overall market growth.
Hazardous Area Equipment Market Report: 2019-2033
This comprehensive report provides a detailed analysis of the Hazardous Area Equipment market, offering invaluable insights for industry stakeholders, investors, and strategic decision-makers. Covering the period from 2019 to 2033, with a focus on 2025, this report dissects market dynamics, growth drivers, key players, and emerging trends to provide a 360-degree view of this crucial sector. The study period is 2019-2033, with 2025 as the base and estimated year, and 2025-2033 as the forecast period. The historical period covered is 2019-2024. The report meticulously analyzes segments like Power Supply Systems, Electric Motors, and Surveillance Systems across end-user industries including Oil and Gas, Energy and Power Generation, and Chemical processing.
Hazardous Area Equipment Market Market Concentration & Dynamics
The Hazardous Area Equipment market exhibits a moderately concentrated landscape, with several major players holding significant market share. However, the presence of numerous smaller, specialized companies creates a dynamic competitive environment. Innovation ecosystems are robust, driven by technological advancements in areas such as sensor technology, automation, and connectivity. Stringent safety regulations and certifications, such as those from ATEX and IECEx, shape the market dynamics, demanding high standards of quality and compliance. Substitute products are limited due to the specialized nature of hazardous area equipment, but advancements in alternative technologies may influence the market in the long run. End-user trends reveal a growing demand for energy-efficient, reliable, and digitally integrated solutions.
- Market Concentration: The top 5 players hold an estimated xx% of the market share in 2025.
- M&A Activity: An estimated xx M&A deals occurred in the Hazardous Area Equipment market between 2019 and 2024. This activity reflects consolidation and expansion strategies within the sector.
- Innovation Ecosystems: Significant R&D investment by major players is driving continuous product improvements and new solutions, particularly in areas like IoT integration and remote monitoring.
- Regulatory Frameworks: Strict adherence to international and regional safety standards remains a significant market driver, influencing product design and manufacturing.
Hazardous Area Equipment Market Industry Insights & Trends
The Hazardous Area Equipment market is poised for significant growth, projected to reach USD xx Million by 2033, with a CAGR of xx% during the forecast period (2025-2033). This expansion is propelled by several factors, including rising investments in the Oil & Gas, Energy, and Chemical sectors. Technological disruptions such as the increasing adoption of IoT and Industry 4.0 technologies are driving demand for smart and interconnected solutions. Evolving consumer behaviors are increasingly focused on safety, reliability, and reduced operational costs. Growth in renewable energy projects and stringent safety regulations are further boosting demand.
Key Markets & Segments Leading Hazardous Area Equipment Market
The Oil and Gas sector remains the dominant end-user industry, accounting for an estimated xx% of the market in 2025, followed by Energy and Power Generation. Geographically, North America and Europe currently hold the largest market shares. However, Asia-Pacific is projected to experience the highest growth rate over the forecast period, driven by industrialization and infrastructure development.
Key Market Drivers:
By Equipment:
- Power Supply Systems: Increased demand for reliable and efficient power solutions in hazardous environments.
- Automation and Control Products: Growing adoption of automation and process control systems across industries.
- Surveillance Systems: Enhanced security requirements and remote monitoring capabilities are driving demand.
By End-user Industry:
- Oil and Gas: Significant investments in exploration and production activities.
- Energy and Power Generation: Expansion of renewable energy sources and modernization of existing power plants.
- Chemical: Stringent safety regulations and the need for advanced process monitoring.
Dominance Analysis: North America's established industrial base and stringent safety regulations contribute to its leading position. However, Asia-Pacific's rapid industrial growth and significant investments in infrastructure projects are expected to fuel substantial growth in the coming years.
Hazardous Area Equipment Market Product Developments
Recent product innovations include the integration of advanced sensor technologies, improved safety features, and enhanced connectivity for remote monitoring and control. These advancements are providing enhanced safety, improved efficiency, and reduced operational costs. For instance, R. Stahl AG's expansion of its socket panel portfolio for applications requiring particle contamination avoidance highlights the continuous focus on product refinement.
Challenges in the Hazardous Area Equipment Market Market
The Hazardous Area Equipment market faces challenges including high initial investment costs, stringent regulatory compliance requirements, and potential supply chain disruptions. The competition is intense, with established players and new entrants vying for market share, impacting pricing and profitability. These factors can hinder market growth, particularly for smaller companies with limited resources.
Forces Driving Hazardous Area Equipment Market Growth
Technological advancements, particularly in areas like sensor technology and IoT, are driving demand for smarter and more efficient equipment. Government regulations and standards incentivize the adoption of safer and more reliable solutions, further pushing market growth. Increased investments in infrastructure projects and industrial expansion, especially in developing economies, are also major contributors.
Long-Term Growth Catalysts in the Hazardous Area Equipment Market
Long-term growth is expected to be fuelled by continued technological innovations, strategic partnerships, and market expansion into emerging economies. The increasing adoption of digital technologies and smart solutions will create new opportunities, driving demand for advanced hazardous area equipment.
Emerging Opportunities in Hazardous Area Equipment Market
Emerging opportunities lie in the development of innovative solutions incorporating IoT, AI, and big data analytics. The expansion into renewable energy sectors, particularly offshore wind and solar power, presents significant growth potential. Focus on sustainable and energy-efficient products will also drive market demand.
Leading Players in the Hazardous Area Equipment Sector
- R Stahl AG
- ABB Ltd
- Hangzhou Hikvision Digital Technology Co Ltd
- Adalet Inc (Scott Fetzer Company)
- Bartec GmbH
- Honeywell HBT
- Supermec Pte Ltd
- Marechal Electric Group
- Siemens AG
- Eaton Corporation PLC
- CZ Electric Co Ltd
- G M International Srl
- Spina Group SRL
- Phoenix Mecano
- Warom Technology Inc Co
- Rockwell Automation Inc
- Cordex Instruments Ltd
- Pepperl+Fuchs GmbH
- Alloy Industry Co Ltd
- Wago GmbH & Co KG
Key Milestones in Hazardous Area Equipment Market Industry
- June 2023: Siemens AG announced a EUR 2 billion (USD 2.11 billion) investment in new manufacturing capacity, innovation labs, education centers, and other sites, including a new high-tech factory in Singapore. This signifies a significant commitment to expanding its presence in the hazardous area equipment market.
- May 2023: R. Stahl AG expanded its product portfolio with new socket panels (8150/5-V88 series) designed for applications requiring particle contamination avoidance. This demonstrates ongoing innovation and focus on addressing specific market needs.
Strategic Outlook for Hazardous Area Equipment Market Market
The Hazardous Area Equipment market holds significant long-term growth potential, driven by technological advancements, expanding industrial activity, and increasing focus on safety and efficiency. Strategic opportunities lie in developing innovative solutions catering to emerging market needs, forging strategic partnerships, and expanding into new geographical regions. Companies focusing on innovation, sustainability, and strong regulatory compliance are well-positioned for success in this dynamic market.
Hazardous Area Equipment Market Segmentation
-
1. Equipment
- 1.1. Power Supply Systems
- 1.2. Electric Motors
- 1.3. Surveillance Systems
- 1.4. Cable Glands and Connectors
- 1.5. Automation and Control Products
- 1.6. Enclosures
- 1.7. Lighting Products
- 1.8. Push Buttons and Signaling Devices
-
2. End-user Industry
- 2.1. Oil and Gas
- 2.2. Energy and Power Generation
- 2.3. Chemical
- 2.4. Food and Beverage
- 2.5. Pharmaceuticals
- 2.6. Other End-user Industries
Hazardous Area Equipment Market Segmentation By Geography
-
1. North America
- 1.1. United States
- 1.2. Canada
-
2. Europe
- 2.1. United Kingdom
- 2.2. Germany
-
3. List of Manufacturers of Hazardous Equipment
- 3.1. France
- 3.2. Spain
- 3.3. Italy
- 3.4. Benelux
-
4. Asia
- 4.1. China
- 4.2. India
- 4.3. Japan
- 4.4. South Korea
- 4.5. Australia and New Zealand
-
5. Latin America
- 5.1. Mexico
- 5.2. Brazil
-
6. Middle East and Africa
- 6.1. United Arab Emirates
- 6.2. Saudi Arabia
- 6.3. South Africa
Hazardous Area Equipment Market REPORT HIGHLIGHTS
| Aspects | Details |
|---|---|
| Study Period | 2019-2033 |
| Base Year | 2024 |
| Estimated Year | 2025 |
| Forecast Period | 2025-2033 |
| Historical Period | 2019-2024 |
| Growth Rate | CAGR of 6.62% from 2019-2033 |
| Segmentation |
|
Table of Contents
- 1. Introduction
- 1.1. Research Scope
- 1.2. Market Segmentation
- 1.3. Research Methodology
- 1.4. Definitions and Assumptions
- 2. Executive Summary
- 2.1. Introduction
- 3. Market Dynamics
- 3.1. Introduction
- 3.2. Market Drivers
- 3.2.1 Stricter Regulations for Handling Hazardous Areas and Substances; Increasing Energy Requirements
- 3.2.2 Driving the Demand for Exploration of New Mines
- 3.3. Market Restrains
- 3.3.1. High Investments and High Installation Cost of the Equipment
- 3.4. Market Trends
- 3.4.1. Oil and Gas End-user Industry Segment is Expected to Hold Significant Market Share
- 4. Market Factor Analysis
- 4.1. Porters Five Forces
- 4.2. Supply/Value Chain
- 4.3. PESTEL analysis
- 4.4. Market Entropy
- 4.5. Patent/Trademark Analysis
- 5. Global Hazardous Area Equipment Market Analysis, Insights and Forecast, 2019-2031
- 5.1. Market Analysis, Insights and Forecast - by Equipment
- 5.1.1. Power Supply Systems
- 5.1.2. Electric Motors
- 5.1.3. Surveillance Systems
- 5.1.4. Cable Glands and Connectors
- 5.1.5. Automation and Control Products
- 5.1.6. Enclosures
- 5.1.7. Lighting Products
- 5.1.8. Push Buttons and Signaling Devices
- 5.2. Market Analysis, Insights and Forecast - by End-user Industry
- 5.2.1. Oil and Gas
- 5.2.2. Energy and Power Generation
- 5.2.3. Chemical
- 5.2.4. Food and Beverage
- 5.2.5. Pharmaceuticals
- 5.2.6. Other End-user Industries
- 5.3. Market Analysis, Insights and Forecast - by Region
- 5.3.1. North America
- 5.3.2. Europe
- 5.3.3. List of Manufacturers of Hazardous Equipment
- 5.3.4. Asia
- 5.3.5. Latin America
- 5.3.6. Middle East and Africa
- 5.1. Market Analysis, Insights and Forecast - by Equipment
- 6. North America Hazardous Area Equipment Market Analysis, Insights and Forecast, 2019-2031
- 6.1. Market Analysis, Insights and Forecast - by Equipment
- 6.1.1. Power Supply Systems
- 6.1.2. Electric Motors
- 6.1.3. Surveillance Systems
- 6.1.4. Cable Glands and Connectors
- 6.1.5. Automation and Control Products
- 6.1.6. Enclosures
- 6.1.7. Lighting Products
- 6.1.8. Push Buttons and Signaling Devices
- 6.2. Market Analysis, Insights and Forecast - by End-user Industry
- 6.2.1. Oil and Gas
- 6.2.2. Energy and Power Generation
- 6.2.3. Chemical
- 6.2.4. Food and Beverage
- 6.2.5. Pharmaceuticals
- 6.2.6. Other End-user Industries
- 6.1. Market Analysis, Insights and Forecast - by Equipment
- 7. Europe Hazardous Area Equipment Market Analysis, Insights and Forecast, 2019-2031
- 7.1. Market Analysis, Insights and Forecast - by Equipment
- 7.1.1. Power Supply Systems
- 7.1.2. Electric Motors
- 7.1.3. Surveillance Systems
- 7.1.4. Cable Glands and Connectors
- 7.1.5. Automation and Control Products
- 7.1.6. Enclosures
- 7.1.7. Lighting Products
- 7.1.8. Push Buttons and Signaling Devices
- 7.2. Market Analysis, Insights and Forecast - by End-user Industry
- 7.2.1. Oil and Gas
- 7.2.2. Energy and Power Generation
- 7.2.3. Chemical
- 7.2.4. Food and Beverage
- 7.2.5. Pharmaceuticals
- 7.2.6. Other End-user Industries
- 7.1. Market Analysis, Insights and Forecast - by Equipment
- 8. List of Manufacturers of Hazardous Equipment Hazardous Area Equipment Market Analysis, Insights and Forecast, 2019-2031
- 8.1. Market Analysis, Insights and Forecast - by Equipment
- 8.1.1. Power Supply Systems
- 8.1.2. Electric Motors
- 8.1.3. Surveillance Systems
- 8.1.4. Cable Glands and Connectors
- 8.1.5. Automation and Control Products
- 8.1.6. Enclosures
- 8.1.7. Lighting Products
- 8.1.8. Push Buttons and Signaling Devices
- 8.2. Market Analysis, Insights and Forecast - by End-user Industry
- 8.2.1. Oil and Gas
- 8.2.2. Energy and Power Generation
- 8.2.3. Chemical
- 8.2.4. Food and Beverage
- 8.2.5. Pharmaceuticals
- 8.2.6. Other End-user Industries
- 8.1. Market Analysis, Insights and Forecast - by Equipment
- 9. Asia Hazardous Area Equipment Market Analysis, Insights and Forecast, 2019-2031
- 9.1. Market Analysis, Insights and Forecast - by Equipment
- 9.1.1. Power Supply Systems
- 9.1.2. Electric Motors
- 9.1.3. Surveillance Systems
- 9.1.4. Cable Glands and Connectors
- 9.1.5. Automation and Control Products
- 9.1.6. Enclosures
- 9.1.7. Lighting Products
- 9.1.8. Push Buttons and Signaling Devices
- 9.2. Market Analysis, Insights and Forecast - by End-user Industry
- 9.2.1. Oil and Gas
- 9.2.2. Energy and Power Generation
- 9.2.3. Chemical
- 9.2.4. Food and Beverage
- 9.2.5. Pharmaceuticals
- 9.2.6. Other End-user Industries
- 9.1. Market Analysis, Insights and Forecast - by Equipment
- 10. Latin America Hazardous Area Equipment Market Analysis, Insights and Forecast, 2019-2031
- 10.1. Market Analysis, Insights and Forecast - by Equipment
- 10.1.1. Power Supply Systems
- 10.1.2. Electric Motors
- 10.1.3. Surveillance Systems
- 10.1.4. Cable Glands and Connectors
- 10.1.5. Automation and Control Products
- 10.1.6. Enclosures
- 10.1.7. Lighting Products
- 10.1.8. Push Buttons and Signaling Devices
- 10.2. Market Analysis, Insights and Forecast - by End-user Industry
- 10.2.1. Oil and Gas
- 10.2.2. Energy and Power Generation
- 10.2.3. Chemical
- 10.2.4. Food and Beverage
- 10.2.5. Pharmaceuticals
- 10.2.6. Other End-user Industries
- 10.1. Market Analysis, Insights and Forecast - by Equipment
- 11. Middle East and Africa Hazardous Area Equipment Market Analysis, Insights and Forecast, 2019-2031
- 11.1. Market Analysis, Insights and Forecast - by Equipment
- 11.1.1. Power Supply Systems
- 11.1.2. Electric Motors
- 11.1.3. Surveillance Systems
- 11.1.4. Cable Glands and Connectors
- 11.1.5. Automation and Control Products
- 11.1.6. Enclosures
- 11.1.7. Lighting Products
- 11.1.8. Push Buttons and Signaling Devices
- 11.2. Market Analysis, Insights and Forecast - by End-user Industry
- 11.2.1. Oil and Gas
- 11.2.2. Energy and Power Generation
- 11.2.3. Chemical
- 11.2.4. Food and Beverage
- 11.2.5. Pharmaceuticals
- 11.2.6. Other End-user Industries
- 11.1. Market Analysis, Insights and Forecast - by Equipment
- 12. North America Hazardous Area Equipment Market Analysis, Insights and Forecast, 2019-2031
- 12.1. Market Analysis, Insights and Forecast - By Country/Sub-region
- 12.1.1 United States
- 12.1.2 Canada
- 12.1.3 Mexico
- 13. Europe Hazardous Area Equipment Market Analysis, Insights and Forecast, 2019-2031
- 13.1. Market Analysis, Insights and Forecast - By Country/Sub-region
- 13.1.1 Germany
- 13.1.2 United Kingdom
- 13.1.3 France
- 13.1.4 Spain
- 13.1.5 Italy
- 13.1.6 Spain
- 13.1.7 Belgium
- 13.1.8 Netherland
- 13.1.9 Nordics
- 13.1.10 Rest of Europe
- 14. Asia Pacific Hazardous Area Equipment Market Analysis, Insights and Forecast, 2019-2031
- 14.1. Market Analysis, Insights and Forecast - By Country/Sub-region
- 14.1.1 China
- 14.1.2 Japan
- 14.1.3 India
- 14.1.4 South Korea
- 14.1.5 Southeast Asia
- 14.1.6 Australia
- 14.1.7 Indonesia
- 14.1.8 Phillipes
- 14.1.9 Singapore
- 14.1.10 Thailandc
- 14.1.11 Rest of Asia Pacific
- 15. South America Hazardous Area Equipment Market Analysis, Insights and Forecast, 2019-2031
- 15.1. Market Analysis, Insights and Forecast - By Country/Sub-region
- 15.1.1 Brazil
- 15.1.2 Argentina
- 15.1.3 Peru
- 15.1.4 Chile
- 15.1.5 Colombia
- 15.1.6 Ecuador
- 15.1.7 Venezuela
- 15.1.8 Rest of South America
- 16. North America Hazardous Area Equipment Market Analysis, Insights and Forecast, 2019-2031
- 16.1. Market Analysis, Insights and Forecast - By Country/Sub-region
- 16.1.1 United States
- 16.1.2 Canada
- 16.1.3 Mexico
- 17. MEA Hazardous Area Equipment Market Analysis, Insights and Forecast, 2019-2031
- 17.1. Market Analysis, Insights and Forecast - By Country/Sub-region
- 17.1.1 United Arab Emirates
- 17.1.2 Saudi Arabia
- 17.1.3 South Africa
- 17.1.4 Rest of Middle East and Africa
- 18. Competitive Analysis
- 18.1. Global Market Share Analysis 2024
- 18.2. Company Profiles
- 18.2.1 R Stahl AG
- 18.2.1.1. Overview
- 18.2.1.2. Products
- 18.2.1.3. SWOT Analysis
- 18.2.1.4. Recent Developments
- 18.2.1.5. Financials (Based on Availability)
- 18.2.2 ABB Ltd
- 18.2.2.1. Overview
- 18.2.2.2. Products
- 18.2.2.3. SWOT Analysis
- 18.2.2.4. Recent Developments
- 18.2.2.5. Financials (Based on Availability)
- 18.2.3 Hangzhou Hikvision Digital Technology Co Ltd*List Not Exhaustive
- 18.2.3.1. Overview
- 18.2.3.2. Products
- 18.2.3.3. SWOT Analysis
- 18.2.3.4. Recent Developments
- 18.2.3.5. Financials (Based on Availability)
- 18.2.4 Adalet Inc (Scott Fetzer Company)
- 18.2.4.1. Overview
- 18.2.4.2. Products
- 18.2.4.3. SWOT Analysis
- 18.2.4.4. Recent Developments
- 18.2.4.5. Financials (Based on Availability)
- 18.2.5 Bartec GmbH
- 18.2.5.1. Overview
- 18.2.5.2. Products
- 18.2.5.3. SWOT Analysis
- 18.2.5.4. Recent Developments
- 18.2.5.5. Financials (Based on Availability)
- 18.2.6 Honeywell HBT
- 18.2.6.1. Overview
- 18.2.6.2. Products
- 18.2.6.3. SWOT Analysis
- 18.2.6.4. Recent Developments
- 18.2.6.5. Financials (Based on Availability)
- 18.2.7 Supermec Pte Ltd
- 18.2.7.1. Overview
- 18.2.7.2. Products
- 18.2.7.3. SWOT Analysis
- 18.2.7.4. Recent Developments
- 18.2.7.5. Financials (Based on Availability)
- 18.2.8 Marechal Electric Group
- 18.2.8.1. Overview
- 18.2.8.2. Products
- 18.2.8.3. SWOT Analysis
- 18.2.8.4. Recent Developments
- 18.2.8.5. Financials (Based on Availability)
- 18.2.9 Siemens AG
- 18.2.9.1. Overview
- 18.2.9.2. Products
- 18.2.9.3. SWOT Analysis
- 18.2.9.4. Recent Developments
- 18.2.9.5. Financials (Based on Availability)
- 18.2.10 Eaton Corporation PLC
- 18.2.10.1. Overview
- 18.2.10.2. Products
- 18.2.10.3. SWOT Analysis
- 18.2.10.4. Recent Developments
- 18.2.10.5. Financials (Based on Availability)
- 18.2.11 CZ Electric Co Ltd
- 18.2.11.1. Overview
- 18.2.11.2. Products
- 18.2.11.3. SWOT Analysis
- 18.2.11.4. Recent Developments
- 18.2.11.5. Financials (Based on Availability)
- 18.2.12 G M International Srl
- 18.2.12.1. Overview
- 18.2.12.2. Products
- 18.2.12.3. SWOT Analysis
- 18.2.12.4. Recent Developments
- 18.2.12.5. Financials (Based on Availability)
- 18.2.13 Spina Group SRL
- 18.2.13.1. Overview
- 18.2.13.2. Products
- 18.2.13.3. SWOT Analysis
- 18.2.13.4. Recent Developments
- 18.2.13.5. Financials (Based on Availability)
- 18.2.14 Phoenix Mecano
- 18.2.14.1. Overview
- 18.2.14.2. Products
- 18.2.14.3. SWOT Analysis
- 18.2.14.4. Recent Developments
- 18.2.14.5. Financials (Based on Availability)
- 18.2.15 Warom Technology Inc Co
- 18.2.15.1. Overview
- 18.2.15.2. Products
- 18.2.15.3. SWOT Analysis
- 18.2.15.4. Recent Developments
- 18.2.15.5. Financials (Based on Availability)
- 18.2.16 Rockwell Automation Inc
- 18.2.16.1. Overview
- 18.2.16.2. Products
- 18.2.16.3. SWOT Analysis
- 18.2.16.4. Recent Developments
- 18.2.16.5. Financials (Based on Availability)
- 18.2.17 Cordex Instruments Ltd
- 18.2.17.1. Overview
- 18.2.17.2. Products
- 18.2.17.3. SWOT Analysis
- 18.2.17.4. Recent Developments
- 18.2.17.5. Financials (Based on Availability)
- 18.2.18 Pepperl+Fuchs GmbH
- 18.2.18.1. Overview
- 18.2.18.2. Products
- 18.2.18.3. SWOT Analysis
- 18.2.18.4. Recent Developments
- 18.2.18.5. Financials (Based on Availability)
- 18.2.19 Alloy Industry Co Ltd
- 18.2.19.1. Overview
- 18.2.19.2. Products
- 18.2.19.3. SWOT Analysis
- 18.2.19.4. Recent Developments
- 18.2.19.5. Financials (Based on Availability)
- 18.2.20 Wago GmbH & Co KG
- 18.2.20.1. Overview
- 18.2.20.2. Products
- 18.2.20.3. SWOT Analysis
- 18.2.20.4. Recent Developments
- 18.2.20.5. Financials (Based on Availability)
- 18.2.1 R Stahl AG
List of Figures
- Figure 1: Global Hazardous Area Equipment Market Revenue Breakdown (Million, %) by Region 2024 & 2032
- Figure 2: North America Hazardous Area Equipment Market Revenue (Million), by Country 2024 & 2032
- Figure 3: North America Hazardous Area Equipment Market Revenue Share (%), by Country 2024 & 2032
- Figure 4: Europe Hazardous Area Equipment Market Revenue (Million), by Country 2024 & 2032
- Figure 5: Europe Hazardous Area Equipment Market Revenue Share (%), by Country 2024 & 2032
- Figure 6: Asia Pacific Hazardous Area Equipment Market Revenue (Million), by Country 2024 & 2032
- Figure 7: Asia Pacific Hazardous Area Equipment Market Revenue Share (%), by Country 2024 & 2032
- Figure 8: South America Hazardous Area Equipment Market Revenue (Million), by Country 2024 & 2032
- Figure 9: South America Hazardous Area Equipment Market Revenue Share (%), by Country 2024 & 2032
- Figure 10: North America Hazardous Area Equipment Market Revenue (Million), by Country 2024 & 2032
- Figure 11: North America Hazardous Area Equipment Market Revenue Share (%), by Country 2024 & 2032
- Figure 12: MEA Hazardous Area Equipment Market Revenue (Million), by Country 2024 & 2032
- Figure 13: MEA Hazardous Area Equipment Market Revenue Share (%), by Country 2024 & 2032
- Figure 14: North America Hazardous Area Equipment Market Revenue (Million), by Equipment 2024 & 2032
- Figure 15: North America Hazardous Area Equipment Market Revenue Share (%), by Equipment 2024 & 2032
- Figure 16: North America Hazardous Area Equipment Market Revenue (Million), by End-user Industry 2024 & 2032
- Figure 17: North America Hazardous Area Equipment Market Revenue Share (%), by End-user Industry 2024 & 2032
- Figure 18: North America Hazardous Area Equipment Market Revenue (Million), by Country 2024 & 2032
- Figure 19: North America Hazardous Area Equipment Market Revenue Share (%), by Country 2024 & 2032
- Figure 20: Europe Hazardous Area Equipment Market Revenue (Million), by Equipment 2024 & 2032
- Figure 21: Europe Hazardous Area Equipment Market Revenue Share (%), by Equipment 2024 & 2032
- Figure 22: Europe Hazardous Area Equipment Market Revenue (Million), by End-user Industry 2024 & 2032
- Figure 23: Europe Hazardous Area Equipment Market Revenue Share (%), by End-user Industry 2024 & 2032
- Figure 24: Europe Hazardous Area Equipment Market Revenue (Million), by Country 2024 & 2032
- Figure 25: Europe Hazardous Area Equipment Market Revenue Share (%), by Country 2024 & 2032
- Figure 26: List of Manufacturers of Hazardous Equipment Hazardous Area Equipment Market Revenue (Million), by Equipment 2024 & 2032
- Figure 27: List of Manufacturers of Hazardous Equipment Hazardous Area Equipment Market Revenue Share (%), by Equipment 2024 & 2032
- Figure 28: List of Manufacturers of Hazardous Equipment Hazardous Area Equipment Market Revenue (Million), by End-user Industry 2024 & 2032
- Figure 29: List of Manufacturers of Hazardous Equipment Hazardous Area Equipment Market Revenue Share (%), by End-user Industry 2024 & 2032
- Figure 30: List of Manufacturers of Hazardous Equipment Hazardous Area Equipment Market Revenue (Million), by Country 2024 & 2032
- Figure 31: List of Manufacturers of Hazardous Equipment Hazardous Area Equipment Market Revenue Share (%), by Country 2024 & 2032
- Figure 32: Asia Hazardous Area Equipment Market Revenue (Million), by Equipment 2024 & 2032
- Figure 33: Asia Hazardous Area Equipment Market Revenue Share (%), by Equipment 2024 & 2032
- Figure 34: Asia Hazardous Area Equipment Market Revenue (Million), by End-user Industry 2024 & 2032
- Figure 35: Asia Hazardous Area Equipment Market Revenue Share (%), by End-user Industry 2024 & 2032
- Figure 36: Asia Hazardous Area Equipment Market Revenue (Million), by Country 2024 & 2032
- Figure 37: Asia Hazardous Area Equipment Market Revenue Share (%), by Country 2024 & 2032
- Figure 38: Latin America Hazardous Area Equipment Market Revenue (Million), by Equipment 2024 & 2032
- Figure 39: Latin America Hazardous Area Equipment Market Revenue Share (%), by Equipment 2024 & 2032
- Figure 40: Latin America Hazardous Area Equipment Market Revenue (Million), by End-user Industry 2024 & 2032
- Figure 41: Latin America Hazardous Area Equipment Market Revenue Share (%), by End-user Industry 2024 & 2032
- Figure 42: Latin America Hazardous Area Equipment Market Revenue (Million), by Country 2024 & 2032
- Figure 43: Latin America Hazardous Area Equipment Market Revenue Share (%), by Country 2024 & 2032
- Figure 44: Middle East and Africa Hazardous Area Equipment Market Revenue (Million), by Equipment 2024 & 2032
- Figure 45: Middle East and Africa Hazardous Area Equipment Market Revenue Share (%), by Equipment 2024 & 2032
- Figure 46: Middle East and Africa Hazardous Area Equipment Market Revenue (Million), by End-user Industry 2024 & 2032
- Figure 47: Middle East and Africa Hazardous Area Equipment Market Revenue Share (%), by End-user Industry 2024 & 2032
- Figure 48: Middle East and Africa Hazardous Area Equipment Market Revenue (Million), by Country 2024 & 2032
- Figure 49: Middle East and Africa Hazardous Area Equipment Market Revenue Share (%), by Country 2024 & 2032
List of Tables
- Table 1: Global Hazardous Area Equipment Market Revenue Million Forecast, by Region 2019 & 2032
- Table 2: Global Hazardous Area Equipment Market Revenue Million Forecast, by Equipment 2019 & 2032
- Table 3: Global Hazardous Area Equipment Market Revenue Million Forecast, by End-user Industry 2019 & 2032
- Table 4: Global Hazardous Area Equipment Market Revenue Million Forecast, by Region 2019 & 2032
- Table 5: Global Hazardous Area Equipment Market Revenue Million Forecast, by Country 2019 & 2032
- Table 6: United States Hazardous Area Equipment Market Revenue (Million) Forecast, by Application 2019 & 2032
- Table 7: Canada Hazardous Area Equipment Market Revenue (Million) Forecast, by Application 2019 & 2032
- Table 8: Mexico Hazardous Area Equipment Market Revenue (Million) Forecast, by Application 2019 & 2032
- Table 9: Global Hazardous Area Equipment Market Revenue Million Forecast, by Country 2019 & 2032
- Table 10: Germany Hazardous Area Equipment Market Revenue (Million) Forecast, by Application 2019 & 2032
- Table 11: United Kingdom Hazardous Area Equipment Market Revenue (Million) Forecast, by Application 2019 & 2032
- Table 12: France Hazardous Area Equipment Market Revenue (Million) Forecast, by Application 2019 & 2032
- Table 13: Spain Hazardous Area Equipment Market Revenue (Million) Forecast, by Application 2019 & 2032
- Table 14: Italy Hazardous Area Equipment Market Revenue (Million) Forecast, by Application 2019 & 2032
- Table 15: Spain Hazardous Area Equipment Market Revenue (Million) Forecast, by Application 2019 & 2032
- Table 16: Belgium Hazardous Area Equipment Market Revenue (Million) Forecast, by Application 2019 & 2032
- Table 17: Netherland Hazardous Area Equipment Market Revenue (Million) Forecast, by Application 2019 & 2032
- Table 18: Nordics Hazardous Area Equipment Market Revenue (Million) Forecast, by Application 2019 & 2032
- Table 19: Rest of Europe Hazardous Area Equipment Market Revenue (Million) Forecast, by Application 2019 & 2032
- Table 20: Global Hazardous Area Equipment Market Revenue Million Forecast, by Country 2019 & 2032
- Table 21: China Hazardous Area Equipment Market Revenue (Million) Forecast, by Application 2019 & 2032
- Table 22: Japan Hazardous Area Equipment Market Revenue (Million) Forecast, by Application 2019 & 2032
- Table 23: India Hazardous Area Equipment Market Revenue (Million) Forecast, by Application 2019 & 2032
- Table 24: South Korea Hazardous Area Equipment Market Revenue (Million) Forecast, by Application 2019 & 2032
- Table 25: Southeast Asia Hazardous Area Equipment Market Revenue (Million) Forecast, by Application 2019 & 2032
- Table 26: Australia Hazardous Area Equipment Market Revenue (Million) Forecast, by Application 2019 & 2032
- Table 27: Indonesia Hazardous Area Equipment Market Revenue (Million) Forecast, by Application 2019 & 2032
- Table 28: Phillipes Hazardous Area Equipment Market Revenue (Million) Forecast, by Application 2019 & 2032
- Table 29: Singapore Hazardous Area Equipment Market Revenue (Million) Forecast, by Application 2019 & 2032
- Table 30: Thailandc Hazardous Area Equipment Market Revenue (Million) Forecast, by Application 2019 & 2032
- Table 31: Rest of Asia Pacific Hazardous Area Equipment Market Revenue (Million) Forecast, by Application 2019 & 2032
- Table 32: Global Hazardous Area Equipment Market Revenue Million Forecast, by Country 2019 & 2032
- Table 33: Brazil Hazardous Area Equipment Market Revenue (Million) Forecast, by Application 2019 & 2032
- Table 34: Argentina Hazardous Area Equipment Market Revenue (Million) Forecast, by Application 2019 & 2032
- Table 35: Peru Hazardous Area Equipment Market Revenue (Million) Forecast, by Application 2019 & 2032
- Table 36: Chile Hazardous Area Equipment Market Revenue (Million) Forecast, by Application 2019 & 2032
- Table 37: Colombia Hazardous Area Equipment Market Revenue (Million) Forecast, by Application 2019 & 2032
- Table 38: Ecuador Hazardous Area Equipment Market Revenue (Million) Forecast, by Application 2019 & 2032
- Table 39: Venezuela Hazardous Area Equipment Market Revenue (Million) Forecast, by Application 2019 & 2032
- Table 40: Rest of South America Hazardous Area Equipment Market Revenue (Million) Forecast, by Application 2019 & 2032
- Table 41: Global Hazardous Area Equipment Market Revenue Million Forecast, by Country 2019 & 2032
- Table 42: United States Hazardous Area Equipment Market Revenue (Million) Forecast, by Application 2019 & 2032
- Table 43: Canada Hazardous Area Equipment Market Revenue (Million) Forecast, by Application 2019 & 2032
- Table 44: Mexico Hazardous Area Equipment Market Revenue (Million) Forecast, by Application 2019 & 2032
- Table 45: Global Hazardous Area Equipment Market Revenue Million Forecast, by Country 2019 & 2032
- Table 46: United Arab Emirates Hazardous Area Equipment Market Revenue (Million) Forecast, by Application 2019 & 2032
- Table 47: Saudi Arabia Hazardous Area Equipment Market Revenue (Million) Forecast, by Application 2019 & 2032
- Table 48: South Africa Hazardous Area Equipment Market Revenue (Million) Forecast, by Application 2019 & 2032
- Table 49: Rest of Middle East and Africa Hazardous Area Equipment Market Revenue (Million) Forecast, by Application 2019 & 2032
- Table 50: Global Hazardous Area Equipment Market Revenue Million Forecast, by Equipment 2019 & 2032
- Table 51: Global Hazardous Area Equipment Market Revenue Million Forecast, by End-user Industry 2019 & 2032
- Table 52: Global Hazardous Area Equipment Market Revenue Million Forecast, by Country 2019 & 2032
- Table 53: United States Hazardous Area Equipment Market Revenue (Million) Forecast, by Application 2019 & 2032
- Table 54: Canada Hazardous Area Equipment Market Revenue (Million) Forecast, by Application 2019 & 2032
- Table 55: Global Hazardous Area Equipment Market Revenue Million Forecast, by Equipment 2019 & 2032
- Table 56: Global Hazardous Area Equipment Market Revenue Million Forecast, by End-user Industry 2019 & 2032
- Table 57: Global Hazardous Area Equipment Market Revenue Million Forecast, by Country 2019 & 2032
- Table 58: United Kingdom Hazardous Area Equipment Market Revenue (Million) Forecast, by Application 2019 & 2032
- Table 59: Germany Hazardous Area Equipment Market Revenue (Million) Forecast, by Application 2019 & 2032
- Table 60: Global Hazardous Area Equipment Market Revenue Million Forecast, by Equipment 2019 & 2032
- Table 61: Global Hazardous Area Equipment Market Revenue Million Forecast, by End-user Industry 2019 & 2032
- Table 62: Global Hazardous Area Equipment Market Revenue Million Forecast, by Country 2019 & 2032
- Table 63: France Hazardous Area Equipment Market Revenue (Million) Forecast, by Application 2019 & 2032
- Table 64: Spain Hazardous Area Equipment Market Revenue (Million) Forecast, by Application 2019 & 2032
- Table 65: Italy Hazardous Area Equipment Market Revenue (Million) Forecast, by Application 2019 & 2032
- Table 66: Benelux Hazardous Area Equipment Market Revenue (Million) Forecast, by Application 2019 & 2032
- Table 67: Global Hazardous Area Equipment Market Revenue Million Forecast, by Equipment 2019 & 2032
- Table 68: Global Hazardous Area Equipment Market Revenue Million Forecast, by End-user Industry 2019 & 2032
- Table 69: Global Hazardous Area Equipment Market Revenue Million Forecast, by Country 2019 & 2032
- Table 70: China Hazardous Area Equipment Market Revenue (Million) Forecast, by Application 2019 & 2032
- Table 71: India Hazardous Area Equipment Market Revenue (Million) Forecast, by Application 2019 & 2032
- Table 72: Japan Hazardous Area Equipment Market Revenue (Million) Forecast, by Application 2019 & 2032
- Table 73: South Korea Hazardous Area Equipment Market Revenue (Million) Forecast, by Application 2019 & 2032
- Table 74: Australia and New Zealand Hazardous Area Equipment Market Revenue (Million) Forecast, by Application 2019 & 2032
- Table 75: Global Hazardous Area Equipment Market Revenue Million Forecast, by Equipment 2019 & 2032
- Table 76: Global Hazardous Area Equipment Market Revenue Million Forecast, by End-user Industry 2019 & 2032
- Table 77: Global Hazardous Area Equipment Market Revenue Million Forecast, by Country 2019 & 2032
- Table 78: Mexico Hazardous Area Equipment Market Revenue (Million) Forecast, by Application 2019 & 2032
- Table 79: Brazil Hazardous Area Equipment Market Revenue (Million) Forecast, by Application 2019 & 2032
- Table 80: Global Hazardous Area Equipment Market Revenue Million Forecast, by Equipment 2019 & 2032
- Table 81: Global Hazardous Area Equipment Market Revenue Million Forecast, by End-user Industry 2019 & 2032
- Table 82: Global Hazardous Area Equipment Market Revenue Million Forecast, by Country 2019 & 2032
- Table 83: United Arab Emirates Hazardous Area Equipment Market Revenue (Million) Forecast, by Application 2019 & 2032
- Table 84: Saudi Arabia Hazardous Area Equipment Market Revenue (Million) Forecast, by Application 2019 & 2032
- Table 85: South Africa Hazardous Area Equipment Market Revenue (Million) Forecast, by Application 2019 & 2032
Frequently Asked Questions
1. What is the projected Compound Annual Growth Rate (CAGR) of the Hazardous Area Equipment Market?
The projected CAGR is approximately 6.62%.
2. Which companies are prominent players in the Hazardous Area Equipment Market?
Key companies in the market include R Stahl AG, ABB Ltd, Hangzhou Hikvision Digital Technology Co Ltd*List Not Exhaustive, Adalet Inc (Scott Fetzer Company), Bartec GmbH, Honeywell HBT, Supermec Pte Ltd, Marechal Electric Group, Siemens AG, Eaton Corporation PLC, CZ Electric Co Ltd, G M International Srl, Spina Group SRL, Phoenix Mecano, Warom Technology Inc Co, Rockwell Automation Inc, Cordex Instruments Ltd, Pepperl+Fuchs GmbH, Alloy Industry Co Ltd, Wago GmbH & Co KG.
3. What are the main segments of the Hazardous Area Equipment Market?
The market segments include Equipment, End-user Industry.
4. Can you provide details about the market size?
The market size is estimated to be USD 11.81 Million as of 2022.
5. What are some drivers contributing to market growth?
Stricter Regulations for Handling Hazardous Areas and Substances; Increasing Energy Requirements. Driving the Demand for Exploration of New Mines.
6. What are the notable trends driving market growth?
Oil and Gas End-user Industry Segment is Expected to Hold Significant Market Share.
7. Are there any restraints impacting market growth?
High Investments and High Installation Cost of the Equipment.
8. Can you provide examples of recent developments in the market?
June 2023 - Siemens AG announced an investment of EUR 2 billion (USD 2.11 billion) for new manufacturing capacity and innovation labs, education centers, and other sites. Siemens also announced the construction of a new high-tech factory in Singapore to meet the growing demand from Southeast Asia markets. The company is further expected to announce additional investments in the US and Europe.
9. What pricing options are available for accessing the report?
Pricing options include single-user, multi-user, and enterprise licenses priced at USD 4750, USD 5250, and USD 8750 respectively.
10. Is the market size provided in terms of value or volume?
The market size is provided in terms of value, measured in Million.
11. Are there any specific market keywords associated with the report?
Yes, the market keyword associated with the report is "Hazardous Area Equipment Market," which aids in identifying and referencing the specific market segment covered.
12. How do I determine which pricing option suits my needs best?
The pricing options vary based on user requirements and access needs. Individual users may opt for single-user licenses, while businesses requiring broader access may choose multi-user or enterprise licenses for cost-effective access to the report.
13. Are there any additional resources or data provided in the Hazardous Area Equipment Market report?
While the report offers comprehensive insights, it's advisable to review the specific contents or supplementary materials provided to ascertain if additional resources or data are available.
14. How can I stay updated on further developments or reports in the Hazardous Area Equipment Market?
To stay informed about further developments, trends, and reports in the Hazardous Area Equipment Market, consider subscribing to industry newsletters, following relevant companies and organizations, or regularly checking reputable industry news sources and publications.
Methodology
Step 1 - Identification of Relevant Samples Size from Population Database


Step 2 - Approaches for Defining Global Market Size (Value, Volume* & Price*)

Note*: In applicable scenarios
Step 3 - Data Sources
Primary Research
- Web Analytics
- Survey Reports
- Research Institute
- Latest Research Reports
- Opinion Leaders
Secondary Research
- Annual Reports
- White Paper
- Latest Press Release
- Industry Association
- Paid Database
- Investor Presentations

Step 4 - Data Triangulation
Involves using different sources of information in order to increase the validity of a study
These sources are likely to be stakeholders in a program - participants, other researchers, program staff, other community members, and so on.
Then we put all data in single framework & apply various statistical tools to find out the dynamic on the market.
During the analysis stage, feedback from the stakeholder groups would be compared to determine areas of agreement as well as areas of divergence
