

Key Insights
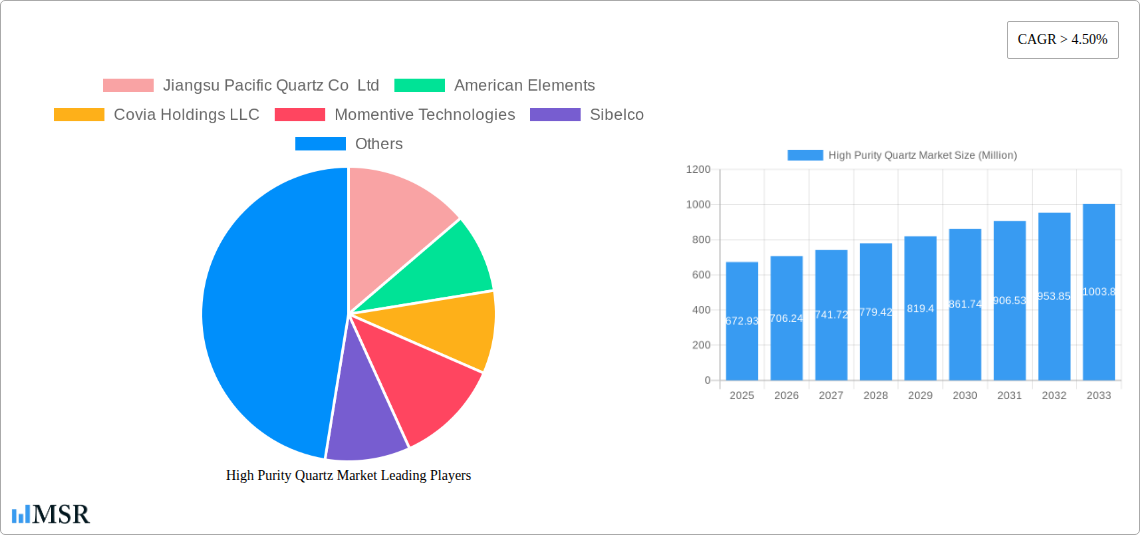
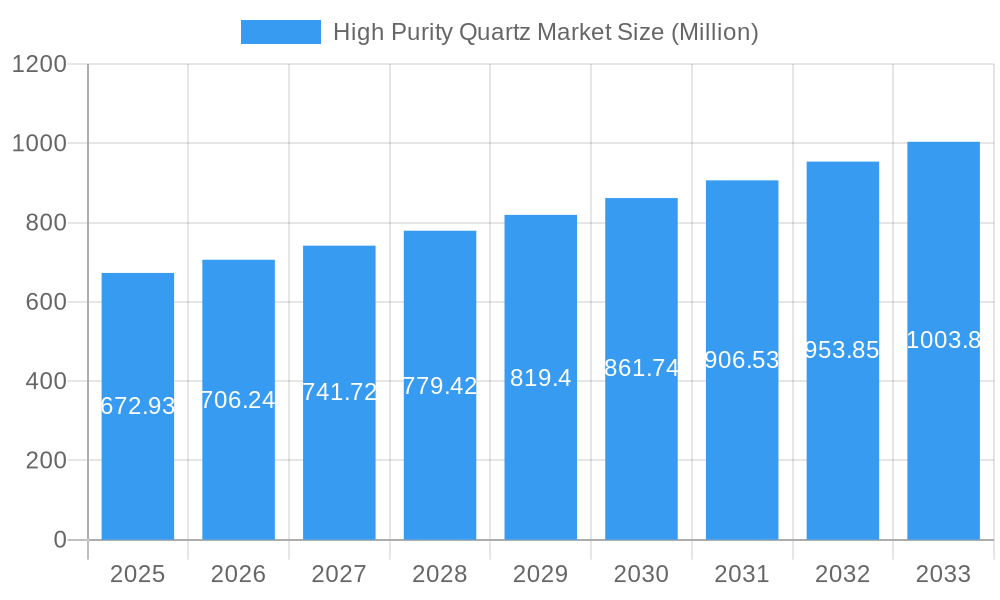
The high-purity quartz market, valued at $672.93 million in 2025, is projected to experience robust growth, driven by the burgeoning semiconductor, solar, and optical fiber industries. A Compound Annual Growth Rate (CAGR) exceeding 4.50% from 2025 to 2033 indicates significant expansion potential. Key applications like semiconductor manufacturing, which demand extremely high purity levels for optimal device performance, are major contributors to market growth. The increasing adoption of renewable energy sources, particularly solar power, further fuels demand for high-purity quartz in solar cell production. Advancements in optical fiber technology, requiring precise quartz components for efficient light transmission, also contribute significantly. While supply chain constraints and price volatility of raw materials pose challenges, technological advancements aimed at improving extraction and purification processes are mitigating these risks. The market is geographically diversified, with North America, Europe, and Asia-Pacific representing significant regional segments. Competition among established players like Jiangsu Pacific Quartz Co Ltd, American Elements, and others is intense, fostering innovation and driving market efficiency. The forecast period will likely see continued consolidation and strategic partnerships to secure supply chains and expand market share.
High Purity Quartz Market Market Size (In Million)
The diverse applications of high-purity quartz across various technologically advanced sectors ensure sustained market momentum. While regional variations in growth rates are anticipated due to factors like economic development and government policies, the overall trajectory remains positive. The increasing adoption of sophisticated manufacturing techniques, coupled with rigorous quality control measures, will further refine market dynamics. This, in conjunction with continuous R&D efforts to enhance purity levels and improve cost-effectiveness, will shape the future of the high-purity quartz market. The strategic expansion into emerging markets, coupled with innovative product development and aggressive marketing strategies, will allow leading players to solidify their positions in the competitive landscape.
High Purity Quartz Market Company Market Share
High Purity Quartz Market Report: 2019-2033 Forecast
Dive deep into the burgeoning High Purity Quartz (HPQ) market with this comprehensive report, offering invaluable insights for investors, industry stakeholders, and strategic decision-makers. This in-depth analysis covers the period 2019-2033, with a focus on the estimated year 2025 and a forecast spanning 2025-2033. The report unveils market dynamics, key players, growth drivers, and emerging trends shaping this critical sector. Expect detailed segmentation across applications like semiconductors, solar, lighting, telecom & optics, microelectronics, and others. The market size is projected to reach xx Million by 2033, exhibiting a CAGR of xx%.
High Purity Quartz Market Concentration & Dynamics
This section analyzes the competitive landscape of the High Purity Quartz market, evaluating market concentration, innovation ecosystems, regulatory frameworks, substitute products, end-user trends, and mergers & acquisitions (M&A) activities. The market is moderately concentrated, with key players like Sibelco, Imerys, and Momentive Technologies holding significant market share. However, several smaller players also contribute significantly to the overall market.
- Market Concentration: The Herfindahl-Hirschman Index (HHI) is estimated to be xx, indicating a moderately concentrated market.
- Innovation Ecosystems: Significant investments in R&D are driving innovation in HPQ production and purification techniques. This includes advancements in crystal growth processes and surface treatments.
- Regulatory Frameworks: Environmental regulations, particularly concerning silica dust and waste management, significantly influence the industry. Compliance costs vary regionally.
- Substitute Products: While there are few perfect substitutes, alternative materials are being explored for specific applications, although none yet pose a major threat.
- End-User Trends: The increasing demand for high-performance electronics and renewable energy solutions is a major driver of HPQ market growth.
- M&A Activities: The past five years have witnessed xx M&A deals, primarily focused on expanding production capacity and securing raw material sources. For example, Sibelco's USD 200 Million investment demonstrates this trend.
High Purity Quartz Market Industry Insights & Trends
The High Purity Quartz market is witnessing robust growth, driven by the expanding semiconductor industry, the surge in renewable energy adoption (particularly solar), and the increasing demand for advanced optical components. Technological advancements in HPQ synthesis and purification are further boosting market expansion. Evolving consumer preferences for higher-quality electronics and environmentally friendly technologies are also contributing factors. The market size in 2025 is estimated at xx Million, projecting to reach xx Million by 2033.
The semiconductor sector, driven by the proliferation of smartphones, computers, and other electronic devices, remains the dominant application segment, and this trend is expected to continue. The solar energy sector is also a significant growth driver, due to increasing government incentives and a global push toward renewable energy.
Key Markets & Segments Leading High Purity Quartz Market
The semiconductor industry is the leading application segment for High Purity Quartz, followed closely by the solar energy sector. Geographically, North America and Asia (especially China) are currently the most significant markets.
Leading Application Segments:
- Semiconductor: High purity quartz is crucial for the manufacturing of wafers and other semiconductor components. Growth is primarily driven by the continued miniaturization of electronics and the rising demand for faster, more energy-efficient devices.
- Solar: The solar energy sector relies heavily on HPQ for the production of solar cells and wafers. Government policies supporting renewable energy and increasing awareness of environmental sustainability are key drivers.
- Others: This segment includes various applications such as lighting, telecommunications, and optics, each exhibiting moderate growth.
Geographic Dominance:
- North America: Significant production capacity, a strong semiconductor industry, and supportive government policies contribute to North America's dominance. Sibelco's recent expansion exemplifies this trend.
- Asia: The rapid growth of the electronics manufacturing sector in Asia, particularly in China, drives significant demand for HPQ.
High Purity Quartz Market Product Developments
Recent innovations focus on enhancing the purity and consistency of HPQ crystals. Improved crystal growth techniques, such as the hydrothermal method, deliver higher-quality materials with fewer impurities. Surface treatment techniques minimize defects and improve the performance of HPQ in various applications. These advancements are crucial for maintaining a competitive edge in the market.
Challenges in the High Purity Quartz Market Market
The HPQ market faces challenges like fluctuating raw material prices, stringent environmental regulations increasing production costs, and intense competition among established players and new entrants. Supply chain disruptions can also impact production and pricing. These factors can collectively reduce overall market profitability by an estimated xx%.
Forces Driving High Purity Quartz Market Growth
Several factors propel the HPQ market's growth. The rising demand for advanced electronic devices fuels the need for high-purity quartz in semiconductor manufacturing. Government initiatives supporting renewable energy development create significant demand in the solar sector. Technological advancements leading to improved HPQ production efficiency and purity contribute to market expansion.
Long-Term Growth Catalysts in the High Purity Quartz Market
Long-term growth is driven by sustained technological innovation, strategic partnerships and collaborations among key players for joint ventures to acquire raw materials and enhance production capabilities, and expansion into new geographical markets, particularly in developing economies with growing electronics and solar energy sectors.
Emerging Opportunities in High Purity Quartz Market
Emerging opportunities lie in the development of new applications for HPQ, particularly in emerging technologies like 5G telecommunications and advanced sensors. The growing demand for high-performance optical components also presents substantial market potential. Furthermore, the development of sustainable and environmentally friendly HPQ production methods is a key area for future growth.
Leading Players in the High Purity Quartz Market Sector
- Jiangsu Pacific Quartz Co Ltd
- American Elements
- Covia Holdings LLC
- Momentive Technologies
- Sibelco
- Imerys
- ULTRA HPQ
- Russian Quartz LLC
- Australian Silica Quartz Group Ltd
- The Quartz Corp
Key Milestones in High Purity Quartz Market Industry
- April 2023: Sibelco announced a USD 200 Million investment to double its HPQ installed capacity at its Spruce Pine facility in North Carolina, significantly expanding global supply. This indicates a strong positive outlook for the market.
Strategic Outlook for High Purity Quartz Market Market
The High Purity Quartz market presents significant growth potential driven by the continuous advancements in electronics and renewable energy technologies. Strategic partnerships, investments in R&D, and expansion into emerging markets will be critical for companies seeking to capitalize on these opportunities. The market is poised for substantial growth in the coming years, offering lucrative prospects for both established and emerging players.
High Purity Quartz Market Segmentation
-
1. Application
- 1.1. Semiconductor
- 1.2. Solar
- 1.3. Lighting
- 1.4. Telecom and Optics
- 1.5. Microelectronics
- 1.6. Others
High Purity Quartz Market Segmentation By Geography
-
1. Asia Pacific
- 1.1. China
- 1.2. India
- 1.3. Japan
- 1.4. South Korea
- 1.5. Rest of Asia Pacific
-
2. North America
- 2.1. United States
- 2.2. Canada
- 2.3. Mexico
-
3. Europe
- 3.1. Germany
- 3.2. United Kingdom
- 3.3. Italy
- 3.4. France
- 3.5. Rest of Europe
-
4. South America
- 4.1. Brazil
- 4.2. Argentina
- 4.3. Rest of South America
-
5. Middle East and Africa
- 5.1. Saudi Arabia
- 5.2. South Africa
- 5.3. Rest of Middle East and Africa
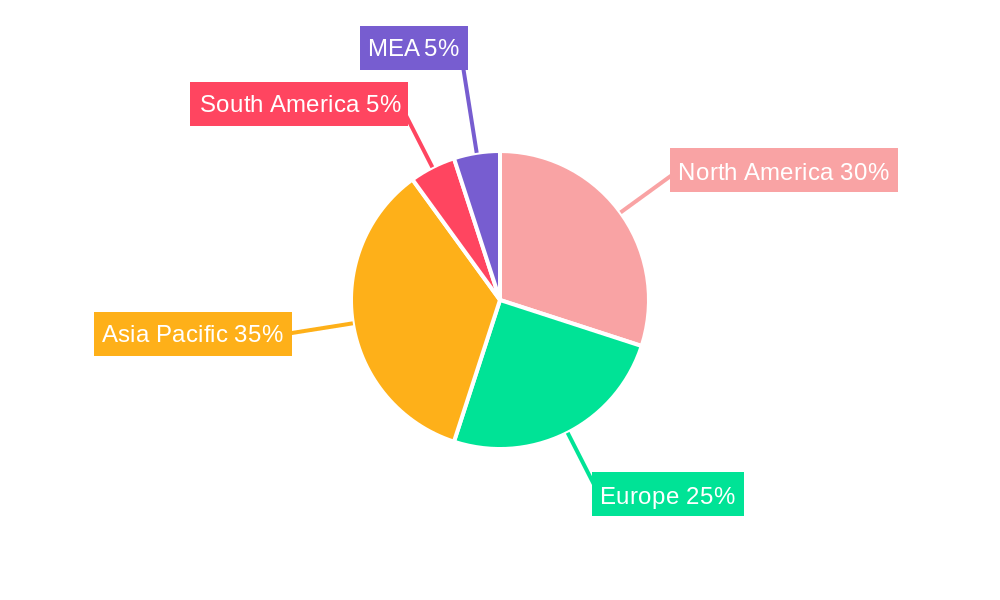
High Purity Quartz Market Regional Market Share
Geographic Coverage of High Purity Quartz Market
High Purity Quartz Market REPORT HIGHLIGHTS
| Aspects | Details |
|---|---|
| Study Period | 2020-2034 |
| Base Year | 2025 |
| Estimated Year | 2026 |
| Forecast Period | 2026-2034 |
| Historical Period | 2020-2025 |
| Growth Rate | CAGR of > 4.50% from 2020-2034 |
| Segmentation |
|
Table of Contents
- 1. Introduction
- 1.1. Research Scope
- 1.2. Market Segmentation
- 1.3. Research Objective
- 1.4. Definitions and Assumptions
- 2. Executive Summary
- 2.1. Market Snapshot
- 3. Market Dynamics
- 3.1. Market Drivers
- 3.2. Market Restrains
- 3.3. Market Trends
- 3.4. Market Opportunities
- 4. Market Factor Analysis
- 4.1. Porters Five Forces
- 4.1.1. Bargaining Power of Suppliers
- 4.1.2. Bargaining Power of Buyers
- 4.1.3. Threat of New Entrants
- 4.1.4. Threat of Substitutes
- 4.1.5. Competitive Rivalry
- 4.2. PESTEL analysis
- 4.3. BCG Analysis
- 4.3.1. Stars (High Growth, High Market Share)
- 4.3.2. Cash Cows (Low Growth, High Market Share)
- 4.3.3. Question Mark (High Growth, Low Market Share)
- 4.3.4. Dogs (Low Growth, Low Market Share)
- 4.4. Ansoff Matrix Analysis
- 4.5. Supply Chain Analysis
- 4.6. Regulatory Landscape
- 4.7. Current Market Potential and Opportunity Assessment (TAM–SAM–SOM Framework)
- 4.8. MSR Analyst Note
- 4.1. Porters Five Forces
- 5. Market Analysis, Insights and Forecast 2021-2033
- 5.1. Market Analysis, Insights and Forecast - by Application
- 5.1.1. Semiconductor
- 5.1.2. Solar
- 5.1.3. Lighting
- 5.1.4. Telecom and Optics
- 5.1.5. Microelectronics
- 5.1.6. Others
- 5.2. Market Analysis, Insights and Forecast - by Region
- 5.2.1. Asia Pacific
- 5.2.2. North America
- 5.2.3. Europe
- 5.2.4. South America
- 5.2.5. Middle East and Africa
- 5.1. Market Analysis, Insights and Forecast - by Application
- 6. Global High Purity Quartz Market Analysis, Insights and Forecast, 2021-2033
- 6.1. Market Analysis, Insights and Forecast - by Application
- 6.1.1. Semiconductor
- 6.1.2. Solar
- 6.1.3. Lighting
- 6.1.4. Telecom and Optics
- 6.1.5. Microelectronics
- 6.1.6. Others
- 6.1. Market Analysis, Insights and Forecast - by Application
- 7. Asia Pacific High Purity Quartz Market Analysis, Insights and Forecast, 2020-2032
- 7.1. Market Analysis, Insights and Forecast - by Application
- 7.1.1. Semiconductor
- 7.1.2. Solar
- 7.1.3. Lighting
- 7.1.4. Telecom and Optics
- 7.1.5. Microelectronics
- 7.1.6. Others
- 7.1. Market Analysis, Insights and Forecast - by Application
- 8. North America High Purity Quartz Market Analysis, Insights and Forecast, 2020-2032
- 8.1. Market Analysis, Insights and Forecast - by Application
- 8.1.1. Semiconductor
- 8.1.2. Solar
- 8.1.3. Lighting
- 8.1.4. Telecom and Optics
- 8.1.5. Microelectronics
- 8.1.6. Others
- 8.1. Market Analysis, Insights and Forecast - by Application
- 9. Europe High Purity Quartz Market Analysis, Insights and Forecast, 2020-2032
- 9.1. Market Analysis, Insights and Forecast - by Application
- 9.1.1. Semiconductor
- 9.1.2. Solar
- 9.1.3. Lighting
- 9.1.4. Telecom and Optics
- 9.1.5. Microelectronics
- 9.1.6. Others
- 9.1. Market Analysis, Insights and Forecast - by Application
- 10. South America High Purity Quartz Market Analysis, Insights and Forecast, 2020-2032
- 10.1. Market Analysis, Insights and Forecast - by Application
- 10.1.1. Semiconductor
- 10.1.2. Solar
- 10.1.3. Lighting
- 10.1.4. Telecom and Optics
- 10.1.5. Microelectronics
- 10.1.6. Others
- 10.1. Market Analysis, Insights and Forecast - by Application
- 11. Middle East and Africa High Purity Quartz Market Analysis, Insights and Forecast, 2020-2032
- 11.1. Market Analysis, Insights and Forecast - by Application
- 11.1.1. Semiconductor
- 11.1.2. Solar
- 11.1.3. Lighting
- 11.1.4. Telecom and Optics
- 11.1.5. Microelectronics
- 11.1.6. Others
- 11.1. Market Analysis, Insights and Forecast - by Application
- 12. Competitive Analysis
- 12.1. Company Profiles
- 12.1.1 Jiangsu Pacific Quartz Co Ltd
- 12.1.1.1. Company Overview
- 12.1.1.2. Products
- 12.1.1.3. Company Financials
- 12.1.1.4. SWOT Analysis
- 12.1.2 American Elements
- 12.1.2.1. Company Overview
- 12.1.2.2. Products
- 12.1.2.3. Company Financials
- 12.1.2.4. SWOT Analysis
- 12.1.3 Covia Holdings LLC
- 12.1.3.1. Company Overview
- 12.1.3.2. Products
- 12.1.3.3. Company Financials
- 12.1.3.4. SWOT Analysis
- 12.1.4 Momentive Technologies
- 12.1.4.1. Company Overview
- 12.1.4.2. Products
- 12.1.4.3. Company Financials
- 12.1.4.4. SWOT Analysis
- 12.1.5 Sibelco
- 12.1.5.1. Company Overview
- 12.1.5.2. Products
- 12.1.5.3. Company Financials
- 12.1.5.4. SWOT Analysis
- 12.1.6 Imerys
- 12.1.6.1. Company Overview
- 12.1.6.2. Products
- 12.1.6.3. Company Financials
- 12.1.6.4. SWOT Analysis
- 12.1.7 ULTRA HPQ
- 12.1.7.1. Company Overview
- 12.1.7.2. Products
- 12.1.7.3. Company Financials
- 12.1.7.4. SWOT Analysis
- 12.1.8 Russian Quartz LLC
- 12.1.8.1. Company Overview
- 12.1.8.2. Products
- 12.1.8.3. Company Financials
- 12.1.8.4. SWOT Analysis
- 12.1.9 Australian Silica Quartz Group Ltd
- 12.1.9.1. Company Overview
- 12.1.9.2. Products
- 12.1.9.3. Company Financials
- 12.1.9.4. SWOT Analysis
- 12.1.10 The Quartz Corp
- 12.1.10.1. Company Overview
- 12.1.10.2. Products
- 12.1.10.3. Company Financials
- 12.1.10.4. SWOT Analysis
- 12.1.1 Jiangsu Pacific Quartz Co Ltd
- 12.2. Market Entropy
- 12.2.1 Company's Key Areas Served
- 12.2.2 Recent Developments
- 12.3. Company Market Share Analysis 2025
- 12.3.1 Top 5 Companies Market Share Analysis
- 12.3.2 Top 3 Companies Market Share Analysis
- 12.4. List of Potential Customers
- 13. Research Methodology
List of Figures
- Figure 1: Global High Purity Quartz Market Revenue Breakdown (Million, %) by Region 2025 & 2033
- Figure 2: Global High Purity Quartz Market Volume Breakdown (K Tons, %) by Region 2025 & 2033
- Figure 3: Asia Pacific High Purity Quartz Market Revenue (Million), by Application 2025 & 2033
- Figure 4: Asia Pacific High Purity Quartz Market Volume (K Tons), by Application 2025 & 2033
- Figure 5: Asia Pacific High Purity Quartz Market Revenue Share (%), by Application 2025 & 2033
- Figure 6: Asia Pacific High Purity Quartz Market Volume Share (%), by Application 2025 & 2033
- Figure 7: Asia Pacific High Purity Quartz Market Revenue (Million), by Country 2025 & 2033
- Figure 8: Asia Pacific High Purity Quartz Market Volume (K Tons), by Country 2025 & 2033
- Figure 9: Asia Pacific High Purity Quartz Market Revenue Share (%), by Country 2025 & 2033
- Figure 10: Asia Pacific High Purity Quartz Market Volume Share (%), by Country 2025 & 2033
- Figure 11: North America High Purity Quartz Market Revenue (Million), by Application 2025 & 2033
- Figure 12: North America High Purity Quartz Market Volume (K Tons), by Application 2025 & 2033
- Figure 13: North America High Purity Quartz Market Revenue Share (%), by Application 2025 & 2033
- Figure 14: North America High Purity Quartz Market Volume Share (%), by Application 2025 & 2033
- Figure 15: North America High Purity Quartz Market Revenue (Million), by Country 2025 & 2033
- Figure 16: North America High Purity Quartz Market Volume (K Tons), by Country 2025 & 2033
- Figure 17: North America High Purity Quartz Market Revenue Share (%), by Country 2025 & 2033
- Figure 18: North America High Purity Quartz Market Volume Share (%), by Country 2025 & 2033
- Figure 19: Europe High Purity Quartz Market Revenue (Million), by Application 2025 & 2033
- Figure 20: Europe High Purity Quartz Market Volume (K Tons), by Application 2025 & 2033
- Figure 21: Europe High Purity Quartz Market Revenue Share (%), by Application 2025 & 2033
- Figure 22: Europe High Purity Quartz Market Volume Share (%), by Application 2025 & 2033
- Figure 23: Europe High Purity Quartz Market Revenue (Million), by Country 2025 & 2033
- Figure 24: Europe High Purity Quartz Market Volume (K Tons), by Country 2025 & 2033
- Figure 25: Europe High Purity Quartz Market Revenue Share (%), by Country 2025 & 2033
- Figure 26: Europe High Purity Quartz Market Volume Share (%), by Country 2025 & 2033
- Figure 27: South America High Purity Quartz Market Revenue (Million), by Application 2025 & 2033
- Figure 28: South America High Purity Quartz Market Volume (K Tons), by Application 2025 & 2033
- Figure 29: South America High Purity Quartz Market Revenue Share (%), by Application 2025 & 2033
- Figure 30: South America High Purity Quartz Market Volume Share (%), by Application 2025 & 2033
- Figure 31: South America High Purity Quartz Market Revenue (Million), by Country 2025 & 2033
- Figure 32: South America High Purity Quartz Market Volume (K Tons), by Country 2025 & 2033
- Figure 33: South America High Purity Quartz Market Revenue Share (%), by Country 2025 & 2033
- Figure 34: South America High Purity Quartz Market Volume Share (%), by Country 2025 & 2033
- Figure 35: Middle East and Africa High Purity Quartz Market Revenue (Million), by Application 2025 & 2033
- Figure 36: Middle East and Africa High Purity Quartz Market Volume (K Tons), by Application 2025 & 2033
- Figure 37: Middle East and Africa High Purity Quartz Market Revenue Share (%), by Application 2025 & 2033
- Figure 38: Middle East and Africa High Purity Quartz Market Volume Share (%), by Application 2025 & 2033
- Figure 39: Middle East and Africa High Purity Quartz Market Revenue (Million), by Country 2025 & 2033
- Figure 40: Middle East and Africa High Purity Quartz Market Volume (K Tons), by Country 2025 & 2033
- Figure 41: Middle East and Africa High Purity Quartz Market Revenue Share (%), by Country 2025 & 2033
- Figure 42: Middle East and Africa High Purity Quartz Market Volume Share (%), by Country 2025 & 2033
List of Tables
- Table 1: Global High Purity Quartz Market Revenue Million Forecast, by Application 2020 & 2033
- Table 2: Global High Purity Quartz Market Volume K Tons Forecast, by Application 2020 & 2033
- Table 3: Global High Purity Quartz Market Revenue Million Forecast, by Region 2020 & 2033
- Table 4: Global High Purity Quartz Market Volume K Tons Forecast, by Region 2020 & 2033
- Table 5: Global High Purity Quartz Market Revenue Million Forecast, by Application 2020 & 2033
- Table 6: Global High Purity Quartz Market Volume K Tons Forecast, by Application 2020 & 2033
- Table 7: Global High Purity Quartz Market Revenue Million Forecast, by Country 2020 & 2033
- Table 8: Global High Purity Quartz Market Volume K Tons Forecast, by Country 2020 & 2033
- Table 9: China High Purity Quartz Market Revenue (Million) Forecast, by Application 2020 & 2033
- Table 10: China High Purity Quartz Market Volume (K Tons) Forecast, by Application 2020 & 2033
- Table 11: India High Purity Quartz Market Revenue (Million) Forecast, by Application 2020 & 2033
- Table 12: India High Purity Quartz Market Volume (K Tons) Forecast, by Application 2020 & 2033
- Table 13: Japan High Purity Quartz Market Revenue (Million) Forecast, by Application 2020 & 2033
- Table 14: Japan High Purity Quartz Market Volume (K Tons) Forecast, by Application 2020 & 2033
- Table 15: South Korea High Purity Quartz Market Revenue (Million) Forecast, by Application 2020 & 2033
- Table 16: South Korea High Purity Quartz Market Volume (K Tons) Forecast, by Application 2020 & 2033
- Table 17: Rest of Asia Pacific High Purity Quartz Market Revenue (Million) Forecast, by Application 2020 & 2033
- Table 18: Rest of Asia Pacific High Purity Quartz Market Volume (K Tons) Forecast, by Application 2020 & 2033
- Table 19: Global High Purity Quartz Market Revenue Million Forecast, by Application 2020 & 2033
- Table 20: Global High Purity Quartz Market Volume K Tons Forecast, by Application 2020 & 2033
- Table 21: Global High Purity Quartz Market Revenue Million Forecast, by Country 2020 & 2033
- Table 22: Global High Purity Quartz Market Volume K Tons Forecast, by Country 2020 & 2033
- Table 23: United States High Purity Quartz Market Revenue (Million) Forecast, by Application 2020 & 2033
- Table 24: United States High Purity Quartz Market Volume (K Tons) Forecast, by Application 2020 & 2033
- Table 25: Canada High Purity Quartz Market Revenue (Million) Forecast, by Application 2020 & 2033
- Table 26: Canada High Purity Quartz Market Volume (K Tons) Forecast, by Application 2020 & 2033
- Table 27: Mexico High Purity Quartz Market Revenue (Million) Forecast, by Application 2020 & 2033
- Table 28: Mexico High Purity Quartz Market Volume (K Tons) Forecast, by Application 2020 & 2033
- Table 29: Global High Purity Quartz Market Revenue Million Forecast, by Application 2020 & 2033
- Table 30: Global High Purity Quartz Market Volume K Tons Forecast, by Application 2020 & 2033
- Table 31: Global High Purity Quartz Market Revenue Million Forecast, by Country 2020 & 2033
- Table 32: Global High Purity Quartz Market Volume K Tons Forecast, by Country 2020 & 2033
- Table 33: Germany High Purity Quartz Market Revenue (Million) Forecast, by Application 2020 & 2033
- Table 34: Germany High Purity Quartz Market Volume (K Tons) Forecast, by Application 2020 & 2033
- Table 35: United Kingdom High Purity Quartz Market Revenue (Million) Forecast, by Application 2020 & 2033
- Table 36: United Kingdom High Purity Quartz Market Volume (K Tons) Forecast, by Application 2020 & 2033
- Table 37: Italy High Purity Quartz Market Revenue (Million) Forecast, by Application 2020 & 2033
- Table 38: Italy High Purity Quartz Market Volume (K Tons) Forecast, by Application 2020 & 2033
- Table 39: France High Purity Quartz Market Revenue (Million) Forecast, by Application 2020 & 2033
- Table 40: France High Purity Quartz Market Volume (K Tons) Forecast, by Application 2020 & 2033
- Table 41: Rest of Europe High Purity Quartz Market Revenue (Million) Forecast, by Application 2020 & 2033
- Table 42: Rest of Europe High Purity Quartz Market Volume (K Tons) Forecast, by Application 2020 & 2033
- Table 43: Global High Purity Quartz Market Revenue Million Forecast, by Application 2020 & 2033
- Table 44: Global High Purity Quartz Market Volume K Tons Forecast, by Application 2020 & 2033
- Table 45: Global High Purity Quartz Market Revenue Million Forecast, by Country 2020 & 2033
- Table 46: Global High Purity Quartz Market Volume K Tons Forecast, by Country 2020 & 2033
- Table 47: Brazil High Purity Quartz Market Revenue (Million) Forecast, by Application 2020 & 2033
- Table 48: Brazil High Purity Quartz Market Volume (K Tons) Forecast, by Application 2020 & 2033
- Table 49: Argentina High Purity Quartz Market Revenue (Million) Forecast, by Application 2020 & 2033
- Table 50: Argentina High Purity Quartz Market Volume (K Tons) Forecast, by Application 2020 & 2033
- Table 51: Rest of South America High Purity Quartz Market Revenue (Million) Forecast, by Application 2020 & 2033
- Table 52: Rest of South America High Purity Quartz Market Volume (K Tons) Forecast, by Application 2020 & 2033
- Table 53: Global High Purity Quartz Market Revenue Million Forecast, by Application 2020 & 2033
- Table 54: Global High Purity Quartz Market Volume K Tons Forecast, by Application 2020 & 2033
- Table 55: Global High Purity Quartz Market Revenue Million Forecast, by Country 2020 & 2033
- Table 56: Global High Purity Quartz Market Volume K Tons Forecast, by Country 2020 & 2033
- Table 57: Saudi Arabia High Purity Quartz Market Revenue (Million) Forecast, by Application 2020 & 2033
- Table 58: Saudi Arabia High Purity Quartz Market Volume (K Tons) Forecast, by Application 2020 & 2033
- Table 59: South Africa High Purity Quartz Market Revenue (Million) Forecast, by Application 2020 & 2033
- Table 60: South Africa High Purity Quartz Market Volume (K Tons) Forecast, by Application 2020 & 2033
- Table 61: Rest of Middle East and Africa High Purity Quartz Market Revenue (Million) Forecast, by Application 2020 & 2033
- Table 62: Rest of Middle East and Africa High Purity Quartz Market Volume (K Tons) Forecast, by Application 2020 & 2033
Frequently Asked Questions
1. What is the projected Compound Annual Growth Rate (CAGR) of the High Purity Quartz Market?
The projected CAGR is approximately > 4.50%.
2. Which companies are prominent players in the High Purity Quartz Market?
Key companies in the market include Jiangsu Pacific Quartz Co Ltd, American Elements, Covia Holdings LLC, Momentive Technologies, Sibelco, Imerys, ULTRA HPQ, Russian Quartz LLC, Australian Silica Quartz Group Ltd, The Quartz Corp.
3. What are the main segments of the High Purity Quartz Market?
The market segments include Application.
4. Can you provide details about the market size?
The market size is estimated to be USD 672.93 Million as of 2022.
5. What are some drivers contributing to market growth?
Growing Demand for Semiconductor ICs; Increasing Adoption in Solar Industry; Other Drivers.
6. What are the notable trends driving market growth?
Growing Demand from Semiconductor Industry.
7. Are there any restraints impacting market growth?
The Fluctuating Prices of Raw Materials; Other Restraints.
8. Can you provide examples of recent developments in the market?
April 2023: Sibelco announced an investment of approx. USD 200 million to double high purity quartz (HPQ) installed capacity at its Spruce Pine facility in North Carolina, United States.
9. What pricing options are available for accessing the report?
Pricing options include single-user, multi-user, and enterprise licenses priced at USD 4750, USD 5250, and USD 8750 respectively.
10. Is the market size provided in terms of value or volume?
The market size is provided in terms of value, measured in Million and volume, measured in K Tons.
11. Are there any specific market keywords associated with the report?
Yes, the market keyword associated with the report is "High Purity Quartz Market," which aids in identifying and referencing the specific market segment covered.
12. How do I determine which pricing option suits my needs best?
The pricing options vary based on user requirements and access needs. Individual users may opt for single-user licenses, while businesses requiring broader access may choose multi-user or enterprise licenses for cost-effective access to the report.
13. Are there any additional resources or data provided in the High Purity Quartz Market report?
While the report offers comprehensive insights, it's advisable to review the specific contents or supplementary materials provided to ascertain if additional resources or data are available.
14. How can I stay updated on further developments or reports in the High Purity Quartz Market?
To stay informed about further developments, trends, and reports in the High Purity Quartz Market, consider subscribing to industry newsletters, following relevant companies and organizations, or regularly checking reputable industry news sources and publications.
Methodology
Step 1 - Identification of Relevant Samples Size from Population Database


Step 2 - Approaches for Defining Global Market Size (Value, Volume* & Price*)

Note*: In applicable scenarios
Step 3 - Data Sources
Primary Research
- Web Analytics
- Survey Reports
- Research Institute
- Latest Research Reports
- Opinion Leaders
Secondary Research
- Annual Reports
- White Paper
- Latest Press Release
- Industry Association
- Paid Database
- Investor Presentations

Step 4 - Data Triangulation
Involves using different sources of information in order to increase the validity of a study
These sources are likely to be stakeholders in a program - participants, other researchers, program staff, other community members, and so on.
Then we put all data in single framework & apply various statistical tools to find out the dynamic on the market.
During the analysis stage, feedback from the stakeholder groups would be compared to determine areas of agreement as well as areas of divergence