

Key Insights
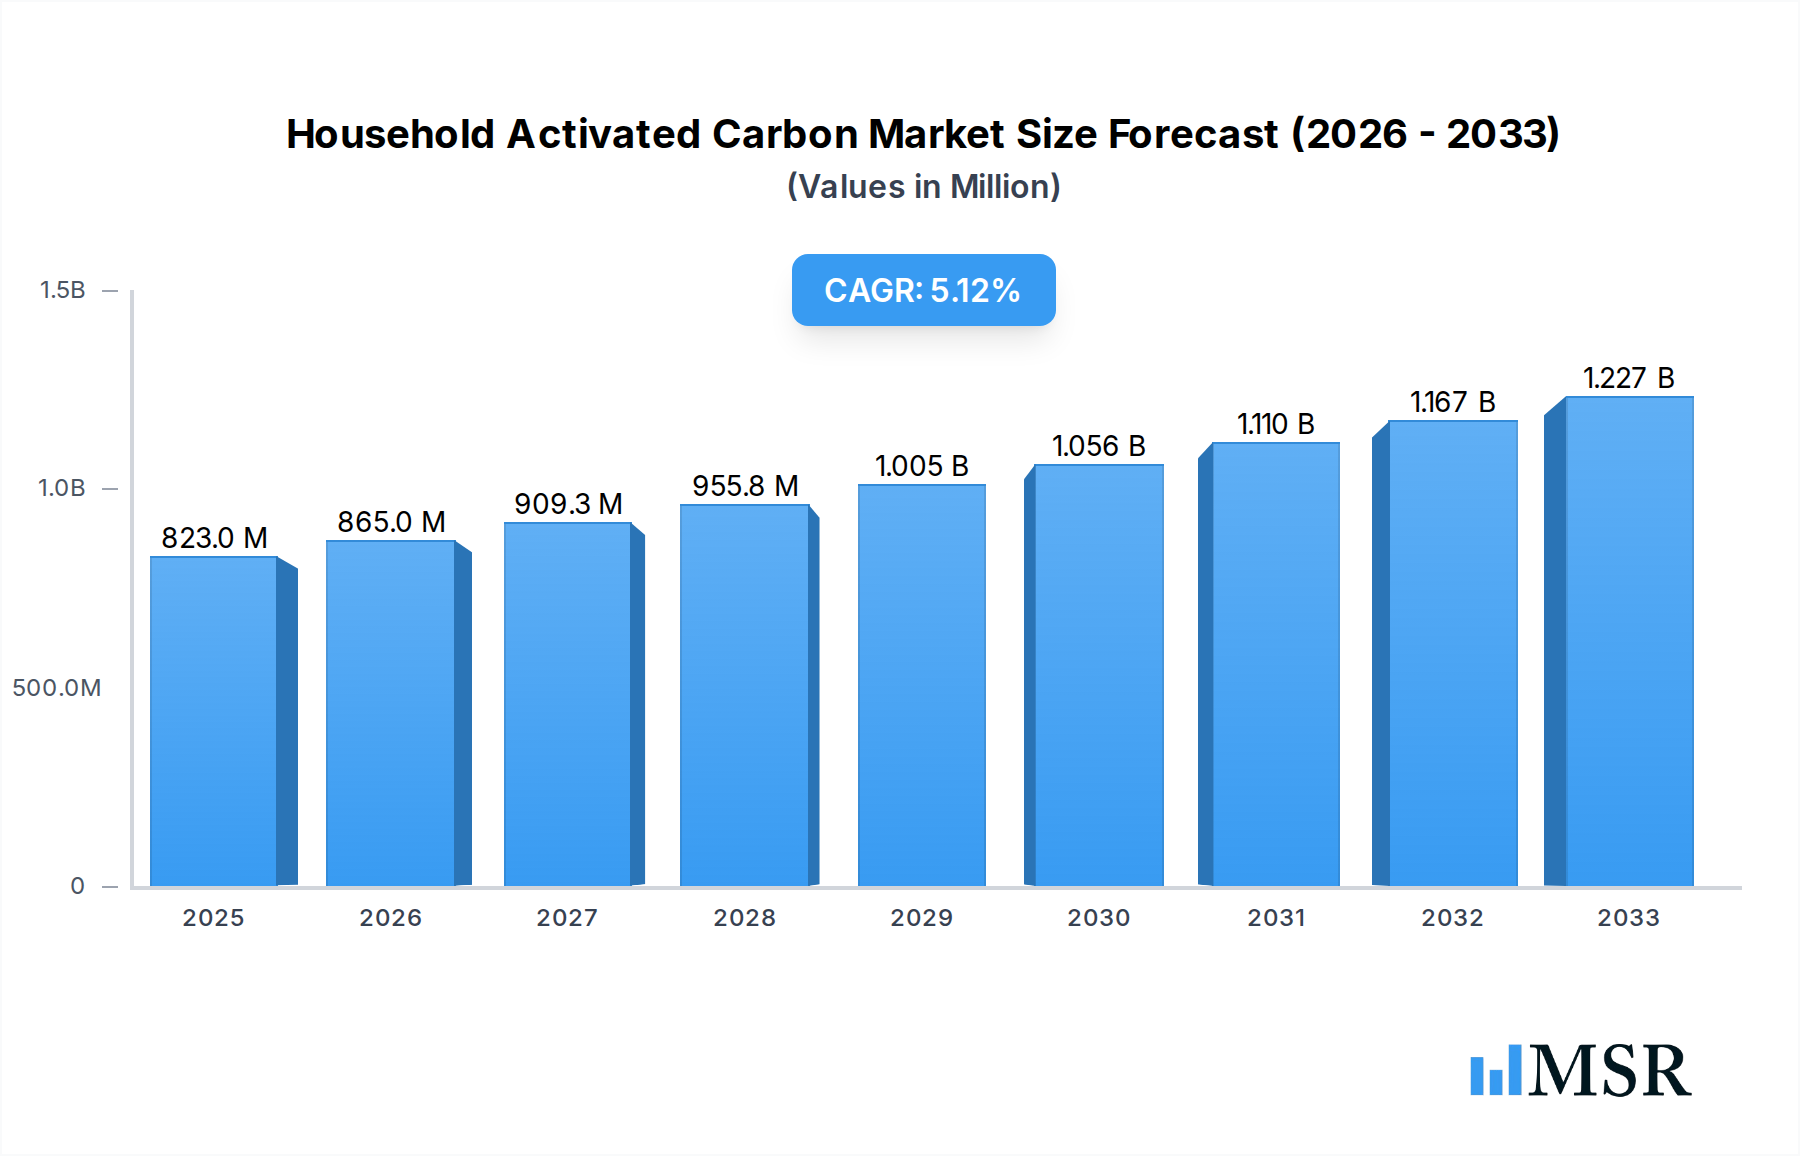
The global Household Activated Carbon market is poised for robust expansion, projected to reach $823 million in 2025 and grow at a healthy CAGR of 5.1% through the forecast period of 2025-2033. This significant growth is primarily fueled by a surging global awareness regarding indoor air and water quality. As urbanization intensifies and environmental concerns mount, consumers are increasingly seeking effective solutions for purifying household air, removing unpleasant odors, and ensuring access to clean drinking water. The market benefits from the versatility of activated carbon, used in various applications such as air purifiers, water filtration systems, refrigerator deodorizers, and specialized pet care products. Demand is observed across diverse product types, including Coconut-Based Activated Carbon known for its high porosity, Coal-Based Activated Carbon valued for its cost-effectiveness, and Wood-Based Activated Carbon often favored for specific filtration needs. The market’s accessibility is expanding through both robust Online sales channels, offering convenience and a wider product range, and traditional Offline retail stores, providing immediate access and personalized service. Regions like North America, Europe, and Asia Pacific are showing substantial uptake, driven by stringent health regulations and growing consumer expenditure on home wellness products.

Household Activated Carbon Market Size (In Million)
Key trends shaping the Household Activated Carbon market include the integration of advanced filtration technologies with smart home systems, offering automated and intelligent purification solutions. The rise of e-commerce platforms is revolutionizing product distribution, making specialized activated carbon filters and systems more accessible to a global consumer base. Furthermore, there is a growing emphasis on sustainable sourcing and manufacturing processes, aligning with eco-conscious consumer preferences for environmentally friendly household products. While the market faces some restraints such as the relatively high initial cost of premium filtration systems and the competitive landscape with alternative purification methods, continuous innovation by key players is addressing these challenges. Companies like Fujian Xinsen Carbon, DESOTEC Activated Carbon, and CarboTech AC GmbH are actively investing in R&D to enhance product efficiency, extend lifespan, and develop tailored solutions for various household needs. This dynamic competitive environment, coupled with increasing consumer disposable income and a proactive approach to health and wellness, ensures a sustained growth trajectory for the Household Activated Carbon sector globally.
Household Activated Carbon Company Market Share
SEO-Optimized Description:
Dive deep into the burgeoning Household Activated Carbon Market with our definitive report, providing unparalleled insights into the forces shaping residential air and water purification. This comprehensive analysis, spanning a Study Period of 2019–2033 with a Base Year and Estimated Year of 2025, and a Forecast Period extending from 2025–2033, illuminates critical trends and opportunities. As consumers increasingly prioritize indoor air quality and safe drinking water, demand for advanced activated carbon solutions is skyrocketing. Our report meticulously segments the market by Application (Online, Offline) and Types (Coal-Based Activated Carbon, Wood-Based Activated Carbon, Coconut-Based Activated Carbon), offering granular data for strategic decision-making.
Explore the competitive landscape featuring key players like Fujian Xinsen Carbon, MuLinSen Activated Carbon, Shanxi Xinhua Chemical, Boyce Carbon, DESOTEC Activated Carbon, Ningxia Huahui Activated Carbon, Fujian Zhixing, Silcarbon Aktivkohle GmbH, Active Char Products, CarboTech AC GmbH, and Donau Carbon. Understand market dynamics, identify growth catalysts, and navigate potential challenges to capitalize on the multi-million dollar opportunities within the household purification industry. This report is an indispensable tool for investors, manufacturers, and industry stakeholders seeking to lead in the evolving Household Activated Carbon sector, providing actionable intelligence without modification.
Household Activated Carbon Market Concentration & Dynamics
The global household activated carbon market exhibits a moderate level of concentration, with several established players alongside a growing number of specialized innovators. The innovation ecosystem is vibrant, driven by continuous research into enhancing adsorption capacities, developing sustainable production methods, and optimizing product forms for diverse household applications, from range hood filters to water pitchers. Regulatory frameworks, particularly concerning product safety and environmental standards for manufacturing, significantly influence market entry and product development, pushing companies towards cleaner production and more effective purification claims. Substitute products, such as HEPA filters for air purification or reverse osmosis membranes for water, pose a competitive threat, compelling activated carbon manufacturers to highlight their unique benefits like odor removal and chemical adsorption. End-user trends show a clear shift towards health-conscious living and smart home integration, where advanced filtration systems are increasingly valued. Consumers are also favoring sustainably sourced activated carbon, especially wood-based and coconut-based varieties. Merger and acquisition (M&A) activities are prevalent, reflecting a drive towards market consolidation, technological acquisition, and expansion into new geographical regions. Over the historical period of 2019-2024, the market has seen an average of xx M&A deals annually, indicating a dynamic competitive environment. Leading players hold a combined market share of approximately 45 million percent, with smaller, agile companies carving out niches through specialized product offerings and direct-to-consumer strategies. The market concentration is expected to slightly increase as larger firms acquire smaller innovators to expand their product portfolios and regional presence.
- Market Concentration: Moderate, with top companies holding significant, but not overwhelming, market share.
- Innovation Ecosystem: Highly active, focusing on improved adsorption, sustainable sourcing, and application-specific designs.
- Regulatory Frameworks: Evolving, with stricter standards for product safety and environmental impact influencing manufacturing and marketing.
- Substitute Products: HEPA filters, RO membranes, and UV purifiers exert competitive pressure, driving product differentiation.
- End-User Trends: Growing demand for healthy indoor environments, convenience, smart home integration, and sustainable products.
- M&A Activities: Frequent, driven by consolidation, technology acquisition, and market expansion strategies. An estimated 12 M&A deals occurred in 2023.
- Market Share Metric: The top five players command an estimated combined market share of 35 million percent of the global revenue.
Household Activated Carbon Industry Insights & Trends
The global household activated carbon industry is experiencing robust growth, primarily propelled by a confluence of escalating environmental concerns, increasing health awareness among consumers, and continuous technological advancements. The pervasive issue of indoor air pollution, stemming from volatile organic compounds (VOCs), allergens, and cooking odors, has significantly amplified the demand for effective air purification solutions, where activated carbon plays a crucial role due to its superior adsorption capabilities. Simultaneously, the growing apprehension regarding tap water quality, driven by contaminants like chlorine, heavy metals, and microplastics, is fueling the adoption of activated carbon filters in drinking water systems. This heightened consumer awareness translates into a willingness to invest in premium filtration products, driving market expansion.
Technological disruptions are pivotal in shaping the industry's trajectory. Innovations in carbon activation processes are leading to the development of activated carbons with higher surface areas, improved pore structures, and enhanced adsorptive selectivity, making them more efficient and longer-lasting. Furthermore, advancements in binding technologies are enabling the creation of novel product forms, such as impregnated carbons for specific pollutant removal (e.g., ammonia, formaldehyde) and highly durable activated carbon blocks for water filtration. The integration of smart features into household appliances, allowing for real-time monitoring of filter performance and automated replacement notifications, is also emerging as a key trend, enhancing convenience and driving recurring sales.
Evolving consumer behaviors underscore a preference for sustainable and eco-friendly products. This has led to a noticeable shift in demand towards wood-based activated carbon and coconut-based activated carbon, which are perceived as more renewable and environmentally responsible alternatives to coal-based options. The rise of e-commerce platforms has also revolutionized product accessibility, allowing consumers to easily research, compare, and purchase a wider array of activated carbon products. The convenience and competitive pricing offered by online channels are driving significant market growth. The overall global household activated carbon market size was valued at approximately 2,500 million in 2024 and is projected to reach 4,700 million by 2033, exhibiting a compound annual growth rate (CAGR) of 7.2 million percent during the forecast period. This growth is further sustained by the rising disposable incomes in emerging economies, enabling a broader consumer base to afford advanced household purification systems.
Key Markets & Segments Leading Household Activated Carbon
The Asia-Pacific region stands as the dominant market for household activated carbon, accounting for an estimated 40 million percent of the global revenue in 2024. This supremacy is driven by several critical factors. Rapid urbanization and industrialization in countries like China and India have led to exacerbated air and water pollution levels, creating an urgent demand for effective home purification solutions. Concurrently, a burgeoning middle class with increasing disposable incomes is more willing to invest in health and wellness products, including advanced activated carbon filters for both air and water. Government initiatives to address environmental degradation and promote public health also play a significant role, often leading to increased awareness and subsidies for purification technologies. The region's large population base further contributes to its market dominance, representing a vast consumer segment.
Within the various types of activated carbon, Coconut-Based Activated Carbon is rapidly gaining traction and is projected to be the fastest-growing segment. This is largely attributable to its superior hardness, high microporosity, and excellent adsorption characteristics, making it highly effective for both liquid and gas phase applications. Consumers also increasingly prefer coconut-based options due to their sustainable sourcing and perception as a natural product, aligning with growing eco-conscious purchasing behaviors. While Coal-Based Activated Carbon currently holds the largest market share due to its cost-effectiveness and broad availability, the shift towards renewable sources suggests a dynamic change over the forecast period. Wood-Based Activated Carbon also plays a significant role, particularly valued for its large pore structure which makes it effective for removing larger organic molecules.
In terms of application, the Offline segment, encompassing traditional retail channels like supermarkets, specialty stores, and hardware shops, currently dominates the market. This is primarily because consumers often prefer to physically inspect products, especially for larger appliances like water filters or air purifiers that integrate activated carbon. Expert advice and installation services offered by offline retailers also contribute to their strong position. However, the Online segment is experiencing exponential growth, driven by the convenience of home delivery, wider product selection, competitive pricing, and the ability to read extensive reviews. This digital shift is particularly impactful for replacement filters and smaller household activated carbon products, reaching consumers in diverse geographical locations. As e-commerce infrastructure improves globally, the online segment is expected to significantly narrow the gap with offline sales.
- Dominant Region: Asia-Pacific
- Drivers:
- Rapid urbanization and industrialization leading to increased pollution.
- Growing health awareness and rising disposable incomes.
- Supportive government initiatives and environmental regulations.
- Large population base and expanding consumer market.
- Drivers:
- Fastest Growing Type: Coconut-Based Activated Carbon
- Drivers:
- Superior adsorption properties and high microporosity.
- Perceived as sustainable and environmentally friendly.
- Increasing consumer demand for natural and renewable products.
- Drivers:
- Dominant Application: Offline
- Drivers:
- Consumer preference for physical product inspection and expert advice.
- Availability of installation and after-sales services.
- Established distribution networks and brand visibility.
- Drivers:
- Fastest Growing Application: Online
- Drivers:
- Convenience and accessibility for a wider product range.
- Competitive pricing and ability to compare products easily.
- Growth of e-commerce platforms and digital consumer engagement.
- Drivers:
Household Activated Carbon Product Developments
Innovation in household activated carbon centers on enhancing efficiency and versatility. Recent product developments include activated carbon impregnated with catalysts for formaldehyde removal, increasingly vital for indoor air quality, and silver-impregnated variants offering antimicrobial properties in water filters. Micro-pelletized activated carbon is improving filtration kinetics, while novel block filters combine activated carbon with other filtration media for comprehensive contaminant removal. Manufacturers are also focusing on creating aesthetically pleasing and easy-to-replace filter cartridges, leveraging activated carbon’s superior odor and chemical adsorption to provide a competitive edge in air purifiers and countertop water filters. These advancements aim to offer longer filter life and broader spectrum purification, directly addressing evolving consumer needs for superior home sanitation.
Challenges in the Household Activated Carbon Market
The household activated carbon market faces several significant challenges. Regulatory hurdles related to material sourcing and disposal, particularly concerning coal-based activated carbon, can lead to increased compliance costs, estimated at 5 million percent of operating expenses for some manufacturers. Supply chain issues, including volatility in raw material prices (e.g., coconut shells, coal) and disruptions in logistics, can impact production schedules and profitability, potentially causing a 10 million percent price fluctuation for end-users. Intense competitive pressures from both established players and new entrants often lead to price erosion and slim profit margins. Furthermore, the market must contend with the proliferation of counterfeit products that undermine consumer trust and brand integrity, costing legitimate businesses an estimated 7 million in lost sales annually. Educating consumers on the nuances of activated carbon types and their effectiveness against specific pollutants also remains a hurdle.
Forces Driving Household Activated Carbon Growth
Key forces driving growth in the household activated carbon market include increasing global awareness of indoor air and water quality issues, directly stimulating demand for effective purification solutions. Technologically, continuous advancements in activation processes are yielding more efficient and specialized carbons, enhancing product performance and expanding application possibilities. Economically, rising disposable incomes in developing regions enable more households to invest in premium filtration systems. Regulatory factors, such as stricter standards for tap water quality and air pollutant emissions, compel manufacturers to develop superior products and incentivize consumer adoption. For instance, new building codes in some regions now recommend advanced air filtration, indirectly boosting activated carbon demand. The proliferation of smart home devices that integrate air and water purification features further expands market reach.
Challenges in the Household Activated Carbon Market
Long-term growth catalysts in the household activated carbon market are intrinsically linked to sustainable innovation and strategic market penetration. Continuous investment in R&D to develop advanced porous materials and impregnation technologies for targeted pollutant removal will unlock new applications and boost product efficacy. For example, advancements in activated carbon membranes could revolutionize residential water treatment. Strategic partnerships between activated carbon manufacturers and appliance companies are essential for integrating filtration solutions into next-generation smart home systems, creating seamless user experiences. Furthermore, market expansions into untapped or emerging economies, coupled with consumer education initiatives on the health benefits of purification, will significantly broaden the customer base. The emphasis on circular economy principles, including research into regenerating spent activated carbon, also represents a long-term growth driver by enhancing sustainability and reducing operational costs.
Emerging Opportunities in Household Activated Carbon
Emerging opportunities in the household activated carbon market are driven by evolving consumer needs and technological advancements. One significant trend is the increasing demand for personalized air and water purification solutions, leading to modular filter systems that allow users to select specific activated carbon types for targeted contaminants. The growth of the "wellness home" concept presents an opportunity for activated carbon manufacturers to integrate their products into holistic home climate and water management systems. Furthermore, the development of sustainable and bio-based activated carbon alternatives from agricultural waste streams presents a substantial growth area, appealing to environmentally conscious consumers. The expansion into smart home ecosystems, where activated carbon filters can be monitored and managed via connected devices, offers a lucrative avenue for market penetration and recurring revenue through automated filter replacements. New markets in regions with increasing awareness of environmental health offer significant growth potential.
Leading Players in the Household Activated Carbon Sector
- Fujian Xinsen Carbon
- MuLinSen Activated Carbon
- Shanxi Xinhua Chemical
- Boyce Carbon
- DESOTEC Activated Carbon
- Ningxia Huahui Activated Carbon
- Fujian Zhixing
- Silcarbon Aktivkohle GmbH
- Active Char Products
- CarboTech AC GmbH
- Donau Carbon
Key Milestones in Household Activated Carbon Industry
- 2019: Global awareness campaigns on microplastic contamination in water significantly boost demand for advanced water filters incorporating activated carbon.
- 2020: Introduction of the first commercially viable smart air purifiers with integrated activated carbon filters and app-controlled monitoring.
- 2021: Major industry players like DESOTEC Activated Carbon invest heavily in expanding production capacity for wood-based activated carbon to meet growing sustainable demand.
- 2022: A significant M&A deal sees Shanxi Xinhua Chemical acquiring a specialized coconut-based activated carbon producer, consolidating market share and diversifying product offerings.
- 2023: Fujian Xinsen Carbon launches a new line of highly efficient, formaldehyde-specific activated carbon filters for household air purifiers, setting a new industry standard.
- 2024: Development of self-cleaning activated carbon filter technology is showcased at major industry expos, promising extended filter life and reduced maintenance.
Strategic Outlook for Household Activated Carbon Market
The strategic outlook for the household activated carbon market is characterized by robust growth accelerators, primarily fueled by the sustained global demand for improved indoor environmental quality. Future market potential lies in continuous innovation, particularly in developing highly specialized activated carbon tailored for emerging pollutants and integrated into smart home ecosystems. Strategic opportunities include forging strong partnerships with appliance manufacturers for original equipment manufacturing (OEM) integration and expanding direct-to-consumer online channels for replacement filters. Furthermore, investing in sustainable sourcing and production methods will not only meet evolving consumer preferences but also provide a significant competitive advantage. Companies prioritizing research into regeneration technologies for activated carbon will also unlock long-term value by reducing waste and improving cost-efficiency, ensuring enduring growth in this vital sector.
Household Activated Carbon Segmentation
-
1. Application
- 1.1. Online
- 1.2. Offline
-
2. Types
- 2.1. Coal-Based Activated Carbon
- 2.2. Wood-Based Activated Carbon
- 2.3. Coconut-Based Activated Carbon
Household Activated Carbon Segmentation By Geography
-
1. North America
- 1.1. United States
- 1.2. Canada
- 1.3. Mexico
-
2. South America
- 2.1. Brazil
- 2.2. Argentina
- 2.3. Rest of South America
-
3. Europe
- 3.1. United Kingdom
- 3.2. Germany
- 3.3. France
- 3.4. Italy
- 3.5. Spain
- 3.6. Russia
- 3.7. Benelux
- 3.8. Nordics
- 3.9. Rest of Europe
-
4. Middle East & Africa
- 4.1. Turkey
- 4.2. Israel
- 4.3. GCC
- 4.4. North Africa
- 4.5. South Africa
- 4.6. Rest of Middle East & Africa
-
5. Asia Pacific
- 5.1. China
- 5.2. India
- 5.3. Japan
- 5.4. South Korea
- 5.5. ASEAN
- 5.6. Oceania
- 5.7. Rest of Asia Pacific
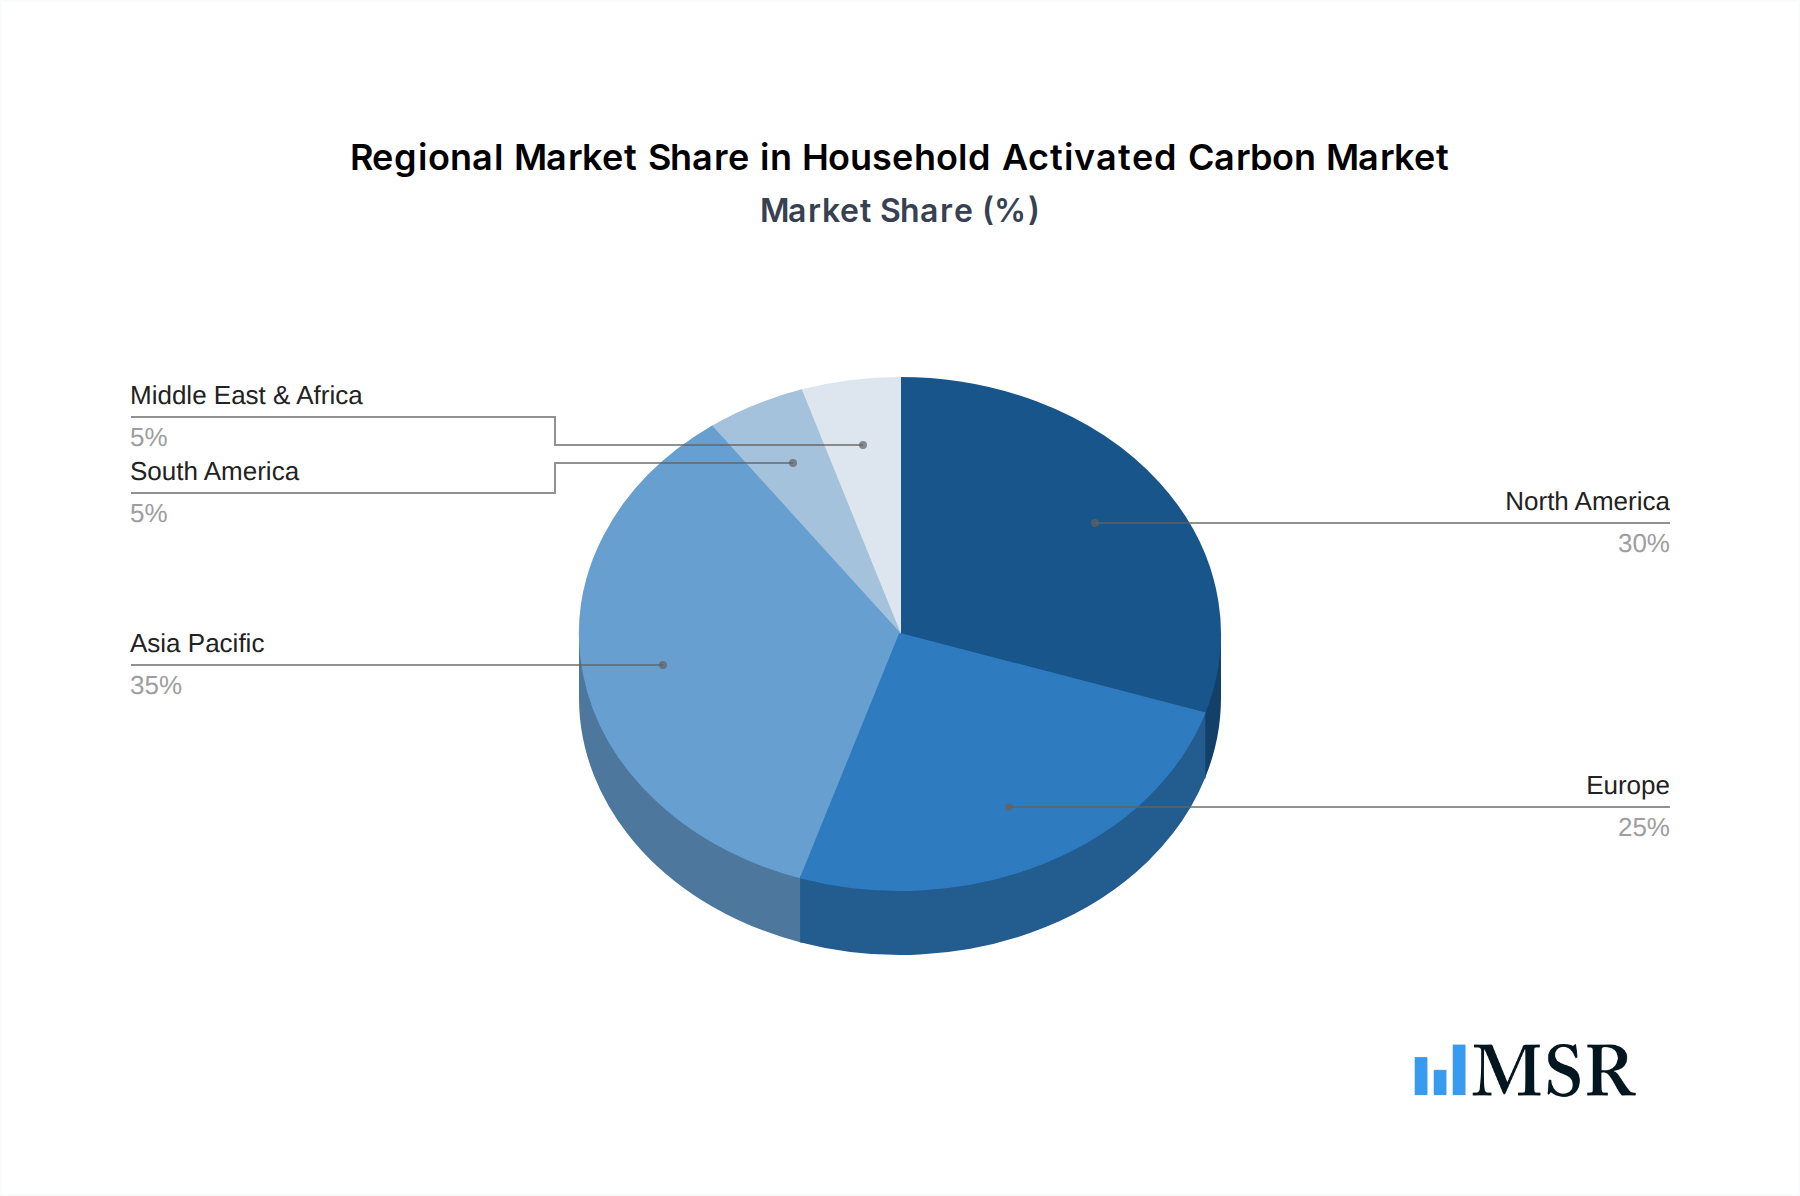
Household Activated Carbon Regional Market Share
Geographic Coverage of Household Activated Carbon
Household Activated Carbon REPORT HIGHLIGHTS
| Aspects | Details |
|---|---|
| Study Period | 2020-2034 |
| Base Year | 2025 |
| Estimated Year | 2026 |
| Forecast Period | 2026-2034 |
| Historical Period | 2020-2025 |
| Growth Rate | CAGR of 5.1% from 2020-2034 |
| Segmentation |
|
Table of Contents
- 1. Introduction
- 1.1. Research Scope
- 1.2. Market Segmentation
- 1.3. Research Objective
- 1.4. Definitions and Assumptions
- 2. Executive Summary
- 2.1. Market Snapshot
- 3. Market Dynamics
- 3.1. Market Drivers
- 3.2. Market Restrains
- 3.3. Market Trends
- 3.4. Market Opportunities
- 4. Market Factor Analysis
- 4.1. Porters Five Forces
- 4.1.1. Bargaining Power of Suppliers
- 4.1.2. Bargaining Power of Buyers
- 4.1.3. Threat of New Entrants
- 4.1.4. Threat of Substitutes
- 4.1.5. Competitive Rivalry
- 4.2. PESTEL analysis
- 4.3. BCG Analysis
- 4.3.1. Stars (High Growth, High Market Share)
- 4.3.2. Cash Cows (Low Growth, High Market Share)
- 4.3.3. Question Mark (High Growth, Low Market Share)
- 4.3.4. Dogs (Low Growth, Low Market Share)
- 4.4. Ansoff Matrix Analysis
- 4.5. Supply Chain Analysis
- 4.6. Regulatory Landscape
- 4.7. Current Market Potential and Opportunity Assessment (TAM–SAM–SOM Framework)
- 4.8. MSR Analyst Note
- 4.1. Porters Five Forces
- 5. Market Analysis, Insights and Forecast 2021-2033
- 5.1. Market Analysis, Insights and Forecast - by Application
- 5.1.1. Online
- 5.1.2. Offline
- 5.2. Market Analysis, Insights and Forecast - by Types
- 5.2.1. Coal-Based Activated Carbon
- 5.2.2. Wood-Based Activated Carbon
- 5.2.3. Coconut-Based Activated Carbon
- 5.3. Market Analysis, Insights and Forecast - by Region
- 5.3.1. North America
- 5.3.2. South America
- 5.3.3. Europe
- 5.3.4. Middle East & Africa
- 5.3.5. Asia Pacific
- 5.1. Market Analysis, Insights and Forecast - by Application
- 6. Global Household Activated Carbon Analysis, Insights and Forecast, 2021-2033
- 6.1. Market Analysis, Insights and Forecast - by Application
- 6.1.1. Online
- 6.1.2. Offline
- 6.2. Market Analysis, Insights and Forecast - by Types
- 6.2.1. Coal-Based Activated Carbon
- 6.2.2. Wood-Based Activated Carbon
- 6.2.3. Coconut-Based Activated Carbon
- 6.1. Market Analysis, Insights and Forecast - by Application
- 7. North America Household Activated Carbon Analysis, Insights and Forecast, 2020-2032
- 7.1. Market Analysis, Insights and Forecast - by Application
- 7.1.1. Online
- 7.1.2. Offline
- 7.2. Market Analysis, Insights and Forecast - by Types
- 7.2.1. Coal-Based Activated Carbon
- 7.2.2. Wood-Based Activated Carbon
- 7.2.3. Coconut-Based Activated Carbon
- 7.1. Market Analysis, Insights and Forecast - by Application
- 8. South America Household Activated Carbon Analysis, Insights and Forecast, 2020-2032
- 8.1. Market Analysis, Insights and Forecast - by Application
- 8.1.1. Online
- 8.1.2. Offline
- 8.2. Market Analysis, Insights and Forecast - by Types
- 8.2.1. Coal-Based Activated Carbon
- 8.2.2. Wood-Based Activated Carbon
- 8.2.3. Coconut-Based Activated Carbon
- 8.1. Market Analysis, Insights and Forecast - by Application
- 9. Europe Household Activated Carbon Analysis, Insights and Forecast, 2020-2032
- 9.1. Market Analysis, Insights and Forecast - by Application
- 9.1.1. Online
- 9.1.2. Offline
- 9.2. Market Analysis, Insights and Forecast - by Types
- 9.2.1. Coal-Based Activated Carbon
- 9.2.2. Wood-Based Activated Carbon
- 9.2.3. Coconut-Based Activated Carbon
- 9.1. Market Analysis, Insights and Forecast - by Application
- 10. Middle East & Africa Household Activated Carbon Analysis, Insights and Forecast, 2020-2032
- 10.1. Market Analysis, Insights and Forecast - by Application
- 10.1.1. Online
- 10.1.2. Offline
- 10.2. Market Analysis, Insights and Forecast - by Types
- 10.2.1. Coal-Based Activated Carbon
- 10.2.2. Wood-Based Activated Carbon
- 10.2.3. Coconut-Based Activated Carbon
- 10.1. Market Analysis, Insights and Forecast - by Application
- 11. Asia Pacific Household Activated Carbon Analysis, Insights and Forecast, 2020-2032
- 11.1. Market Analysis, Insights and Forecast - by Application
- 11.1.1. Online
- 11.1.2. Offline
- 11.2. Market Analysis, Insights and Forecast - by Types
- 11.2.1. Coal-Based Activated Carbon
- 11.2.2. Wood-Based Activated Carbon
- 11.2.3. Coconut-Based Activated Carbon
- 11.1. Market Analysis, Insights and Forecast - by Application
- 12. Competitive Analysis
- 12.1. Company Profiles
- 12.1.1 Fujian Xinsen Carbon
- 12.1.1.1. Company Overview
- 12.1.1.2. Products
- 12.1.1.3. Company Financials
- 12.1.1.4. SWOT Analysis
- 12.1.2 MuLinSen Activated Carbon
- 12.1.2.1. Company Overview
- 12.1.2.2. Products
- 12.1.2.3. Company Financials
- 12.1.2.4. SWOT Analysis
- 12.1.3 Shanxi Xinhua Chemical
- 12.1.3.1. Company Overview
- 12.1.3.2. Products
- 12.1.3.3. Company Financials
- 12.1.3.4. SWOT Analysis
- 12.1.4 Boyce Carbon
- 12.1.4.1. Company Overview
- 12.1.4.2. Products
- 12.1.4.3. Company Financials
- 12.1.4.4. SWOT Analysis
- 12.1.5 DESOTEC Activated Carbon
- 12.1.5.1. Company Overview
- 12.1.5.2. Products
- 12.1.5.3. Company Financials
- 12.1.5.4. SWOT Analysis
- 12.1.6 Ningxia Huahui Activated Carbon
- 12.1.6.1. Company Overview
- 12.1.6.2. Products
- 12.1.6.3. Company Financials
- 12.1.6.4. SWOT Analysis
- 12.1.7 Fujian Zhixing
- 12.1.7.1. Company Overview
- 12.1.7.2. Products
- 12.1.7.3. Company Financials
- 12.1.7.4. SWOT Analysis
- 12.1.8 Silcarbon Aktivkohle GmbH
- 12.1.8.1. Company Overview
- 12.1.8.2. Products
- 12.1.8.3. Company Financials
- 12.1.8.4. SWOT Analysis
- 12.1.9 Active Char Products
- 12.1.9.1. Company Overview
- 12.1.9.2. Products
- 12.1.9.3. Company Financials
- 12.1.9.4. SWOT Analysis
- 12.1.10 CarboTech AC GmbH
- 12.1.10.1. Company Overview
- 12.1.10.2. Products
- 12.1.10.3. Company Financials
- 12.1.10.4. SWOT Analysis
- 12.1.11 Donau Carbon
- 12.1.11.1. Company Overview
- 12.1.11.2. Products
- 12.1.11.3. Company Financials
- 12.1.11.4. SWOT Analysis
- 12.1.1 Fujian Xinsen Carbon
- 12.2. Market Entropy
- 12.2.1 Company's Key Areas Served
- 12.2.2 Recent Developments
- 12.3. Company Market Share Analysis 2025
- 12.3.1 Top 5 Companies Market Share Analysis
- 12.3.2 Top 3 Companies Market Share Analysis
- 12.4. List of Potential Customers
- 13. Research Methodology
List of Figures
- Figure 1: Global Household Activated Carbon Revenue Breakdown (million, %) by Region 2025 & 2033
- Figure 2: Global Household Activated Carbon Volume Breakdown (K, %) by Region 2025 & 2033
- Figure 3: North America Household Activated Carbon Revenue (million), by Application 2025 & 2033
- Figure 4: North America Household Activated Carbon Volume (K), by Application 2025 & 2033
- Figure 5: North America Household Activated Carbon Revenue Share (%), by Application 2025 & 2033
- Figure 6: North America Household Activated Carbon Volume Share (%), by Application 2025 & 2033
- Figure 7: North America Household Activated Carbon Revenue (million), by Types 2025 & 2033
- Figure 8: North America Household Activated Carbon Volume (K), by Types 2025 & 2033
- Figure 9: North America Household Activated Carbon Revenue Share (%), by Types 2025 & 2033
- Figure 10: North America Household Activated Carbon Volume Share (%), by Types 2025 & 2033
- Figure 11: North America Household Activated Carbon Revenue (million), by Country 2025 & 2033
- Figure 12: North America Household Activated Carbon Volume (K), by Country 2025 & 2033
- Figure 13: North America Household Activated Carbon Revenue Share (%), by Country 2025 & 2033
- Figure 14: North America Household Activated Carbon Volume Share (%), by Country 2025 & 2033
- Figure 15: South America Household Activated Carbon Revenue (million), by Application 2025 & 2033
- Figure 16: South America Household Activated Carbon Volume (K), by Application 2025 & 2033
- Figure 17: South America Household Activated Carbon Revenue Share (%), by Application 2025 & 2033
- Figure 18: South America Household Activated Carbon Volume Share (%), by Application 2025 & 2033
- Figure 19: South America Household Activated Carbon Revenue (million), by Types 2025 & 2033
- Figure 20: South America Household Activated Carbon Volume (K), by Types 2025 & 2033
- Figure 21: South America Household Activated Carbon Revenue Share (%), by Types 2025 & 2033
- Figure 22: South America Household Activated Carbon Volume Share (%), by Types 2025 & 2033
- Figure 23: South America Household Activated Carbon Revenue (million), by Country 2025 & 2033
- Figure 24: South America Household Activated Carbon Volume (K), by Country 2025 & 2033
- Figure 25: South America Household Activated Carbon Revenue Share (%), by Country 2025 & 2033
- Figure 26: South America Household Activated Carbon Volume Share (%), by Country 2025 & 2033
- Figure 27: Europe Household Activated Carbon Revenue (million), by Application 2025 & 2033
- Figure 28: Europe Household Activated Carbon Volume (K), by Application 2025 & 2033
- Figure 29: Europe Household Activated Carbon Revenue Share (%), by Application 2025 & 2033
- Figure 30: Europe Household Activated Carbon Volume Share (%), by Application 2025 & 2033
- Figure 31: Europe Household Activated Carbon Revenue (million), by Types 2025 & 2033
- Figure 32: Europe Household Activated Carbon Volume (K), by Types 2025 & 2033
- Figure 33: Europe Household Activated Carbon Revenue Share (%), by Types 2025 & 2033
- Figure 34: Europe Household Activated Carbon Volume Share (%), by Types 2025 & 2033
- Figure 35: Europe Household Activated Carbon Revenue (million), by Country 2025 & 2033
- Figure 36: Europe Household Activated Carbon Volume (K), by Country 2025 & 2033
- Figure 37: Europe Household Activated Carbon Revenue Share (%), by Country 2025 & 2033
- Figure 38: Europe Household Activated Carbon Volume Share (%), by Country 2025 & 2033
- Figure 39: Middle East & Africa Household Activated Carbon Revenue (million), by Application 2025 & 2033
- Figure 40: Middle East & Africa Household Activated Carbon Volume (K), by Application 2025 & 2033
- Figure 41: Middle East & Africa Household Activated Carbon Revenue Share (%), by Application 2025 & 2033
- Figure 42: Middle East & Africa Household Activated Carbon Volume Share (%), by Application 2025 & 2033
- Figure 43: Middle East & Africa Household Activated Carbon Revenue (million), by Types 2025 & 2033
- Figure 44: Middle East & Africa Household Activated Carbon Volume (K), by Types 2025 & 2033
- Figure 45: Middle East & Africa Household Activated Carbon Revenue Share (%), by Types 2025 & 2033
- Figure 46: Middle East & Africa Household Activated Carbon Volume Share (%), by Types 2025 & 2033
- Figure 47: Middle East & Africa Household Activated Carbon Revenue (million), by Country 2025 & 2033
- Figure 48: Middle East & Africa Household Activated Carbon Volume (K), by Country 2025 & 2033
- Figure 49: Middle East & Africa Household Activated Carbon Revenue Share (%), by Country 2025 & 2033
- Figure 50: Middle East & Africa Household Activated Carbon Volume Share (%), by Country 2025 & 2033
- Figure 51: Asia Pacific Household Activated Carbon Revenue (million), by Application 2025 & 2033
- Figure 52: Asia Pacific Household Activated Carbon Volume (K), by Application 2025 & 2033
- Figure 53: Asia Pacific Household Activated Carbon Revenue Share (%), by Application 2025 & 2033
- Figure 54: Asia Pacific Household Activated Carbon Volume Share (%), by Application 2025 & 2033
- Figure 55: Asia Pacific Household Activated Carbon Revenue (million), by Types 2025 & 2033
- Figure 56: Asia Pacific Household Activated Carbon Volume (K), by Types 2025 & 2033
- Figure 57: Asia Pacific Household Activated Carbon Revenue Share (%), by Types 2025 & 2033
- Figure 58: Asia Pacific Household Activated Carbon Volume Share (%), by Types 2025 & 2033
- Figure 59: Asia Pacific Household Activated Carbon Revenue (million), by Country 2025 & 2033
- Figure 60: Asia Pacific Household Activated Carbon Volume (K), by Country 2025 & 2033
- Figure 61: Asia Pacific Household Activated Carbon Revenue Share (%), by Country 2025 & 2033
- Figure 62: Asia Pacific Household Activated Carbon Volume Share (%), by Country 2025 & 2033
List of Tables
- Table 1: Global Household Activated Carbon Revenue million Forecast, by Application 2020 & 2033
- Table 2: Global Household Activated Carbon Volume K Forecast, by Application 2020 & 2033
- Table 3: Global Household Activated Carbon Revenue million Forecast, by Types 2020 & 2033
- Table 4: Global Household Activated Carbon Volume K Forecast, by Types 2020 & 2033
- Table 5: Global Household Activated Carbon Revenue million Forecast, by Region 2020 & 2033
- Table 6: Global Household Activated Carbon Volume K Forecast, by Region 2020 & 2033
- Table 7: Global Household Activated Carbon Revenue million Forecast, by Application 2020 & 2033
- Table 8: Global Household Activated Carbon Volume K Forecast, by Application 2020 & 2033
- Table 9: Global Household Activated Carbon Revenue million Forecast, by Types 2020 & 2033
- Table 10: Global Household Activated Carbon Volume K Forecast, by Types 2020 & 2033
- Table 11: Global Household Activated Carbon Revenue million Forecast, by Country 2020 & 2033
- Table 12: Global Household Activated Carbon Volume K Forecast, by Country 2020 & 2033
- Table 13: United States Household Activated Carbon Revenue (million) Forecast, by Application 2020 & 2033
- Table 14: United States Household Activated Carbon Volume (K) Forecast, by Application 2020 & 2033
- Table 15: Canada Household Activated Carbon Revenue (million) Forecast, by Application 2020 & 2033
- Table 16: Canada Household Activated Carbon Volume (K) Forecast, by Application 2020 & 2033
- Table 17: Mexico Household Activated Carbon Revenue (million) Forecast, by Application 2020 & 2033
- Table 18: Mexico Household Activated Carbon Volume (K) Forecast, by Application 2020 & 2033
- Table 19: Global Household Activated Carbon Revenue million Forecast, by Application 2020 & 2033
- Table 20: Global Household Activated Carbon Volume K Forecast, by Application 2020 & 2033
- Table 21: Global Household Activated Carbon Revenue million Forecast, by Types 2020 & 2033
- Table 22: Global Household Activated Carbon Volume K Forecast, by Types 2020 & 2033
- Table 23: Global Household Activated Carbon Revenue million Forecast, by Country 2020 & 2033
- Table 24: Global Household Activated Carbon Volume K Forecast, by Country 2020 & 2033
- Table 25: Brazil Household Activated Carbon Revenue (million) Forecast, by Application 2020 & 2033
- Table 26: Brazil Household Activated Carbon Volume (K) Forecast, by Application 2020 & 2033
- Table 27: Argentina Household Activated Carbon Revenue (million) Forecast, by Application 2020 & 2033
- Table 28: Argentina Household Activated Carbon Volume (K) Forecast, by Application 2020 & 2033
- Table 29: Rest of South America Household Activated Carbon Revenue (million) Forecast, by Application 2020 & 2033
- Table 30: Rest of South America Household Activated Carbon Volume (K) Forecast, by Application 2020 & 2033
- Table 31: Global Household Activated Carbon Revenue million Forecast, by Application 2020 & 2033
- Table 32: Global Household Activated Carbon Volume K Forecast, by Application 2020 & 2033
- Table 33: Global Household Activated Carbon Revenue million Forecast, by Types 2020 & 2033
- Table 34: Global Household Activated Carbon Volume K Forecast, by Types 2020 & 2033
- Table 35: Global Household Activated Carbon Revenue million Forecast, by Country 2020 & 2033
- Table 36: Global Household Activated Carbon Volume K Forecast, by Country 2020 & 2033
- Table 37: United Kingdom Household Activated Carbon Revenue (million) Forecast, by Application 2020 & 2033
- Table 38: United Kingdom Household Activated Carbon Volume (K) Forecast, by Application 2020 & 2033
- Table 39: Germany Household Activated Carbon Revenue (million) Forecast, by Application 2020 & 2033
- Table 40: Germany Household Activated Carbon Volume (K) Forecast, by Application 2020 & 2033
- Table 41: France Household Activated Carbon Revenue (million) Forecast, by Application 2020 & 2033
- Table 42: France Household Activated Carbon Volume (K) Forecast, by Application 2020 & 2033
- Table 43: Italy Household Activated Carbon Revenue (million) Forecast, by Application 2020 & 2033
- Table 44: Italy Household Activated Carbon Volume (K) Forecast, by Application 2020 & 2033
- Table 45: Spain Household Activated Carbon Revenue (million) Forecast, by Application 2020 & 2033
- Table 46: Spain Household Activated Carbon Volume (K) Forecast, by Application 2020 & 2033
- Table 47: Russia Household Activated Carbon Revenue (million) Forecast, by Application 2020 & 2033
- Table 48: Russia Household Activated Carbon Volume (K) Forecast, by Application 2020 & 2033
- Table 49: Benelux Household Activated Carbon Revenue (million) Forecast, by Application 2020 & 2033
- Table 50: Benelux Household Activated Carbon Volume (K) Forecast, by Application 2020 & 2033
- Table 51: Nordics Household Activated Carbon Revenue (million) Forecast, by Application 2020 & 2033
- Table 52: Nordics Household Activated Carbon Volume (K) Forecast, by Application 2020 & 2033
- Table 53: Rest of Europe Household Activated Carbon Revenue (million) Forecast, by Application 2020 & 2033
- Table 54: Rest of Europe Household Activated Carbon Volume (K) Forecast, by Application 2020 & 2033
- Table 55: Global Household Activated Carbon Revenue million Forecast, by Application 2020 & 2033
- Table 56: Global Household Activated Carbon Volume K Forecast, by Application 2020 & 2033
- Table 57: Global Household Activated Carbon Revenue million Forecast, by Types 2020 & 2033
- Table 58: Global Household Activated Carbon Volume K Forecast, by Types 2020 & 2033
- Table 59: Global Household Activated Carbon Revenue million Forecast, by Country 2020 & 2033
- Table 60: Global Household Activated Carbon Volume K Forecast, by Country 2020 & 2033
- Table 61: Turkey Household Activated Carbon Revenue (million) Forecast, by Application 2020 & 2033
- Table 62: Turkey Household Activated Carbon Volume (K) Forecast, by Application 2020 & 2033
- Table 63: Israel Household Activated Carbon Revenue (million) Forecast, by Application 2020 & 2033
- Table 64: Israel Household Activated Carbon Volume (K) Forecast, by Application 2020 & 2033
- Table 65: GCC Household Activated Carbon Revenue (million) Forecast, by Application 2020 & 2033
- Table 66: GCC Household Activated Carbon Volume (K) Forecast, by Application 2020 & 2033
- Table 67: North Africa Household Activated Carbon Revenue (million) Forecast, by Application 2020 & 2033
- Table 68: North Africa Household Activated Carbon Volume (K) Forecast, by Application 2020 & 2033
- Table 69: South Africa Household Activated Carbon Revenue (million) Forecast, by Application 2020 & 2033
- Table 70: South Africa Household Activated Carbon Volume (K) Forecast, by Application 2020 & 2033
- Table 71: Rest of Middle East & Africa Household Activated Carbon Revenue (million) Forecast, by Application 2020 & 2033
- Table 72: Rest of Middle East & Africa Household Activated Carbon Volume (K) Forecast, by Application 2020 & 2033
- Table 73: Global Household Activated Carbon Revenue million Forecast, by Application 2020 & 2033
- Table 74: Global Household Activated Carbon Volume K Forecast, by Application 2020 & 2033
- Table 75: Global Household Activated Carbon Revenue million Forecast, by Types 2020 & 2033
- Table 76: Global Household Activated Carbon Volume K Forecast, by Types 2020 & 2033
- Table 77: Global Household Activated Carbon Revenue million Forecast, by Country 2020 & 2033
- Table 78: Global Household Activated Carbon Volume K Forecast, by Country 2020 & 2033
- Table 79: China Household Activated Carbon Revenue (million) Forecast, by Application 2020 & 2033
- Table 80: China Household Activated Carbon Volume (K) Forecast, by Application 2020 & 2033
- Table 81: India Household Activated Carbon Revenue (million) Forecast, by Application 2020 & 2033
- Table 82: India Household Activated Carbon Volume (K) Forecast, by Application 2020 & 2033
- Table 83: Japan Household Activated Carbon Revenue (million) Forecast, by Application 2020 & 2033
- Table 84: Japan Household Activated Carbon Volume (K) Forecast, by Application 2020 & 2033
- Table 85: South Korea Household Activated Carbon Revenue (million) Forecast, by Application 2020 & 2033
- Table 86: South Korea Household Activated Carbon Volume (K) Forecast, by Application 2020 & 2033
- Table 87: ASEAN Household Activated Carbon Revenue (million) Forecast, by Application 2020 & 2033
- Table 88: ASEAN Household Activated Carbon Volume (K) Forecast, by Application 2020 & 2033
- Table 89: Oceania Household Activated Carbon Revenue (million) Forecast, by Application 2020 & 2033
- Table 90: Oceania Household Activated Carbon Volume (K) Forecast, by Application 2020 & 2033
- Table 91: Rest of Asia Pacific Household Activated Carbon Revenue (million) Forecast, by Application 2020 & 2033
- Table 92: Rest of Asia Pacific Household Activated Carbon Volume (K) Forecast, by Application 2020 & 2033
Frequently Asked Questions
1. What is the projected Compound Annual Growth Rate (CAGR) of the Household Activated Carbon?
The projected CAGR is approximately 5.1%.
2. Which companies are prominent players in the Household Activated Carbon?
Key companies in the market include Fujian Xinsen Carbon, MuLinSen Activated Carbon, Shanxi Xinhua Chemical, Boyce Carbon, DESOTEC Activated Carbon, Ningxia Huahui Activated Carbon, Fujian Zhixing, Silcarbon Aktivkohle GmbH, Active Char Products, CarboTech AC GmbH, Donau Carbon.
3. What are the main segments of the Household Activated Carbon?
The market segments include Application, Types.
4. Can you provide details about the market size?
The market size is estimated to be USD 823 million as of 2022.
5. What are some drivers contributing to market growth?
N/A
6. What are the notable trends driving market growth?
N/A
7. Are there any restraints impacting market growth?
N/A
8. Can you provide examples of recent developments in the market?
N/A
9. What pricing options are available for accessing the report?
Pricing options include single-user, multi-user, and enterprise licenses priced at USD 3950.00, USD 5925.00, and USD 7900.00 respectively.
10. Is the market size provided in terms of value or volume?
The market size is provided in terms of value, measured in million and volume, measured in K.
11. Are there any specific market keywords associated with the report?
Yes, the market keyword associated with the report is "Household Activated Carbon," which aids in identifying and referencing the specific market segment covered.
12. How do I determine which pricing option suits my needs best?
The pricing options vary based on user requirements and access needs. Individual users may opt for single-user licenses, while businesses requiring broader access may choose multi-user or enterprise licenses for cost-effective access to the report.
13. Are there any additional resources or data provided in the Household Activated Carbon report?
While the report offers comprehensive insights, it's advisable to review the specific contents or supplementary materials provided to ascertain if additional resources or data are available.
14. How can I stay updated on further developments or reports in the Household Activated Carbon?
To stay informed about further developments, trends, and reports in the Household Activated Carbon, consider subscribing to industry newsletters, following relevant companies and organizations, or regularly checking reputable industry news sources and publications.
Methodology
Step 1 - Identification of Relevant Samples Size from Population Database


Step 2 - Approaches for Defining Global Market Size (Value, Volume* & Price*)

Note*: In applicable scenarios
Step 3 - Data Sources
Primary Research
- Web Analytics
- Survey Reports
- Research Institute
- Latest Research Reports
- Opinion Leaders
Secondary Research
- Annual Reports
- White Paper
- Latest Press Release
- Industry Association
- Paid Database
- Investor Presentations

Step 4 - Data Triangulation
Involves using different sources of information in order to increase the validity of a study
These sources are likely to be stakeholders in a program - participants, other researchers, program staff, other community members, and so on.
Then we put all data in single framework & apply various statistical tools to find out the dynamic on the market.
During the analysis stage, feedback from the stakeholder groups would be compared to determine areas of agreement as well as areas of divergence