

Key Insights
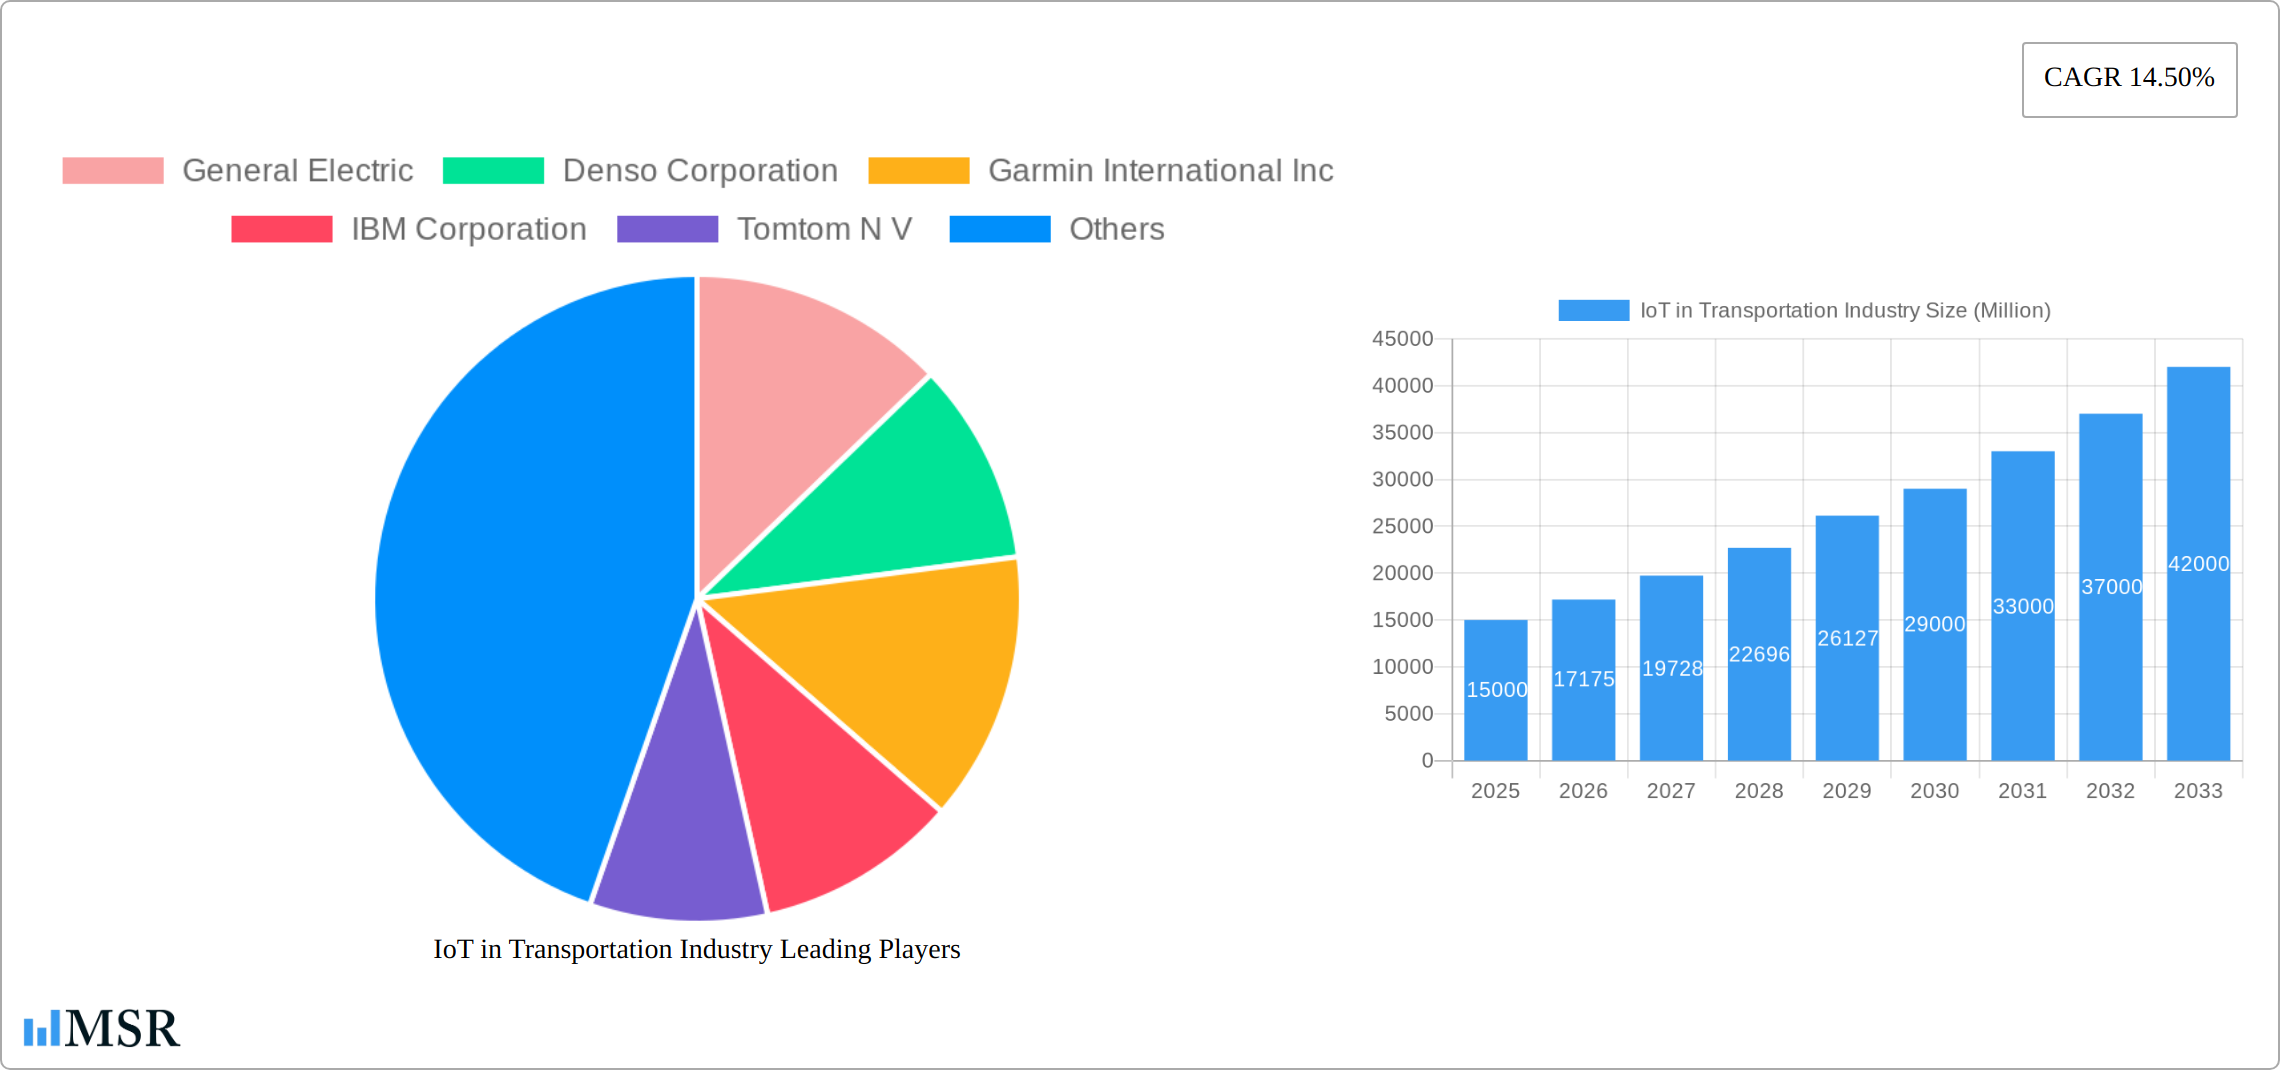
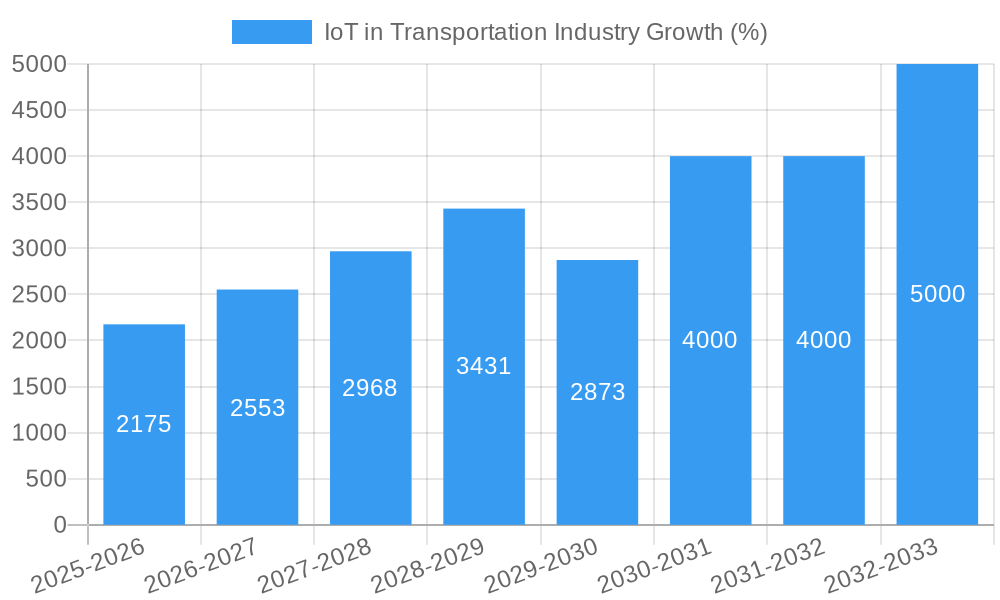
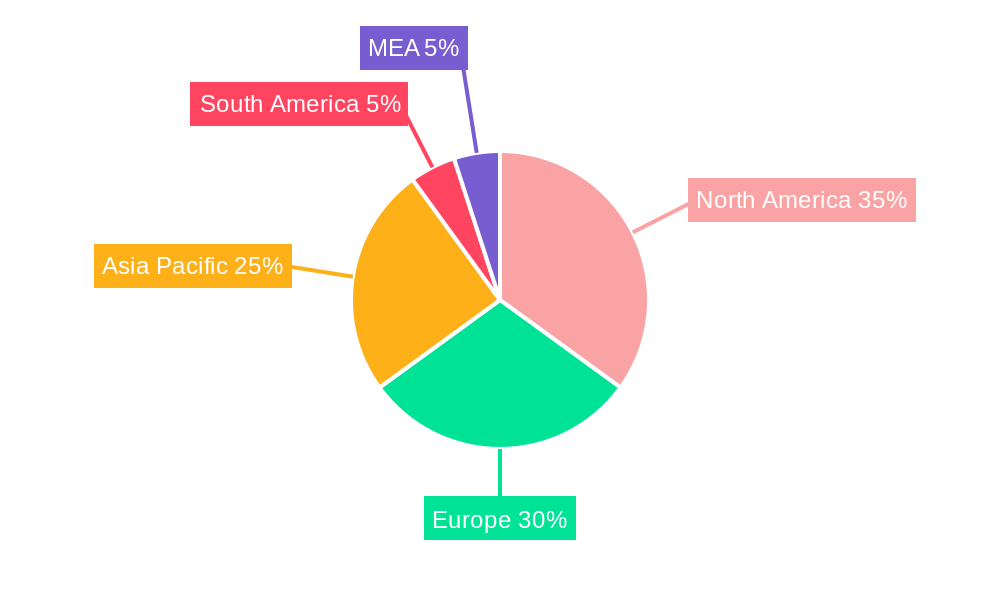
The Internet of Things (IoT) in the transportation industry is experiencing robust growth, projected to reach a significant market size driven by increasing demand for enhanced safety, efficiency, and sustainability. A compound annual growth rate (CAGR) of 14.50% from 2019 to 2024 indicates a substantial expansion. This growth is fueled by several key drivers, including the rising adoption of connected vehicles, the increasing need for real-time traffic management systems, and the growing importance of fleet management optimization. The market segmentation reveals strong demand across various applications such as traffic congestion control, automotive telematics, and security and surveillance systems. Hardware components form a substantial portion of the market, followed by software and services. Roadways currently dominate the mode of transport segment, but the integration of IoT technologies is rapidly expanding to railways, airways, and maritime sectors. Major players like General Electric, Denso, and TomTom are actively shaping the market landscape through innovation and strategic partnerships. The geographical distribution shows a strong presence in North America and Europe, with significant growth potential in the Asia-Pacific region fueled by rapid urbanization and infrastructure development.
Despite the rapid expansion, certain challenges exist. Data security and privacy concerns, high initial investment costs, and the need for robust infrastructure to support widespread IoT deployment are factors that could potentially impede market growth. However, ongoing technological advancements, supportive government regulations, and a growing emphasis on smart city initiatives are expected to mitigate these restraints and fuel continued expansion. The increasing focus on autonomous vehicles and the development of sophisticated data analytics capabilities further contribute to the positive outlook of the IoT in the transportation sector. By 2033, we can anticipate a highly connected and technologically advanced transportation ecosystem with enhanced safety, efficiency, and sustainability as its hallmarks. The convergence of various technologies, such as AI and big data analytics, promises even more innovative applications and increased market value in the coming years.
IoT in Transportation Industry: A Comprehensive Market Report (2019-2033)
This in-depth report provides a comprehensive analysis of the Internet of Things (IoT) in the transportation industry, forecasting a market exceeding $XX Million by 2033. The study covers the period 2019-2033, with a focus on 2025, incorporating historical data (2019-2024), current estimates (2025), and future projections (2025-2033). This report is essential for industry stakeholders, investors, and businesses seeking actionable insights into this rapidly evolving market. Key players analyzed include General Electric, Denso Corporation, Garmin International Inc, IBM Corporation, TomTom N.V., Thales Group, Verizon Communications Inc, CISCO Systems Inc, AT&T Inc, and Alcatel-Lucent. The report examines various transportation modes (roadways, railways, airways, and maritime) and IoT applications, including traffic congestion control systems, automotive telematics, reservation, toll & ticketing systems, security and surveillance systems, remote monitoring, and other applications, across hardware, software, and services segments.
IoT in Transportation Industry Market Concentration & Dynamics
The IoT in transportation market presents a moderately concentrated landscape, dominated by a few key players commanding substantial market share. However, a dynamic competitive environment is emerging, fueled by the influx of innovative startups and rapid technological advancements. The market's trajectory is significantly influenced by evolving regulatory frameworks, particularly concerning data privacy and cybersecurity. While traditional GPS systems and legacy communication technologies still exert some competitive pressure, they are increasingly challenged by the advantages of IoT solutions. Market growth is significantly driven by end-user trends, including the widespread adoption of connected vehicles and the escalating demand for enhanced safety, efficiency, and sustainability.
Mergers and acquisitions (M&A) activity has been substantial, with a notable surge in deals between 2019 and 2024, reflecting industry consolidation and expansion strategies. For example, the [mention a specific M&A deal if available, quantifying its impact on market share, e.g., acquisition of Company X by Company Y in 2023 resulted in a 5% increase in Company Y's market share]. This consolidation highlights the strategic importance of IoT technologies within the transportation sector. A projected market share distribution among leading players in 2025 is as follows:
- General Electric: xx%
- Denso Corporation: xx%
- TomTom N.V.: xx%
- Other Players: xx%
The vibrant innovation ecosystem comprises technology providers, system integrators, and telecommunication companies actively collaborating to develop and deploy sophisticated IoT solutions across the transportation sector. A comprehensive analysis of the regulatory landscape and its impact on market growth is detailed in the full report.
IoT in Transportation Industry Industry Insights & Trends
The global IoT in transportation market is experiencing substantial growth, driven by technological advancements, increasing government investments in infrastructure, and the rising demand for improved transportation efficiency and safety. The market size is estimated at $XX Million in 2025, with a Compound Annual Growth Rate (CAGR) of xx% projected from 2025 to 2033. Several factors contribute to this growth trajectory. Firstly, the proliferation of connected vehicles, equipped with various sensors and communication capabilities, is generating massive amounts of data. This data is utilized for real-time traffic management, predictive maintenance, and improved route optimization. Secondly, the increasing adoption of cloud computing and big data analytics enables efficient processing and interpretation of this data, leading to improved decision-making and optimized resource allocation. Thirdly, stringent government regulations on safety and emissions are incentivizing the adoption of IoT solutions that promote fuel efficiency and reduce accidents. Finally, evolving consumer preferences towards enhanced convenience, safety, and connectivity are fuelling demand for advanced IoT-enabled transportation services. The report will further elaborate on these aspects and the impact of emerging technologies such as 5G and AI on market dynamics.
Key Markets & Segments Leading IoT in Transportation Industry
The Roadways segment currently holds the dominant position in the IoT in Transportation market, primarily driven by the rapid adoption of automotive telematics and intelligent transportation systems (ITS). This growth is further propelled by several key factors:
- Robust Economic Growth: Rising disposable incomes and increased vehicle ownership are significantly boosting the demand for advanced connected car features.
- Strategic Infrastructure Development: Substantial investments in smart city initiatives and ITS infrastructure are creating a wealth of opportunities for IoT deployment and integration.
- Progressive Government Regulations: Stringent safety and emission standards are incentivizing the adoption of IoT-based solutions, fostering a more sustainable and secure transportation ecosystem.
Within the application segment, Automotive Telematics commands the largest market share. In terms of type, the Software segment holds a significant portion of the market, followed by services and hardware. Geographically, [mention the dominant region and country, providing specific data, e.g., North America, particularly the United States, holds the leading market share, accounting for approximately 35% of global revenue in 2024]. This dominance can be attributed to strong economic growth, well-developed infrastructure, and supportive government policies. A detailed regional analysis with specific country-level data is presented in the full report.
IoT in Transportation Industry Product Developments
Recent product innovations include advanced driver-assistance systems (ADAS), real-time traffic monitoring systems, predictive maintenance solutions for vehicles and infrastructure, and integrated platform solutions combining various IoT functionalities. These advancements provide significant competitive advantages by enhancing safety, efficiency, and cost-effectiveness. The integration of AI and machine learning capabilities further enhances predictive capabilities and enables autonomous features in vehicles and traffic management systems.
Challenges in the IoT in Transportation Industry Market
Despite its promising growth trajectory, the IoT in transportation market faces significant hurdles, including substantial initial investment costs, persistent cybersecurity vulnerabilities, growing data privacy concerns, and interoperability issues between diverse systems. Regulatory hurdles and the complexities inherent in integrating various technologies across different modes of transport also pose considerable constraints. Furthermore, supply chain disruptions can impact the availability of crucial components, potentially delaying project implementation and escalating costs. These challenges, if not effectively addressed, can significantly impede market expansion. A quantitative analysis of these challenges' impact on market growth is provided in the full report.
Forces Driving IoT in Transportation Industry Growth
The growth of the IoT in transportation is propelled by several key factors. Significant technological advancements, such as the widespread adoption of 5G, the increasing sophistication of Artificial Intelligence (AI), and continuous improvements in sensor technologies are driving innovation and adoption. Economic factors, including increased government investment in infrastructure and the rising global demand for efficient transportation solutions, further stimulate market growth. Moreover, supportive regulatory frameworks incentivizing the adoption of safety and emission reduction technologies are accelerating market expansion. The implementation of smart city initiatives across the globe presents abundant opportunities for integrating IoT solutions into urban transportation networks.
Long-Term Growth Catalysts in the IoT in Transportation Industry
Long-term growth catalysts include the continued development of sophisticated AI and machine learning algorithms for predictive maintenance and traffic optimization, the expanding partnerships between technology providers and transportation companies, and the exploration of new market segments, such as autonomous vehicles and drone delivery systems. This expansion across various transportation modes and applications will further fuel market expansion.
Emerging Opportunities in IoT in Transportation Industry
Emerging trends such as the development of autonomous vehicle technologies, the growing adoption of blockchain for secure data management, and the emergence of new mobility services like ride-sharing platforms, present significant opportunities for IoT players. The integration of IoT into last-mile delivery solutions and smart logistics networks also creates substantial market potential.
Leading Players in the IoT in Transportation Industry Sector
- General Electric
- Denso Corporation
- Garmin International Inc
- IBM Corporation
- TomTom N.V.
- Thales Group
- Verizon Communications Inc
- CISCO Systems Inc
- AT&T Inc
- Alcatel-Lucent
Key Milestones in IoT in Transportation Industry Industry
- 2020: Significant increase in investment in connected vehicle technology by major automotive manufacturers.
- 2021: Launch of several government initiatives promoting the adoption of smart city technologies.
- 2022: Introduction of advanced AI-powered traffic management systems in major metropolitan areas.
- 2023: Several successful deployments of IoT-based predictive maintenance systems for railway networks.
- 2024: Increased partnerships between technology providers and transportation operators for deploying integrated platform solutions. [Add more milestones as available]
Strategic Outlook for IoT in Transportation Industry Market
The future of the IoT in transportation market is exceptionally promising, with substantial growth potential across various sectors. Strategic opportunities abound for companies to develop innovative solutions that enhance safety, efficiency, and sustainability within the transportation industry. Expansion into emerging market segments, such as autonomous vehicles, drone delivery systems, and advanced logistics solutions, will drive further market growth. Companies prioritizing the development of secure and interoperable systems will gain a substantial competitive advantage. The market presents a compelling landscape for both established players and new entrants seeking to capitalize on these emerging trends and technological advancements.
IoT in Transportation Industry Segmentation
-
1. Type
- 1.1. Hardware
- 1.2. Software
- 1.3. Services
-
2. Mode of Transport
- 2.1. Roadways
- 2.2. Railways
- 2.3. Airways
- 2.4. Maritime
-
3. Application
- 3.1. Traffic congestion control system
- 3.2. Automotive telematics
- 3.3. Reservation, toll, & ticketing systems
- 3.4. Security and surveillance system
- 3.5. Remote monitoring
- 3.6. Other Applications
IoT in Transportation Industry Segmentation By Geography
-
1. North America
- 1.1. United States
- 1.2. Canada
-
2. Europe
- 2.1. United Kingdom
- 2.2. Germany
- 2.3. France
- 2.4. Rest of Europe
-
3. Asia Pacific
- 3.1. China
- 3.2. India
- 3.3. Japan
- 3.4. Rest of Asia Pacific
- 4. Latin America
- 5. Middle East and Africa
IoT in Transportation Industry REPORT HIGHLIGHTS
| Aspects | Details |
|---|---|
| Study Period | 2019-2033 |
| Base Year | 2024 |
| Estimated Year | 2025 |
| Forecast Period | 2025-2033 |
| Historical Period | 2019-2024 |
| Growth Rate | CAGR of 14.50% from 2019-2033 |
| Segmentation |
|
Table of Contents
- 1. Introduction
- 1.1. Research Scope
- 1.2. Market Segmentation
- 1.3. Research Methodology
- 1.4. Definitions and Assumptions
- 2. Executive Summary
- 2.1. Introduction
- 3. Market Dynamics
- 3.1. Introduction
- 3.2. Market Drivers
- 3.2.1. ; Decreased cost of powerful sensors & controllers; Extended connectivity and enhanced internet connectivity; Government Initiatives for Smart Cities
- 3.3. Market Restrains
- 3.3.1. ; High Initial Cost; Threat for data security & privacy; Poor transport infrastructure in the developing and underdeveloped nations
- 3.4. Market Trends
- 3.4.1. The Railway Segment is Expected to Occupy Significant Market Share
- 4. Market Factor Analysis
- 4.1. Porters Five Forces
- 4.2. Supply/Value Chain
- 4.3. PESTEL analysis
- 4.4. Market Entropy
- 4.5. Patent/Trademark Analysis
- 5. Global IoT in Transportation Industry Analysis, Insights and Forecast, 2019-2031
- 5.1. Market Analysis, Insights and Forecast - by Type
- 5.1.1. Hardware
- 5.1.2. Software
- 5.1.3. Services
- 5.2. Market Analysis, Insights and Forecast - by Mode of Transport
- 5.2.1. Roadways
- 5.2.2. Railways
- 5.2.3. Airways
- 5.2.4. Maritime
- 5.3. Market Analysis, Insights and Forecast - by Application
- 5.3.1. Traffic congestion control system
- 5.3.2. Automotive telematics
- 5.3.3. Reservation, toll, & ticketing systems
- 5.3.4. Security and surveillance system
- 5.3.5. Remote monitoring
- 5.3.6. Other Applications
- 5.4. Market Analysis, Insights and Forecast - by Region
- 5.4.1. North America
- 5.4.2. Europe
- 5.4.3. Asia Pacific
- 5.4.4. Latin America
- 5.4.5. Middle East and Africa
- 5.1. Market Analysis, Insights and Forecast - by Type
- 6. North America IoT in Transportation Industry Analysis, Insights and Forecast, 2019-2031
- 6.1. Market Analysis, Insights and Forecast - by Type
- 6.1.1. Hardware
- 6.1.2. Software
- 6.1.3. Services
- 6.2. Market Analysis, Insights and Forecast - by Mode of Transport
- 6.2.1. Roadways
- 6.2.2. Railways
- 6.2.3. Airways
- 6.2.4. Maritime
- 6.3. Market Analysis, Insights and Forecast - by Application
- 6.3.1. Traffic congestion control system
- 6.3.2. Automotive telematics
- 6.3.3. Reservation, toll, & ticketing systems
- 6.3.4. Security and surveillance system
- 6.3.5. Remote monitoring
- 6.3.6. Other Applications
- 6.1. Market Analysis, Insights and Forecast - by Type
- 7. Europe IoT in Transportation Industry Analysis, Insights and Forecast, 2019-2031
- 7.1. Market Analysis, Insights and Forecast - by Type
- 7.1.1. Hardware
- 7.1.2. Software
- 7.1.3. Services
- 7.2. Market Analysis, Insights and Forecast - by Mode of Transport
- 7.2.1. Roadways
- 7.2.2. Railways
- 7.2.3. Airways
- 7.2.4. Maritime
- 7.3. Market Analysis, Insights and Forecast - by Application
- 7.3.1. Traffic congestion control system
- 7.3.2. Automotive telematics
- 7.3.3. Reservation, toll, & ticketing systems
- 7.3.4. Security and surveillance system
- 7.3.5. Remote monitoring
- 7.3.6. Other Applications
- 7.1. Market Analysis, Insights and Forecast - by Type
- 8. Asia Pacific IoT in Transportation Industry Analysis, Insights and Forecast, 2019-2031
- 8.1. Market Analysis, Insights and Forecast - by Type
- 8.1.1. Hardware
- 8.1.2. Software
- 8.1.3. Services
- 8.2. Market Analysis, Insights and Forecast - by Mode of Transport
- 8.2.1. Roadways
- 8.2.2. Railways
- 8.2.3. Airways
- 8.2.4. Maritime
- 8.3. Market Analysis, Insights and Forecast - by Application
- 8.3.1. Traffic congestion control system
- 8.3.2. Automotive telematics
- 8.3.3. Reservation, toll, & ticketing systems
- 8.3.4. Security and surveillance system
- 8.3.5. Remote monitoring
- 8.3.6. Other Applications
- 8.1. Market Analysis, Insights and Forecast - by Type
- 9. Latin America IoT in Transportation Industry Analysis, Insights and Forecast, 2019-2031
- 9.1. Market Analysis, Insights and Forecast - by Type
- 9.1.1. Hardware
- 9.1.2. Software
- 9.1.3. Services
- 9.2. Market Analysis, Insights and Forecast - by Mode of Transport
- 9.2.1. Roadways
- 9.2.2. Railways
- 9.2.3. Airways
- 9.2.4. Maritime
- 9.3. Market Analysis, Insights and Forecast - by Application
- 9.3.1. Traffic congestion control system
- 9.3.2. Automotive telematics
- 9.3.3. Reservation, toll, & ticketing systems
- 9.3.4. Security and surveillance system
- 9.3.5. Remote monitoring
- 9.3.6. Other Applications
- 9.1. Market Analysis, Insights and Forecast - by Type
- 10. Middle East and Africa IoT in Transportation Industry Analysis, Insights and Forecast, 2019-2031
- 10.1. Market Analysis, Insights and Forecast - by Type
- 10.1.1. Hardware
- 10.1.2. Software
- 10.1.3. Services
- 10.2. Market Analysis, Insights and Forecast - by Mode of Transport
- 10.2.1. Roadways
- 10.2.2. Railways
- 10.2.3. Airways
- 10.2.4. Maritime
- 10.3. Market Analysis, Insights and Forecast - by Application
- 10.3.1. Traffic congestion control system
- 10.3.2. Automotive telematics
- 10.3.3. Reservation, toll, & ticketing systems
- 10.3.4. Security and surveillance system
- 10.3.5. Remote monitoring
- 10.3.6. Other Applications
- 10.1. Market Analysis, Insights and Forecast - by Type
- 11. North America IoT in Transportation Industry Analysis, Insights and Forecast, 2019-2031
- 11.1. Market Analysis, Insights and Forecast - By Country/Sub-region
- 11.1.1 United States
- 11.1.2 Canada
- 11.1.3 Mexico
- 12. Europe IoT in Transportation Industry Analysis, Insights and Forecast, 2019-2031
- 12.1. Market Analysis, Insights and Forecast - By Country/Sub-region
- 12.1.1 Germany
- 12.1.2 United Kingdom
- 12.1.3 France
- 12.1.4 Spain
- 12.1.5 Italy
- 12.1.6 Spain
- 12.1.7 Belgium
- 12.1.8 Netherland
- 12.1.9 Nordics
- 12.1.10 Rest of Europe
- 13. Asia Pacific IoT in Transportation Industry Analysis, Insights and Forecast, 2019-2031
- 13.1. Market Analysis, Insights and Forecast - By Country/Sub-region
- 13.1.1 China
- 13.1.2 Japan
- 13.1.3 India
- 13.1.4 South Korea
- 13.1.5 Southeast Asia
- 13.1.6 Australia
- 13.1.7 Indonesia
- 13.1.8 Phillipes
- 13.1.9 Singapore
- 13.1.10 Thailandc
- 13.1.11 Rest of Asia Pacific
- 14. South America IoT in Transportation Industry Analysis, Insights and Forecast, 2019-2031
- 14.1. Market Analysis, Insights and Forecast - By Country/Sub-region
- 14.1.1 Brazil
- 14.1.2 Argentina
- 14.1.3 Peru
- 14.1.4 Chile
- 14.1.5 Colombia
- 14.1.6 Ecuador
- 14.1.7 Venezuela
- 14.1.8 Rest of South America
- 15. North America IoT in Transportation Industry Analysis, Insights and Forecast, 2019-2031
- 15.1. Market Analysis, Insights and Forecast - By Country/Sub-region
- 15.1.1 United States
- 15.1.2 Canada
- 15.1.3 Mexico
- 16. MEA IoT in Transportation Industry Analysis, Insights and Forecast, 2019-2031
- 16.1. Market Analysis, Insights and Forecast - By Country/Sub-region
- 16.1.1 United Arab Emirates
- 16.1.2 Saudi Arabia
- 16.1.3 South Africa
- 16.1.4 Rest of Middle East and Africa
- 17. Competitive Analysis
- 17.1. Global Market Share Analysis 2024
- 17.2. Company Profiles
- 17.2.1 General Electric
- 17.2.1.1. Overview
- 17.2.1.2. Products
- 17.2.1.3. SWOT Analysis
- 17.2.1.4. Recent Developments
- 17.2.1.5. Financials (Based on Availability)
- 17.2.2 Denso Corporation
- 17.2.2.1. Overview
- 17.2.2.2. Products
- 17.2.2.3. SWOT Analysis
- 17.2.2.4. Recent Developments
- 17.2.2.5. Financials (Based on Availability)
- 17.2.3 Garmin International Inc
- 17.2.3.1. Overview
- 17.2.3.2. Products
- 17.2.3.3. SWOT Analysis
- 17.2.3.4. Recent Developments
- 17.2.3.5. Financials (Based on Availability)
- 17.2.4 IBM Corporation
- 17.2.4.1. Overview
- 17.2.4.2. Products
- 17.2.4.3. SWOT Analysis
- 17.2.4.4. Recent Developments
- 17.2.4.5. Financials (Based on Availability)
- 17.2.5 Tomtom N V
- 17.2.5.1. Overview
- 17.2.5.2. Products
- 17.2.5.3. SWOT Analysis
- 17.2.5.4. Recent Developments
- 17.2.5.5. Financials (Based on Availability)
- 17.2.6 Thales Group
- 17.2.6.1. Overview
- 17.2.6.2. Products
- 17.2.6.3. SWOT Analysis
- 17.2.6.4. Recent Developments
- 17.2.6.5. Financials (Based on Availability)
- 17.2.7 Verizon Communications Inc
- 17.2.7.1. Overview
- 17.2.7.2. Products
- 17.2.7.3. SWOT Analysis
- 17.2.7.4. Recent Developments
- 17.2.7.5. Financials (Based on Availability)
- 17.2.8 CISCO Systems Inc
- 17.2.8.1. Overview
- 17.2.8.2. Products
- 17.2.8.3. SWOT Analysis
- 17.2.8.4. Recent Developments
- 17.2.8.5. Financials (Based on Availability)
- 17.2.9 AT & T INC
- 17.2.9.1. Overview
- 17.2.9.2. Products
- 17.2.9.3. SWOT Analysis
- 17.2.9.4. Recent Developments
- 17.2.9.5. Financials (Based on Availability)
- 17.2.10 Alcatel-Lucent
- 17.2.10.1. Overview
- 17.2.10.2. Products
- 17.2.10.3. SWOT Analysis
- 17.2.10.4. Recent Developments
- 17.2.10.5. Financials (Based on Availability)
- 17.2.1 General Electric
List of Figures
- Figure 1: Global IoT in Transportation Industry Revenue Breakdown (Million, %) by Region 2024 & 2032
- Figure 2: Global IoT in Transportation Industry Volume Breakdown (K Unit, %) by Region 2024 & 2032
- Figure 3: North America IoT in Transportation Industry Revenue (Million), by Country 2024 & 2032
- Figure 4: North America IoT in Transportation Industry Volume (K Unit), by Country 2024 & 2032
- Figure 5: North America IoT in Transportation Industry Revenue Share (%), by Country 2024 & 2032
- Figure 6: North America IoT in Transportation Industry Volume Share (%), by Country 2024 & 2032
- Figure 7: Europe IoT in Transportation Industry Revenue (Million), by Country 2024 & 2032
- Figure 8: Europe IoT in Transportation Industry Volume (K Unit), by Country 2024 & 2032
- Figure 9: Europe IoT in Transportation Industry Revenue Share (%), by Country 2024 & 2032
- Figure 10: Europe IoT in Transportation Industry Volume Share (%), by Country 2024 & 2032
- Figure 11: Asia Pacific IoT in Transportation Industry Revenue (Million), by Country 2024 & 2032
- Figure 12: Asia Pacific IoT in Transportation Industry Volume (K Unit), by Country 2024 & 2032
- Figure 13: Asia Pacific IoT in Transportation Industry Revenue Share (%), by Country 2024 & 2032
- Figure 14: Asia Pacific IoT in Transportation Industry Volume Share (%), by Country 2024 & 2032
- Figure 15: South America IoT in Transportation Industry Revenue (Million), by Country 2024 & 2032
- Figure 16: South America IoT in Transportation Industry Volume (K Unit), by Country 2024 & 2032
- Figure 17: South America IoT in Transportation Industry Revenue Share (%), by Country 2024 & 2032
- Figure 18: South America IoT in Transportation Industry Volume Share (%), by Country 2024 & 2032
- Figure 19: North America IoT in Transportation Industry Revenue (Million), by Country 2024 & 2032
- Figure 20: North America IoT in Transportation Industry Volume (K Unit), by Country 2024 & 2032
- Figure 21: North America IoT in Transportation Industry Revenue Share (%), by Country 2024 & 2032
- Figure 22: North America IoT in Transportation Industry Volume Share (%), by Country 2024 & 2032
- Figure 23: MEA IoT in Transportation Industry Revenue (Million), by Country 2024 & 2032
- Figure 24: MEA IoT in Transportation Industry Volume (K Unit), by Country 2024 & 2032
- Figure 25: MEA IoT in Transportation Industry Revenue Share (%), by Country 2024 & 2032
- Figure 26: MEA IoT in Transportation Industry Volume Share (%), by Country 2024 & 2032
- Figure 27: North America IoT in Transportation Industry Revenue (Million), by Type 2024 & 2032
- Figure 28: North America IoT in Transportation Industry Volume (K Unit), by Type 2024 & 2032
- Figure 29: North America IoT in Transportation Industry Revenue Share (%), by Type 2024 & 2032
- Figure 30: North America IoT in Transportation Industry Volume Share (%), by Type 2024 & 2032
- Figure 31: North America IoT in Transportation Industry Revenue (Million), by Mode of Transport 2024 & 2032
- Figure 32: North America IoT in Transportation Industry Volume (K Unit), by Mode of Transport 2024 & 2032
- Figure 33: North America IoT in Transportation Industry Revenue Share (%), by Mode of Transport 2024 & 2032
- Figure 34: North America IoT in Transportation Industry Volume Share (%), by Mode of Transport 2024 & 2032
- Figure 35: North America IoT in Transportation Industry Revenue (Million), by Application 2024 & 2032
- Figure 36: North America IoT in Transportation Industry Volume (K Unit), by Application 2024 & 2032
- Figure 37: North America IoT in Transportation Industry Revenue Share (%), by Application 2024 & 2032
- Figure 38: North America IoT in Transportation Industry Volume Share (%), by Application 2024 & 2032
- Figure 39: North America IoT in Transportation Industry Revenue (Million), by Country 2024 & 2032
- Figure 40: North America IoT in Transportation Industry Volume (K Unit), by Country 2024 & 2032
- Figure 41: North America IoT in Transportation Industry Revenue Share (%), by Country 2024 & 2032
- Figure 42: North America IoT in Transportation Industry Volume Share (%), by Country 2024 & 2032
- Figure 43: Europe IoT in Transportation Industry Revenue (Million), by Type 2024 & 2032
- Figure 44: Europe IoT in Transportation Industry Volume (K Unit), by Type 2024 & 2032
- Figure 45: Europe IoT in Transportation Industry Revenue Share (%), by Type 2024 & 2032
- Figure 46: Europe IoT in Transportation Industry Volume Share (%), by Type 2024 & 2032
- Figure 47: Europe IoT in Transportation Industry Revenue (Million), by Mode of Transport 2024 & 2032
- Figure 48: Europe IoT in Transportation Industry Volume (K Unit), by Mode of Transport 2024 & 2032
- Figure 49: Europe IoT in Transportation Industry Revenue Share (%), by Mode of Transport 2024 & 2032
- Figure 50: Europe IoT in Transportation Industry Volume Share (%), by Mode of Transport 2024 & 2032
- Figure 51: Europe IoT in Transportation Industry Revenue (Million), by Application 2024 & 2032
- Figure 52: Europe IoT in Transportation Industry Volume (K Unit), by Application 2024 & 2032
- Figure 53: Europe IoT in Transportation Industry Revenue Share (%), by Application 2024 & 2032
- Figure 54: Europe IoT in Transportation Industry Volume Share (%), by Application 2024 & 2032
- Figure 55: Europe IoT in Transportation Industry Revenue (Million), by Country 2024 & 2032
- Figure 56: Europe IoT in Transportation Industry Volume (K Unit), by Country 2024 & 2032
- Figure 57: Europe IoT in Transportation Industry Revenue Share (%), by Country 2024 & 2032
- Figure 58: Europe IoT in Transportation Industry Volume Share (%), by Country 2024 & 2032
- Figure 59: Asia Pacific IoT in Transportation Industry Revenue (Million), by Type 2024 & 2032
- Figure 60: Asia Pacific IoT in Transportation Industry Volume (K Unit), by Type 2024 & 2032
- Figure 61: Asia Pacific IoT in Transportation Industry Revenue Share (%), by Type 2024 & 2032
- Figure 62: Asia Pacific IoT in Transportation Industry Volume Share (%), by Type 2024 & 2032
- Figure 63: Asia Pacific IoT in Transportation Industry Revenue (Million), by Mode of Transport 2024 & 2032
- Figure 64: Asia Pacific IoT in Transportation Industry Volume (K Unit), by Mode of Transport 2024 & 2032
- Figure 65: Asia Pacific IoT in Transportation Industry Revenue Share (%), by Mode of Transport 2024 & 2032
- Figure 66: Asia Pacific IoT in Transportation Industry Volume Share (%), by Mode of Transport 2024 & 2032
- Figure 67: Asia Pacific IoT in Transportation Industry Revenue (Million), by Application 2024 & 2032
- Figure 68: Asia Pacific IoT in Transportation Industry Volume (K Unit), by Application 2024 & 2032
- Figure 69: Asia Pacific IoT in Transportation Industry Revenue Share (%), by Application 2024 & 2032
- Figure 70: Asia Pacific IoT in Transportation Industry Volume Share (%), by Application 2024 & 2032
- Figure 71: Asia Pacific IoT in Transportation Industry Revenue (Million), by Country 2024 & 2032
- Figure 72: Asia Pacific IoT in Transportation Industry Volume (K Unit), by Country 2024 & 2032
- Figure 73: Asia Pacific IoT in Transportation Industry Revenue Share (%), by Country 2024 & 2032
- Figure 74: Asia Pacific IoT in Transportation Industry Volume Share (%), by Country 2024 & 2032
- Figure 75: Latin America IoT in Transportation Industry Revenue (Million), by Type 2024 & 2032
- Figure 76: Latin America IoT in Transportation Industry Volume (K Unit), by Type 2024 & 2032
- Figure 77: Latin America IoT in Transportation Industry Revenue Share (%), by Type 2024 & 2032
- Figure 78: Latin America IoT in Transportation Industry Volume Share (%), by Type 2024 & 2032
- Figure 79: Latin America IoT in Transportation Industry Revenue (Million), by Mode of Transport 2024 & 2032
- Figure 80: Latin America IoT in Transportation Industry Volume (K Unit), by Mode of Transport 2024 & 2032
- Figure 81: Latin America IoT in Transportation Industry Revenue Share (%), by Mode of Transport 2024 & 2032
- Figure 82: Latin America IoT in Transportation Industry Volume Share (%), by Mode of Transport 2024 & 2032
- Figure 83: Latin America IoT in Transportation Industry Revenue (Million), by Application 2024 & 2032
- Figure 84: Latin America IoT in Transportation Industry Volume (K Unit), by Application 2024 & 2032
- Figure 85: Latin America IoT in Transportation Industry Revenue Share (%), by Application 2024 & 2032
- Figure 86: Latin America IoT in Transportation Industry Volume Share (%), by Application 2024 & 2032
- Figure 87: Latin America IoT in Transportation Industry Revenue (Million), by Country 2024 & 2032
- Figure 88: Latin America IoT in Transportation Industry Volume (K Unit), by Country 2024 & 2032
- Figure 89: Latin America IoT in Transportation Industry Revenue Share (%), by Country 2024 & 2032
- Figure 90: Latin America IoT in Transportation Industry Volume Share (%), by Country 2024 & 2032
- Figure 91: Middle East and Africa IoT in Transportation Industry Revenue (Million), by Type 2024 & 2032
- Figure 92: Middle East and Africa IoT in Transportation Industry Volume (K Unit), by Type 2024 & 2032
- Figure 93: Middle East and Africa IoT in Transportation Industry Revenue Share (%), by Type 2024 & 2032
- Figure 94: Middle East and Africa IoT in Transportation Industry Volume Share (%), by Type 2024 & 2032
- Figure 95: Middle East and Africa IoT in Transportation Industry Revenue (Million), by Mode of Transport 2024 & 2032
- Figure 96: Middle East and Africa IoT in Transportation Industry Volume (K Unit), by Mode of Transport 2024 & 2032
- Figure 97: Middle East and Africa IoT in Transportation Industry Revenue Share (%), by Mode of Transport 2024 & 2032
- Figure 98: Middle East and Africa IoT in Transportation Industry Volume Share (%), by Mode of Transport 2024 & 2032
- Figure 99: Middle East and Africa IoT in Transportation Industry Revenue (Million), by Application 2024 & 2032
- Figure 100: Middle East and Africa IoT in Transportation Industry Volume (K Unit), by Application 2024 & 2032
- Figure 101: Middle East and Africa IoT in Transportation Industry Revenue Share (%), by Application 2024 & 2032
- Figure 102: Middle East and Africa IoT in Transportation Industry Volume Share (%), by Application 2024 & 2032
- Figure 103: Middle East and Africa IoT in Transportation Industry Revenue (Million), by Country 2024 & 2032
- Figure 104: Middle East and Africa IoT in Transportation Industry Volume (K Unit), by Country 2024 & 2032
- Figure 105: Middle East and Africa IoT in Transportation Industry Revenue Share (%), by Country 2024 & 2032
- Figure 106: Middle East and Africa IoT in Transportation Industry Volume Share (%), by Country 2024 & 2032
List of Tables
- Table 1: Global IoT in Transportation Industry Revenue Million Forecast, by Region 2019 & 2032
- Table 2: Global IoT in Transportation Industry Volume K Unit Forecast, by Region 2019 & 2032
- Table 3: Global IoT in Transportation Industry Revenue Million Forecast, by Type 2019 & 2032
- Table 4: Global IoT in Transportation Industry Volume K Unit Forecast, by Type 2019 & 2032
- Table 5: Global IoT in Transportation Industry Revenue Million Forecast, by Mode of Transport 2019 & 2032
- Table 6: Global IoT in Transportation Industry Volume K Unit Forecast, by Mode of Transport 2019 & 2032
- Table 7: Global IoT in Transportation Industry Revenue Million Forecast, by Application 2019 & 2032
- Table 8: Global IoT in Transportation Industry Volume K Unit Forecast, by Application 2019 & 2032
- Table 9: Global IoT in Transportation Industry Revenue Million Forecast, by Region 2019 & 2032
- Table 10: Global IoT in Transportation Industry Volume K Unit Forecast, by Region 2019 & 2032
- Table 11: Global IoT in Transportation Industry Revenue Million Forecast, by Country 2019 & 2032
- Table 12: Global IoT in Transportation Industry Volume K Unit Forecast, by Country 2019 & 2032
- Table 13: United States IoT in Transportation Industry Revenue (Million) Forecast, by Application 2019 & 2032
- Table 14: United States IoT in Transportation Industry Volume (K Unit) Forecast, by Application 2019 & 2032
- Table 15: Canada IoT in Transportation Industry Revenue (Million) Forecast, by Application 2019 & 2032
- Table 16: Canada IoT in Transportation Industry Volume (K Unit) Forecast, by Application 2019 & 2032
- Table 17: Mexico IoT in Transportation Industry Revenue (Million) Forecast, by Application 2019 & 2032
- Table 18: Mexico IoT in Transportation Industry Volume (K Unit) Forecast, by Application 2019 & 2032
- Table 19: Global IoT in Transportation Industry Revenue Million Forecast, by Country 2019 & 2032
- Table 20: Global IoT in Transportation Industry Volume K Unit Forecast, by Country 2019 & 2032
- Table 21: Germany IoT in Transportation Industry Revenue (Million) Forecast, by Application 2019 & 2032
- Table 22: Germany IoT in Transportation Industry Volume (K Unit) Forecast, by Application 2019 & 2032
- Table 23: United Kingdom IoT in Transportation Industry Revenue (Million) Forecast, by Application 2019 & 2032
- Table 24: United Kingdom IoT in Transportation Industry Volume (K Unit) Forecast, by Application 2019 & 2032
- Table 25: France IoT in Transportation Industry Revenue (Million) Forecast, by Application 2019 & 2032
- Table 26: France IoT in Transportation Industry Volume (K Unit) Forecast, by Application 2019 & 2032
- Table 27: Spain IoT in Transportation Industry Revenue (Million) Forecast, by Application 2019 & 2032
- Table 28: Spain IoT in Transportation Industry Volume (K Unit) Forecast, by Application 2019 & 2032
- Table 29: Italy IoT in Transportation Industry Revenue (Million) Forecast, by Application 2019 & 2032
- Table 30: Italy IoT in Transportation Industry Volume (K Unit) Forecast, by Application 2019 & 2032
- Table 31: Spain IoT in Transportation Industry Revenue (Million) Forecast, by Application 2019 & 2032
- Table 32: Spain IoT in Transportation Industry Volume (K Unit) Forecast, by Application 2019 & 2032
- Table 33: Belgium IoT in Transportation Industry Revenue (Million) Forecast, by Application 2019 & 2032
- Table 34: Belgium IoT in Transportation Industry Volume (K Unit) Forecast, by Application 2019 & 2032
- Table 35: Netherland IoT in Transportation Industry Revenue (Million) Forecast, by Application 2019 & 2032
- Table 36: Netherland IoT in Transportation Industry Volume (K Unit) Forecast, by Application 2019 & 2032
- Table 37: Nordics IoT in Transportation Industry Revenue (Million) Forecast, by Application 2019 & 2032
- Table 38: Nordics IoT in Transportation Industry Volume (K Unit) Forecast, by Application 2019 & 2032
- Table 39: Rest of Europe IoT in Transportation Industry Revenue (Million) Forecast, by Application 2019 & 2032
- Table 40: Rest of Europe IoT in Transportation Industry Volume (K Unit) Forecast, by Application 2019 & 2032
- Table 41: Global IoT in Transportation Industry Revenue Million Forecast, by Country 2019 & 2032
- Table 42: Global IoT in Transportation Industry Volume K Unit Forecast, by Country 2019 & 2032
- Table 43: China IoT in Transportation Industry Revenue (Million) Forecast, by Application 2019 & 2032
- Table 44: China IoT in Transportation Industry Volume (K Unit) Forecast, by Application 2019 & 2032
- Table 45: Japan IoT in Transportation Industry Revenue (Million) Forecast, by Application 2019 & 2032
- Table 46: Japan IoT in Transportation Industry Volume (K Unit) Forecast, by Application 2019 & 2032
- Table 47: India IoT in Transportation Industry Revenue (Million) Forecast, by Application 2019 & 2032
- Table 48: India IoT in Transportation Industry Volume (K Unit) Forecast, by Application 2019 & 2032
- Table 49: South Korea IoT in Transportation Industry Revenue (Million) Forecast, by Application 2019 & 2032
- Table 50: South Korea IoT in Transportation Industry Volume (K Unit) Forecast, by Application 2019 & 2032
- Table 51: Southeast Asia IoT in Transportation Industry Revenue (Million) Forecast, by Application 2019 & 2032
- Table 52: Southeast Asia IoT in Transportation Industry Volume (K Unit) Forecast, by Application 2019 & 2032
- Table 53: Australia IoT in Transportation Industry Revenue (Million) Forecast, by Application 2019 & 2032
- Table 54: Australia IoT in Transportation Industry Volume (K Unit) Forecast, by Application 2019 & 2032
- Table 55: Indonesia IoT in Transportation Industry Revenue (Million) Forecast, by Application 2019 & 2032
- Table 56: Indonesia IoT in Transportation Industry Volume (K Unit) Forecast, by Application 2019 & 2032
- Table 57: Phillipes IoT in Transportation Industry Revenue (Million) Forecast, by Application 2019 & 2032
- Table 58: Phillipes IoT in Transportation Industry Volume (K Unit) Forecast, by Application 2019 & 2032
- Table 59: Singapore IoT in Transportation Industry Revenue (Million) Forecast, by Application 2019 & 2032
- Table 60: Singapore IoT in Transportation Industry Volume (K Unit) Forecast, by Application 2019 & 2032
- Table 61: Thailandc IoT in Transportation Industry Revenue (Million) Forecast, by Application 2019 & 2032
- Table 62: Thailandc IoT in Transportation Industry Volume (K Unit) Forecast, by Application 2019 & 2032
- Table 63: Rest of Asia Pacific IoT in Transportation Industry Revenue (Million) Forecast, by Application 2019 & 2032
- Table 64: Rest of Asia Pacific IoT in Transportation Industry Volume (K Unit) Forecast, by Application 2019 & 2032
- Table 65: Global IoT in Transportation Industry Revenue Million Forecast, by Country 2019 & 2032
- Table 66: Global IoT in Transportation Industry Volume K Unit Forecast, by Country 2019 & 2032
- Table 67: Brazil IoT in Transportation Industry Revenue (Million) Forecast, by Application 2019 & 2032
- Table 68: Brazil IoT in Transportation Industry Volume (K Unit) Forecast, by Application 2019 & 2032
- Table 69: Argentina IoT in Transportation Industry Revenue (Million) Forecast, by Application 2019 & 2032
- Table 70: Argentina IoT in Transportation Industry Volume (K Unit) Forecast, by Application 2019 & 2032
- Table 71: Peru IoT in Transportation Industry Revenue (Million) Forecast, by Application 2019 & 2032
- Table 72: Peru IoT in Transportation Industry Volume (K Unit) Forecast, by Application 2019 & 2032
- Table 73: Chile IoT in Transportation Industry Revenue (Million) Forecast, by Application 2019 & 2032
- Table 74: Chile IoT in Transportation Industry Volume (K Unit) Forecast, by Application 2019 & 2032
- Table 75: Colombia IoT in Transportation Industry Revenue (Million) Forecast, by Application 2019 & 2032
- Table 76: Colombia IoT in Transportation Industry Volume (K Unit) Forecast, by Application 2019 & 2032
- Table 77: Ecuador IoT in Transportation Industry Revenue (Million) Forecast, by Application 2019 & 2032
- Table 78: Ecuador IoT in Transportation Industry Volume (K Unit) Forecast, by Application 2019 & 2032
- Table 79: Venezuela IoT in Transportation Industry Revenue (Million) Forecast, by Application 2019 & 2032
- Table 80: Venezuela IoT in Transportation Industry Volume (K Unit) Forecast, by Application 2019 & 2032
- Table 81: Rest of South America IoT in Transportation Industry Revenue (Million) Forecast, by Application 2019 & 2032
- Table 82: Rest of South America IoT in Transportation Industry Volume (K Unit) Forecast, by Application 2019 & 2032
- Table 83: Global IoT in Transportation Industry Revenue Million Forecast, by Country 2019 & 2032
- Table 84: Global IoT in Transportation Industry Volume K Unit Forecast, by Country 2019 & 2032
- Table 85: United States IoT in Transportation Industry Revenue (Million) Forecast, by Application 2019 & 2032
- Table 86: United States IoT in Transportation Industry Volume (K Unit) Forecast, by Application 2019 & 2032
- Table 87: Canada IoT in Transportation Industry Revenue (Million) Forecast, by Application 2019 & 2032
- Table 88: Canada IoT in Transportation Industry Volume (K Unit) Forecast, by Application 2019 & 2032
- Table 89: Mexico IoT in Transportation Industry Revenue (Million) Forecast, by Application 2019 & 2032
- Table 90: Mexico IoT in Transportation Industry Volume (K Unit) Forecast, by Application 2019 & 2032
- Table 91: Global IoT in Transportation Industry Revenue Million Forecast, by Country 2019 & 2032
- Table 92: Global IoT in Transportation Industry Volume K Unit Forecast, by Country 2019 & 2032
- Table 93: United Arab Emirates IoT in Transportation Industry Revenue (Million) Forecast, by Application 2019 & 2032
- Table 94: United Arab Emirates IoT in Transportation Industry Volume (K Unit) Forecast, by Application 2019 & 2032
- Table 95: Saudi Arabia IoT in Transportation Industry Revenue (Million) Forecast, by Application 2019 & 2032
- Table 96: Saudi Arabia IoT in Transportation Industry Volume (K Unit) Forecast, by Application 2019 & 2032
- Table 97: South Africa IoT in Transportation Industry Revenue (Million) Forecast, by Application 2019 & 2032
- Table 98: South Africa IoT in Transportation Industry Volume (K Unit) Forecast, by Application 2019 & 2032
- Table 99: Rest of Middle East and Africa IoT in Transportation Industry Revenue (Million) Forecast, by Application 2019 & 2032
- Table 100: Rest of Middle East and Africa IoT in Transportation Industry Volume (K Unit) Forecast, by Application 2019 & 2032
- Table 101: Global IoT in Transportation Industry Revenue Million Forecast, by Type 2019 & 2032
- Table 102: Global IoT in Transportation Industry Volume K Unit Forecast, by Type 2019 & 2032
- Table 103: Global IoT in Transportation Industry Revenue Million Forecast, by Mode of Transport 2019 & 2032
- Table 104: Global IoT in Transportation Industry Volume K Unit Forecast, by Mode of Transport 2019 & 2032
- Table 105: Global IoT in Transportation Industry Revenue Million Forecast, by Application 2019 & 2032
- Table 106: Global IoT in Transportation Industry Volume K Unit Forecast, by Application 2019 & 2032
- Table 107: Global IoT in Transportation Industry Revenue Million Forecast, by Country 2019 & 2032
- Table 108: Global IoT in Transportation Industry Volume K Unit Forecast, by Country 2019 & 2032
- Table 109: United States IoT in Transportation Industry Revenue (Million) Forecast, by Application 2019 & 2032
- Table 110: United States IoT in Transportation Industry Volume (K Unit) Forecast, by Application 2019 & 2032
- Table 111: Canada IoT in Transportation Industry Revenue (Million) Forecast, by Application 2019 & 2032
- Table 112: Canada IoT in Transportation Industry Volume (K Unit) Forecast, by Application 2019 & 2032
- Table 113: Global IoT in Transportation Industry Revenue Million Forecast, by Type 2019 & 2032
- Table 114: Global IoT in Transportation Industry Volume K Unit Forecast, by Type 2019 & 2032
- Table 115: Global IoT in Transportation Industry Revenue Million Forecast, by Mode of Transport 2019 & 2032
- Table 116: Global IoT in Transportation Industry Volume K Unit Forecast, by Mode of Transport 2019 & 2032
- Table 117: Global IoT in Transportation Industry Revenue Million Forecast, by Application 2019 & 2032
- Table 118: Global IoT in Transportation Industry Volume K Unit Forecast, by Application 2019 & 2032
- Table 119: Global IoT in Transportation Industry Revenue Million Forecast, by Country 2019 & 2032
- Table 120: Global IoT in Transportation Industry Volume K Unit Forecast, by Country 2019 & 2032
- Table 121: United Kingdom IoT in Transportation Industry Revenue (Million) Forecast, by Application 2019 & 2032
- Table 122: United Kingdom IoT in Transportation Industry Volume (K Unit) Forecast, by Application 2019 & 2032
- Table 123: Germany IoT in Transportation Industry Revenue (Million) Forecast, by Application 2019 & 2032
- Table 124: Germany IoT in Transportation Industry Volume (K Unit) Forecast, by Application 2019 & 2032
- Table 125: France IoT in Transportation Industry Revenue (Million) Forecast, by Application 2019 & 2032
- Table 126: France IoT in Transportation Industry Volume (K Unit) Forecast, by Application 2019 & 2032
- Table 127: Rest of Europe IoT in Transportation Industry Revenue (Million) Forecast, by Application 2019 & 2032
- Table 128: Rest of Europe IoT in Transportation Industry Volume (K Unit) Forecast, by Application 2019 & 2032
- Table 129: Global IoT in Transportation Industry Revenue Million Forecast, by Type 2019 & 2032
- Table 130: Global IoT in Transportation Industry Volume K Unit Forecast, by Type 2019 & 2032
- Table 131: Global IoT in Transportation Industry Revenue Million Forecast, by Mode of Transport 2019 & 2032
- Table 132: Global IoT in Transportation Industry Volume K Unit Forecast, by Mode of Transport 2019 & 2032
- Table 133: Global IoT in Transportation Industry Revenue Million Forecast, by Application 2019 & 2032
- Table 134: Global IoT in Transportation Industry Volume K Unit Forecast, by Application 2019 & 2032
- Table 135: Global IoT in Transportation Industry Revenue Million Forecast, by Country 2019 & 2032
- Table 136: Global IoT in Transportation Industry Volume K Unit Forecast, by Country 2019 & 2032
- Table 137: China IoT in Transportation Industry Revenue (Million) Forecast, by Application 2019 & 2032
- Table 138: China IoT in Transportation Industry Volume (K Unit) Forecast, by Application 2019 & 2032
- Table 139: India IoT in Transportation Industry Revenue (Million) Forecast, by Application 2019 & 2032
- Table 140: India IoT in Transportation Industry Volume (K Unit) Forecast, by Application 2019 & 2032
- Table 141: Japan IoT in Transportation Industry Revenue (Million) Forecast, by Application 2019 & 2032
- Table 142: Japan IoT in Transportation Industry Volume (K Unit) Forecast, by Application 2019 & 2032
- Table 143: Rest of Asia Pacific IoT in Transportation Industry Revenue (Million) Forecast, by Application 2019 & 2032
- Table 144: Rest of Asia Pacific IoT in Transportation Industry Volume (K Unit) Forecast, by Application 2019 & 2032
- Table 145: Global IoT in Transportation Industry Revenue Million Forecast, by Type 2019 & 2032
- Table 146: Global IoT in Transportation Industry Volume K Unit Forecast, by Type 2019 & 2032
- Table 147: Global IoT in Transportation Industry Revenue Million Forecast, by Mode of Transport 2019 & 2032
- Table 148: Global IoT in Transportation Industry Volume K Unit Forecast, by Mode of Transport 2019 & 2032
- Table 149: Global IoT in Transportation Industry Revenue Million Forecast, by Application 2019 & 2032
- Table 150: Global IoT in Transportation Industry Volume K Unit Forecast, by Application 2019 & 2032
- Table 151: Global IoT in Transportation Industry Revenue Million Forecast, by Country 2019 & 2032
- Table 152: Global IoT in Transportation Industry Volume K Unit Forecast, by Country 2019 & 2032
- Table 153: Global IoT in Transportation Industry Revenue Million Forecast, by Type 2019 & 2032
- Table 154: Global IoT in Transportation Industry Volume K Unit Forecast, by Type 2019 & 2032
- Table 155: Global IoT in Transportation Industry Revenue Million Forecast, by Mode of Transport 2019 & 2032
- Table 156: Global IoT in Transportation Industry Volume K Unit Forecast, by Mode of Transport 2019 & 2032
- Table 157: Global IoT in Transportation Industry Revenue Million Forecast, by Application 2019 & 2032
- Table 158: Global IoT in Transportation Industry Volume K Unit Forecast, by Application 2019 & 2032
- Table 159: Global IoT in Transportation Industry Revenue Million Forecast, by Country 2019 & 2032
- Table 160: Global IoT in Transportation Industry Volume K Unit Forecast, by Country 2019 & 2032
Frequently Asked Questions
1. What is the projected Compound Annual Growth Rate (CAGR) of the IoT in Transportation Industry?
The projected CAGR is approximately 14.50%.
2. Which companies are prominent players in the IoT in Transportation Industry?
Key companies in the market include General Electric, Denso Corporation, Garmin International Inc, IBM Corporation, Tomtom N V , Thales Group, Verizon Communications Inc, CISCO Systems Inc, AT & T INC, Alcatel-Lucent.
3. What are the main segments of the IoT in Transportation Industry?
The market segments include Type, Mode of Transport, Application.
4. Can you provide details about the market size?
The market size is estimated to be USD XX Million as of 2022.
5. What are some drivers contributing to market growth?
; Decreased cost of powerful sensors & controllers; Extended connectivity and enhanced internet connectivity; Government Initiatives for Smart Cities.
6. What are the notable trends driving market growth?
The Railway Segment is Expected to Occupy Significant Market Share.
7. Are there any restraints impacting market growth?
; High Initial Cost; Threat for data security & privacy; Poor transport infrastructure in the developing and underdeveloped nations.
8. Can you provide examples of recent developments in the market?
N/A
9. What pricing options are available for accessing the report?
Pricing options include single-user, multi-user, and enterprise licenses priced at USD 4750, USD 5250, and USD 8750 respectively.
10. Is the market size provided in terms of value or volume?
The market size is provided in terms of value, measured in Million and volume, measured in K Unit.
11. Are there any specific market keywords associated with the report?
Yes, the market keyword associated with the report is "IoT in Transportation Industry," which aids in identifying and referencing the specific market segment covered.
12. How do I determine which pricing option suits my needs best?
The pricing options vary based on user requirements and access needs. Individual users may opt for single-user licenses, while businesses requiring broader access may choose multi-user or enterprise licenses for cost-effective access to the report.
13. Are there any additional resources or data provided in the IoT in Transportation Industry report?
While the report offers comprehensive insights, it's advisable to review the specific contents or supplementary materials provided to ascertain if additional resources or data are available.
14. How can I stay updated on further developments or reports in the IoT in Transportation Industry?
To stay informed about further developments, trends, and reports in the IoT in Transportation Industry, consider subscribing to industry newsletters, following relevant companies and organizations, or regularly checking reputable industry news sources and publications.
Methodology
Step 1 - Identification of Relevant Samples Size from Population Database


Step 2 - Approaches for Defining Global Market Size (Value, Volume* & Price*)

Note*: In applicable scenarios
Step 3 - Data Sources
Primary Research
- Web Analytics
- Survey Reports
- Research Institute
- Latest Research Reports
- Opinion Leaders
Secondary Research
- Annual Reports
- White Paper
- Latest Press Release
- Industry Association
- Paid Database
- Investor Presentations

Step 4 - Data Triangulation
Involves using different sources of information in order to increase the validity of a study
These sources are likely to be stakeholders in a program - participants, other researchers, program staff, other community members, and so on.
Then we put all data in single framework & apply various statistical tools to find out the dynamic on the market.
During the analysis stage, feedback from the stakeholder groups would be compared to determine areas of agreement as well as areas of divergence
