

Key Insights
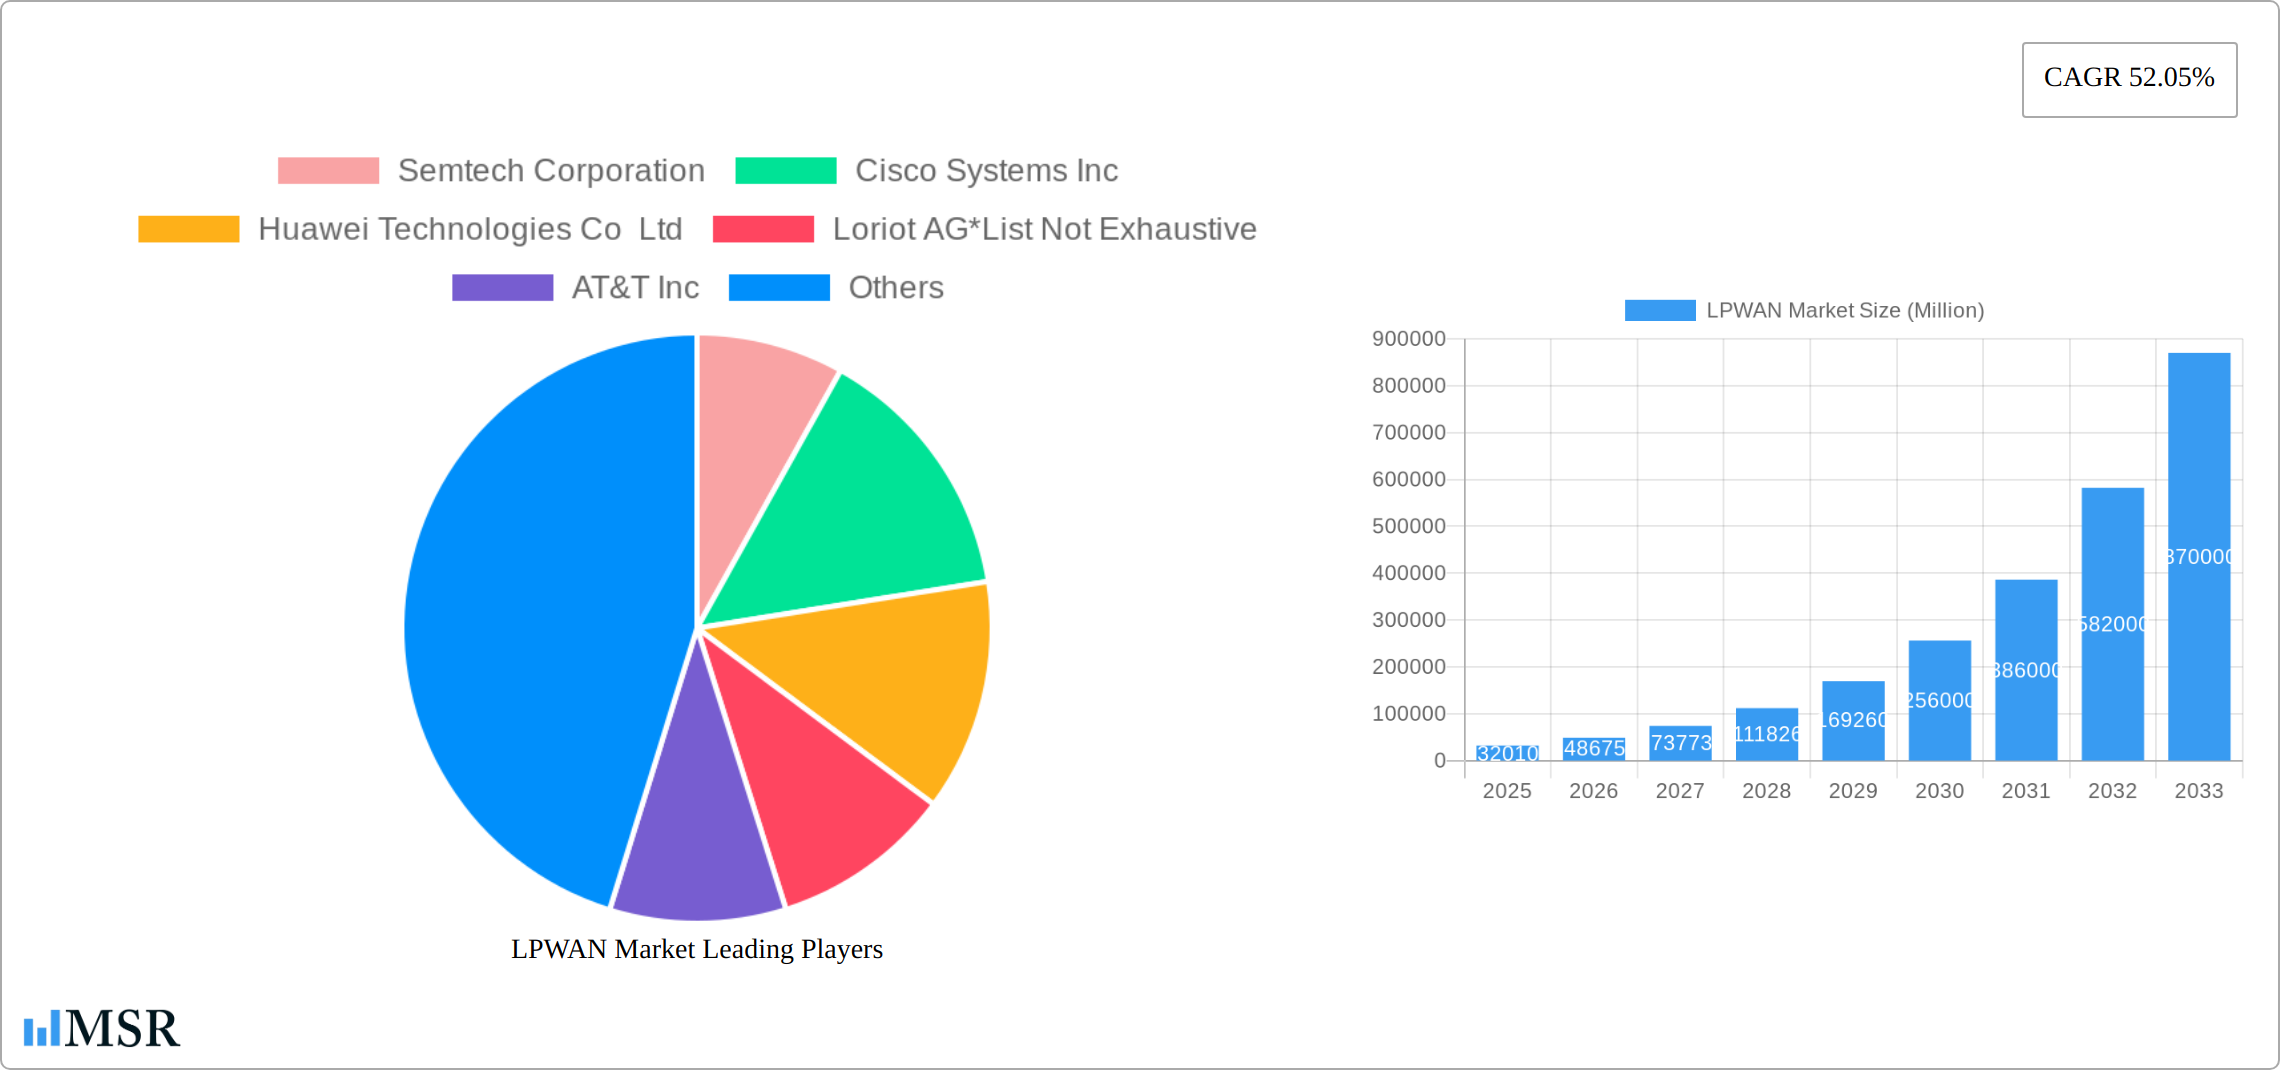
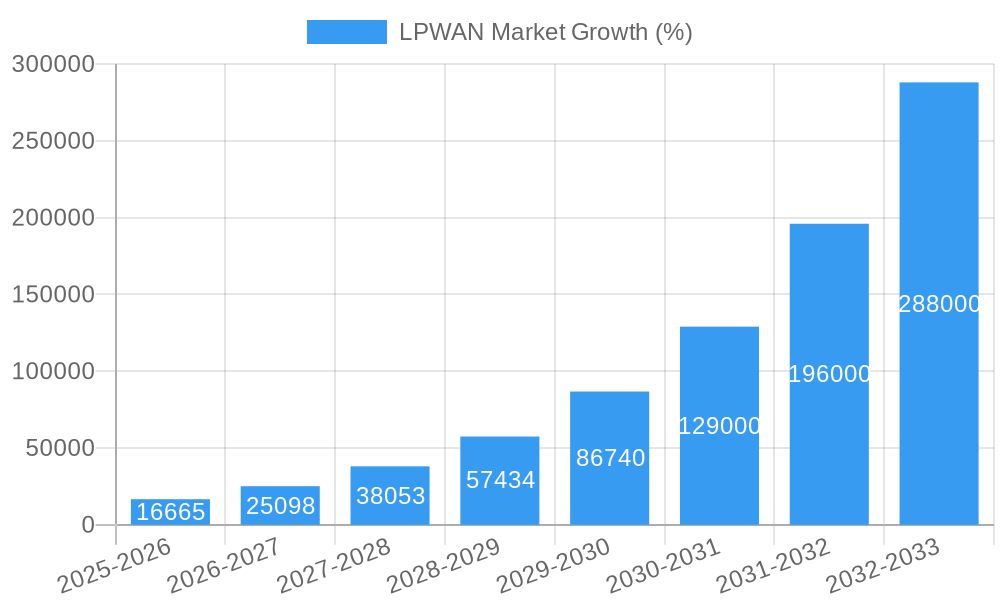
The Low-Power Wide-Area Network (LPWAN) market is experiencing explosive growth, projected to reach a substantial size driven by the increasing adoption of Internet of Things (IoT) devices across diverse sectors. The market's Compound Annual Growth Rate (CAGR) of 52.05% from 2019 to 2024 indicates a significant upward trajectory. This robust expansion is fueled by several key factors. The demand for cost-effective, long-range, and low-power connectivity solutions is driving the adoption of LPWAN technologies in applications such as smart cities, smart agriculture, and industrial automation. Furthermore, the continuous advancements in LPWAN technologies, including LoRaWAN, NB-IoT, and LTE-M, are enhancing capabilities and expanding their applicability. The market is segmented by technology type, service model (professional vs. managed), end-user industry (oil & gas, consumer electronics, healthcare, etc.), and application. The dominance of certain segments, such as smart city initiatives and industrial IoT deployments, further underscores the market's potential. Key players like Semtech, Cisco, Huawei, and others are actively investing in research and development, expanding their product portfolios, and strategically forming partnerships to capitalize on this growth opportunity. The competitive landscape is dynamic, with established players and emerging companies vying for market share.
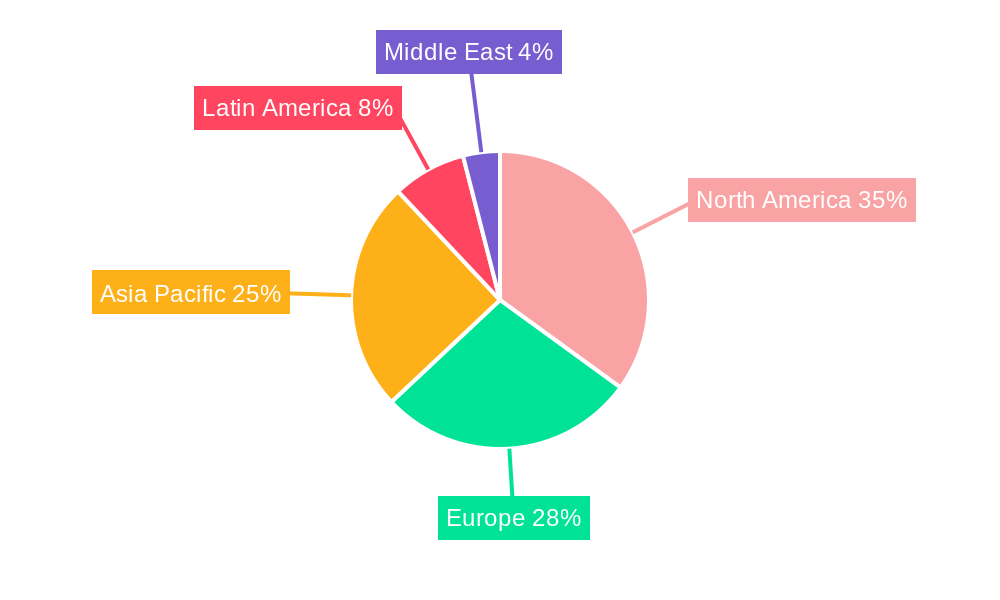
The geographical distribution of the LPWAN market is expected to show significant variations, with regions like North America and Asia Pacific likely leading the charge due to high technological adoption and robust IoT infrastructure development. Europe is also projected to witness significant growth, driven by supportive government regulations and increasing industrial automation. However, the market's growth is not without challenges. Regulatory hurdles in some regions and the need for interoperability between different LPWAN technologies present obstacles to wider adoption. Despite these restraints, the long-term outlook for the LPWAN market remains positive, with continuous innovation and expanding applications anticipated to fuel sustained growth throughout the forecast period (2025-2033). The market size in 2025 is estimated to be substantial, considering the impressive CAGR and current market trends. Further analysis reveals strong potential for continued market expansion.
Unlock the Potential of the LPWAN Market: A Comprehensive Market Report (2019-2033)
This comprehensive report provides an in-depth analysis of the Low-Power Wide-Area Networks (LPWAN) market, offering invaluable insights for industry stakeholders seeking to navigate this rapidly evolving landscape. Covering the period from 2019 to 2033, with a focus on 2025, this report meticulously examines market dynamics, key segments, technological advancements, and future growth opportunities. The global LPWAN market is projected to reach xx Million by 2033, exhibiting a significant CAGR.
LPWAN Market Concentration & Dynamics
The LPWAN market exhibits a moderately concentrated landscape, with key players such as Semtech Corporation, Cisco Systems Inc, Huawei Technologies Co Ltd, and Loriot AG holding significant market share. However, the market is also characterized by a vibrant ecosystem of smaller players and startups driving innovation.
- Market Share: Semtech Corporation and Cisco Systems Inc. are estimated to collectively hold approximately xx% of the market share in 2025, while Huawei Technologies Co Ltd and Loriot AG hold xx% and xx% respectively. The remaining share is distributed among numerous smaller players and niche providers. These figures are subject to change based on future M&A activity and technological advancements.
- M&A Activity: The LPWAN market has witnessed a moderate level of mergers and acquisitions (M&As) in recent years, primarily driven by efforts to expand product portfolios, enhance technological capabilities, and consolidate market share. An estimated xx M&A deals occurred within the period of 2019-2024. This activity is expected to continue as larger players seek to strengthen their positions and smaller players look for strategic partnerships.
- Innovation Ecosystem: The LPWAN sector thrives on a dynamic innovation ecosystem, fueled by continuous advancements in semiconductor technology, software development, and network infrastructure. This results in a constant stream of new products, services, and applications.
- Regulatory Frameworks: Regulatory frameworks play a crucial role in shaping the LPWAN market. Variations in spectrum allocation and licensing requirements across different regions can impact market growth and adoption rates. Harmonization of regulatory frameworks is crucial for fostering wider LPWAN deployment.
- Substitute Products: While LPWAN technologies offer unique advantages in terms of low power consumption and long range, potential substitute technologies including cellular networks and Wi-Fi continue to compete for market share in specific applications.
- End-User Trends: The increasing adoption of IoT devices and applications across various industries is a key driver of LPWAN market growth. End-users are demanding more reliable, secure, and cost-effective connectivity solutions, driving innovation and adoption within the LPWAN sector.
LPWAN Market Industry Insights & Trends
The global LPWAN market is experiencing robust growth, driven by several factors. The increasing demand for IoT applications across various sectors, coupled with the advantages of LPWAN technologies—low power consumption, long range, and cost-effectiveness—are key drivers. The market size reached xx Million in 2024 and is projected to reach xx Million in 2025, exhibiting a CAGR of xx% during the forecast period (2025-2033). Technological disruptions, such as the development of new and improved LPWAN technologies, and the rising adoption of cloud-based platforms are further accelerating market growth. Evolving consumer behaviors, including the increasing demand for smart devices and connected solutions, are also influencing market trends. This expansion is further fueled by advancements in 5G technology, which will lead to improved performance and reliability of LPWAN deployments. Increased investments in smart city and smart agriculture initiatives by governments and corporations worldwide are boosting the growth of the LPWAN market.
Key Markets & Segments Leading LPWAN Market
The LPWAN market is segmented by type, service, end-user, and application.
- By Type: LoRaWAN currently holds the largest market share, followed by NB-IoT and LTE-M. Other types, including Sigfox and Weightless, are also gaining traction in niche applications.
- By Service: The managed service segment is expected to witness higher growth compared to the professional service segment due to the increasing demand for managed connectivity solutions, with less need for internal management and expertise.
- By End-user: The industrial manufacturing segment is a significant driver of market growth, followed by oil and gas, and logistics and traveling. Growth in these sectors are driven by the need for remote monitoring, asset tracking, and process automation. However, consumer electronics adoption is steadily increasing as well.
- By Application: Smart city initiatives are a key driver of LPWAN adoption, followed by smart homes/buildings and smart agriculture. The demand for remote monitoring, security, and data analytics in these sectors is fueling the expansion of the LPWAN market.
Drivers of Growth:
- Economic growth in developing economies is boosting investments in infrastructure projects, creating opportunities for LPWAN deployment.
- Increasing government initiatives focused on smart city development and the IoT adoption are providing a significant boost to the market.
- The falling cost of LPWAN technologies is making them more accessible for smaller businesses.
Dominance Analysis: While LoRaWAN currently leads in market share by type, the NB-IoT and LTE-M segments are expected to grow at faster rates due to their compatibility with existing cellular infrastructure and wider support among telecom providers. The industrial manufacturing sector stands out as the leading end-user segment due to its extensive application in monitoring, asset tracking, and operational efficiency enhancements.
LPWAN Market Product Developments
Recent product developments in the LPWAN market include advancements in low-power chips, improved network infrastructure, and the development of new applications tailored to specific industries. For instance, Semtech's expansion of its PerSe product portfolio demonstrates a focus on enhanced RF control for 5G devices, improving connectivity and compliance with SAR standards. UnaBiz's open-sourcing of its Sigfox 0G technology library fosters wider adoption and innovation within the developer community, streamlining implementation and potentially leading to a wider range of applications and more competitive pricing. These advancements are enhancing the overall performance, reliability, and cost-effectiveness of LPWAN solutions, driving market growth and broadening the range of applications.
Challenges in the LPWAN Market Market
The LPWAN market faces several challenges, including regulatory hurdles regarding spectrum allocation, and the supply chain constraints impacting the availability of components. Competitive pressures from alternative connectivity technologies also pose a threat. These challenges, if not addressed, could impact market growth by approximately xx% in the coming years.
Forces Driving LPWAN Market Growth
Key growth drivers include the expanding IoT ecosystem, increasing demand for remote monitoring solutions, and supportive government regulations. The decreasing cost of LPWAN devices and improving network coverage are also contributing to market expansion. For example, smart city initiatives are driving a significant demand for LPWAN technologies for various applications like smart parking, waste management and environmental monitoring.
Long-Term Growth Catalysts in the LPWAN Market
Long-term growth will be fueled by strategic partnerships between technology providers and telecommunication operators, leading to wider deployment and standardization. Further innovation in low-power technologies and expansion into new applications, such as precision agriculture and industrial automation, will also sustain market growth.
Emerging Opportunities in LPWAN Market
Emerging opportunities lie in the expansion into new markets like smart healthcare and smart energy management. The development of more sophisticated LPWAN applications for asset tracking, condition monitoring and predictive maintenance will open up further growth avenues. Demand for secure and reliable connectivity will also drive the need for advanced LPWAN security features and solutions.
Leading Players in the LPWAN Market Sector
- Semtech Corporation
- Cisco Systems Inc
- Huawei Technologies Co Ltd
- Loriot AG
- AT&T Inc
- Sigfox SA
- Ingenu Inc
- Vodafone Group PLC
Key Milestones in LPWAN Market Industry
- April 2023: Semtech Corporation announced the expansion of its PerSe product portfolio with a new integrated circuit (IC) for 5G mobile devices. This enhances RF control in devices, improving connectivity and 5G SAR compliance. This is expected to significantly increase the adoption of LPWAN in 5G enabled consumer products.
- April 2023: UnaBiz open-sourced its Sigfox 0G technology device library code, expanding the developer community's access to this technology. This lowers the barrier to entry for developers and is expected to accelerate the development of new applications based on the 0G technology, potentially driving down prices and broadening usage.
Strategic Outlook for LPWAN Market Market
The LPWAN market is poised for sustained growth, driven by technological advancements, expanding IoT adoption, and increasing investments in infrastructure development. Strategic partnerships, focusing on interoperability and standardization, will be crucial in unlocking the full potential of this market. Companies that can adapt to the evolving needs of various sectors and provide robust, secure, and cost-effective solutions will be well-positioned to capture significant market share.
LPWAN Market Segmentation
-
1. Type
- 1.1. LoRaWAN
- 1.2. NB-IoT
- 1.3. LTE-M
- 1.4. Other Types (Sigfox, Weightless, etc.)
-
2. Service
- 2.1. Professional Service
- 2.2. Managed Service
-
3. End User
- 3.1. Oil and Gas
- 3.2. Consumer Electronics
- 3.3. Healthcare
- 3.4. Industrial Manufacturing
- 3.5. Logistics and Travelling
- 3.6. Other End Users
-
4. Application
- 4.1. Smart Cities
- 4.2. Smart Homes/Buildings
- 4.3. Smart Agriculture
- 4.4. Other Applications
LPWAN Market Segmentation By Geography
- 1. North America
- 2. Europe
- 3. Asia
- 4. Australia and New Zealand
- 5. Latin America
- 6. Middle East and Africa
LPWAN Market REPORT HIGHLIGHTS
| Aspects | Details |
|---|---|
| Study Period | 2019-2033 |
| Base Year | 2024 |
| Estimated Year | 2025 |
| Forecast Period | 2025-2033 |
| Historical Period | 2019-2024 |
| Growth Rate | CAGR of 52.05% from 2019-2033 |
| Segmentation |
|
Table of Contents
- 1. Introduction
- 1.1. Research Scope
- 1.2. Market Segmentation
- 1.3. Research Methodology
- 1.4. Definitions and Assumptions
- 2. Executive Summary
- 2.1. Introduction
- 3. Market Dynamics
- 3.1. Introduction
- 3.2. Market Drivers
- 3.2.1. Rising Need of Long Range Connectivity Between Devices5.1.2 5G Technology to Drive the Market Growth
- 3.3. Market Restrains
- 3.3.1. Privacy and Security Concerns
- 3.4. Market Trends
- 3.4.1. 5G Technology to Drive the Market Growth
- 4. Market Factor Analysis
- 4.1. Porters Five Forces
- 4.2. Supply/Value Chain
- 4.3. PESTEL analysis
- 4.4. Market Entropy
- 4.5. Patent/Trademark Analysis
- 5. Global LPWAN Market Analysis, Insights and Forecast, 2019-2031
- 5.1. Market Analysis, Insights and Forecast - by Type
- 5.1.1. LoRaWAN
- 5.1.2. NB-IoT
- 5.1.3. LTE-M
- 5.1.4. Other Types (Sigfox, Weightless, etc.)
- 5.2. Market Analysis, Insights and Forecast - by Service
- 5.2.1. Professional Service
- 5.2.2. Managed Service
- 5.3. Market Analysis, Insights and Forecast - by End User
- 5.3.1. Oil and Gas
- 5.3.2. Consumer Electronics
- 5.3.3. Healthcare
- 5.3.4. Industrial Manufacturing
- 5.3.5. Logistics and Travelling
- 5.3.6. Other End Users
- 5.4. Market Analysis, Insights and Forecast - by Application
- 5.4.1. Smart Cities
- 5.4.2. Smart Homes/Buildings
- 5.4.3. Smart Agriculture
- 5.4.4. Other Applications
- 5.5. Market Analysis, Insights and Forecast - by Region
- 5.5.1. North America
- 5.5.2. Europe
- 5.5.3. Asia
- 5.5.4. Australia and New Zealand
- 5.5.5. Latin America
- 5.5.6. Middle East and Africa
- 5.1. Market Analysis, Insights and Forecast - by Type
- 6. North America LPWAN Market Analysis, Insights and Forecast, 2019-2031
- 6.1. Market Analysis, Insights and Forecast - by Type
- 6.1.1. LoRaWAN
- 6.1.2. NB-IoT
- 6.1.3. LTE-M
- 6.1.4. Other Types (Sigfox, Weightless, etc.)
- 6.2. Market Analysis, Insights and Forecast - by Service
- 6.2.1. Professional Service
- 6.2.2. Managed Service
- 6.3. Market Analysis, Insights and Forecast - by End User
- 6.3.1. Oil and Gas
- 6.3.2. Consumer Electronics
- 6.3.3. Healthcare
- 6.3.4. Industrial Manufacturing
- 6.3.5. Logistics and Travelling
- 6.3.6. Other End Users
- 6.4. Market Analysis, Insights and Forecast - by Application
- 6.4.1. Smart Cities
- 6.4.2. Smart Homes/Buildings
- 6.4.3. Smart Agriculture
- 6.4.4. Other Applications
- 6.1. Market Analysis, Insights and Forecast - by Type
- 7. Europe LPWAN Market Analysis, Insights and Forecast, 2019-2031
- 7.1. Market Analysis, Insights and Forecast - by Type
- 7.1.1. LoRaWAN
- 7.1.2. NB-IoT
- 7.1.3. LTE-M
- 7.1.4. Other Types (Sigfox, Weightless, etc.)
- 7.2. Market Analysis, Insights and Forecast - by Service
- 7.2.1. Professional Service
- 7.2.2. Managed Service
- 7.3. Market Analysis, Insights and Forecast - by End User
- 7.3.1. Oil and Gas
- 7.3.2. Consumer Electronics
- 7.3.3. Healthcare
- 7.3.4. Industrial Manufacturing
- 7.3.5. Logistics and Travelling
- 7.3.6. Other End Users
- 7.4. Market Analysis, Insights and Forecast - by Application
- 7.4.1. Smart Cities
- 7.4.2. Smart Homes/Buildings
- 7.4.3. Smart Agriculture
- 7.4.4. Other Applications
- 7.1. Market Analysis, Insights and Forecast - by Type
- 8. Asia LPWAN Market Analysis, Insights and Forecast, 2019-2031
- 8.1. Market Analysis, Insights and Forecast - by Type
- 8.1.1. LoRaWAN
- 8.1.2. NB-IoT
- 8.1.3. LTE-M
- 8.1.4. Other Types (Sigfox, Weightless, etc.)
- 8.2. Market Analysis, Insights and Forecast - by Service
- 8.2.1. Professional Service
- 8.2.2. Managed Service
- 8.3. Market Analysis, Insights and Forecast - by End User
- 8.3.1. Oil and Gas
- 8.3.2. Consumer Electronics
- 8.3.3. Healthcare
- 8.3.4. Industrial Manufacturing
- 8.3.5. Logistics and Travelling
- 8.3.6. Other End Users
- 8.4. Market Analysis, Insights and Forecast - by Application
- 8.4.1. Smart Cities
- 8.4.2. Smart Homes/Buildings
- 8.4.3. Smart Agriculture
- 8.4.4. Other Applications
- 8.1. Market Analysis, Insights and Forecast - by Type
- 9. Australia and New Zealand LPWAN Market Analysis, Insights and Forecast, 2019-2031
- 9.1. Market Analysis, Insights and Forecast - by Type
- 9.1.1. LoRaWAN
- 9.1.2. NB-IoT
- 9.1.3. LTE-M
- 9.1.4. Other Types (Sigfox, Weightless, etc.)
- 9.2. Market Analysis, Insights and Forecast - by Service
- 9.2.1. Professional Service
- 9.2.2. Managed Service
- 9.3. Market Analysis, Insights and Forecast - by End User
- 9.3.1. Oil and Gas
- 9.3.2. Consumer Electronics
- 9.3.3. Healthcare
- 9.3.4. Industrial Manufacturing
- 9.3.5. Logistics and Travelling
- 9.3.6. Other End Users
- 9.4. Market Analysis, Insights and Forecast - by Application
- 9.4.1. Smart Cities
- 9.4.2. Smart Homes/Buildings
- 9.4.3. Smart Agriculture
- 9.4.4. Other Applications
- 9.1. Market Analysis, Insights and Forecast - by Type
- 10. Latin America LPWAN Market Analysis, Insights and Forecast, 2019-2031
- 10.1. Market Analysis, Insights and Forecast - by Type
- 10.1.1. LoRaWAN
- 10.1.2. NB-IoT
- 10.1.3. LTE-M
- 10.1.4. Other Types (Sigfox, Weightless, etc.)
- 10.2. Market Analysis, Insights and Forecast - by Service
- 10.2.1. Professional Service
- 10.2.2. Managed Service
- 10.3. Market Analysis, Insights and Forecast - by End User
- 10.3.1. Oil and Gas
- 10.3.2. Consumer Electronics
- 10.3.3. Healthcare
- 10.3.4. Industrial Manufacturing
- 10.3.5. Logistics and Travelling
- 10.3.6. Other End Users
- 10.4. Market Analysis, Insights and Forecast - by Application
- 10.4.1. Smart Cities
- 10.4.2. Smart Homes/Buildings
- 10.4.3. Smart Agriculture
- 10.4.4. Other Applications
- 10.1. Market Analysis, Insights and Forecast - by Type
- 11. Middle East and Africa LPWAN Market Analysis, Insights and Forecast, 2019-2031
- 11.1. Market Analysis, Insights and Forecast - by Type
- 11.1.1. LoRaWAN
- 11.1.2. NB-IoT
- 11.1.3. LTE-M
- 11.1.4. Other Types (Sigfox, Weightless, etc.)
- 11.2. Market Analysis, Insights and Forecast - by Service
- 11.2.1. Professional Service
- 11.2.2. Managed Service
- 11.3. Market Analysis, Insights and Forecast - by End User
- 11.3.1. Oil and Gas
- 11.3.2. Consumer Electronics
- 11.3.3. Healthcare
- 11.3.4. Industrial Manufacturing
- 11.3.5. Logistics and Travelling
- 11.3.6. Other End Users
- 11.4. Market Analysis, Insights and Forecast - by Application
- 11.4.1. Smart Cities
- 11.4.2. Smart Homes/Buildings
- 11.4.3. Smart Agriculture
- 11.4.4. Other Applications
- 11.1. Market Analysis, Insights and Forecast - by Type
- 12. North America LPWAN Market Analysis, Insights and Forecast, 2019-2031
- 12.1. Market Analysis, Insights and Forecast - By Country/Sub-region
- 12.1.1.
- 13. Europe LPWAN Market Analysis, Insights and Forecast, 2019-2031
- 13.1. Market Analysis, Insights and Forecast - By Country/Sub-region
- 13.1.1.
- 14. Asia Pacific LPWAN Market Analysis, Insights and Forecast, 2019-2031
- 14.1. Market Analysis, Insights and Forecast - By Country/Sub-region
- 14.1.1.
- 15. Latin America LPWAN Market Analysis, Insights and Forecast, 2019-2031
- 15.1. Market Analysis, Insights and Forecast - By Country/Sub-region
- 15.1.1.
- 16. Middle East LPWAN Market Analysis, Insights and Forecast, 2019-2031
- 16.1. Market Analysis, Insights and Forecast - By Country/Sub-region
- 16.1.1.
- 17. Competitive Analysis
- 17.1. Global Market Share Analysis 2024
- 17.2. Company Profiles
- 17.2.1 Semtech Corporation
- 17.2.1.1. Overview
- 17.2.1.2. Products
- 17.2.1.3. SWOT Analysis
- 17.2.1.4. Recent Developments
- 17.2.1.5. Financials (Based on Availability)
- 17.2.2 Cisco Systems Inc
- 17.2.2.1. Overview
- 17.2.2.2. Products
- 17.2.2.3. SWOT Analysis
- 17.2.2.4. Recent Developments
- 17.2.2.5. Financials (Based on Availability)
- 17.2.3 Huawei Technologies Co Ltd
- 17.2.3.1. Overview
- 17.2.3.2. Products
- 17.2.3.3. SWOT Analysis
- 17.2.3.4. Recent Developments
- 17.2.3.5. Financials (Based on Availability)
- 17.2.4 Loriot AG*List Not Exhaustive
- 17.2.4.1. Overview
- 17.2.4.2. Products
- 17.2.4.3. SWOT Analysis
- 17.2.4.4. Recent Developments
- 17.2.4.5. Financials (Based on Availability)
- 17.2.5 AT&T Inc
- 17.2.5.1. Overview
- 17.2.5.2. Products
- 17.2.5.3. SWOT Analysis
- 17.2.5.4. Recent Developments
- 17.2.5.5. Financials (Based on Availability)
- 17.2.6 Sigfox SA
- 17.2.6.1. Overview
- 17.2.6.2. Products
- 17.2.6.3. SWOT Analysis
- 17.2.6.4. Recent Developments
- 17.2.6.5. Financials (Based on Availability)
- 17.2.7 Ingenu Inc
- 17.2.7.1. Overview
- 17.2.7.2. Products
- 17.2.7.3. SWOT Analysis
- 17.2.7.4. Recent Developments
- 17.2.7.5. Financials (Based on Availability)
- 17.2.8 Vodafone Group PLC
- 17.2.8.1. Overview
- 17.2.8.2. Products
- 17.2.8.3. SWOT Analysis
- 17.2.8.4. Recent Developments
- 17.2.8.5. Financials (Based on Availability)
- 17.2.1 Semtech Corporation
List of Figures
- Figure 1: Global LPWAN Market Revenue Breakdown (Million, %) by Region 2024 & 2032
- Figure 2: North America LPWAN Market Revenue (Million), by Country 2024 & 2032
- Figure 3: North America LPWAN Market Revenue Share (%), by Country 2024 & 2032
- Figure 4: Europe LPWAN Market Revenue (Million), by Country 2024 & 2032
- Figure 5: Europe LPWAN Market Revenue Share (%), by Country 2024 & 2032
- Figure 6: Asia Pacific LPWAN Market Revenue (Million), by Country 2024 & 2032
- Figure 7: Asia Pacific LPWAN Market Revenue Share (%), by Country 2024 & 2032
- Figure 8: Latin America LPWAN Market Revenue (Million), by Country 2024 & 2032
- Figure 9: Latin America LPWAN Market Revenue Share (%), by Country 2024 & 2032
- Figure 10: Middle East LPWAN Market Revenue (Million), by Country 2024 & 2032
- Figure 11: Middle East LPWAN Market Revenue Share (%), by Country 2024 & 2032
- Figure 12: North America LPWAN Market Revenue (Million), by Type 2024 & 2032
- Figure 13: North America LPWAN Market Revenue Share (%), by Type 2024 & 2032
- Figure 14: North America LPWAN Market Revenue (Million), by Service 2024 & 2032
- Figure 15: North America LPWAN Market Revenue Share (%), by Service 2024 & 2032
- Figure 16: North America LPWAN Market Revenue (Million), by End User 2024 & 2032
- Figure 17: North America LPWAN Market Revenue Share (%), by End User 2024 & 2032
- Figure 18: North America LPWAN Market Revenue (Million), by Application 2024 & 2032
- Figure 19: North America LPWAN Market Revenue Share (%), by Application 2024 & 2032
- Figure 20: North America LPWAN Market Revenue (Million), by Country 2024 & 2032
- Figure 21: North America LPWAN Market Revenue Share (%), by Country 2024 & 2032
- Figure 22: Europe LPWAN Market Revenue (Million), by Type 2024 & 2032
- Figure 23: Europe LPWAN Market Revenue Share (%), by Type 2024 & 2032
- Figure 24: Europe LPWAN Market Revenue (Million), by Service 2024 & 2032
- Figure 25: Europe LPWAN Market Revenue Share (%), by Service 2024 & 2032
- Figure 26: Europe LPWAN Market Revenue (Million), by End User 2024 & 2032
- Figure 27: Europe LPWAN Market Revenue Share (%), by End User 2024 & 2032
- Figure 28: Europe LPWAN Market Revenue (Million), by Application 2024 & 2032
- Figure 29: Europe LPWAN Market Revenue Share (%), by Application 2024 & 2032
- Figure 30: Europe LPWAN Market Revenue (Million), by Country 2024 & 2032
- Figure 31: Europe LPWAN Market Revenue Share (%), by Country 2024 & 2032
- Figure 32: Asia LPWAN Market Revenue (Million), by Type 2024 & 2032
- Figure 33: Asia LPWAN Market Revenue Share (%), by Type 2024 & 2032
- Figure 34: Asia LPWAN Market Revenue (Million), by Service 2024 & 2032
- Figure 35: Asia LPWAN Market Revenue Share (%), by Service 2024 & 2032
- Figure 36: Asia LPWAN Market Revenue (Million), by End User 2024 & 2032
- Figure 37: Asia LPWAN Market Revenue Share (%), by End User 2024 & 2032
- Figure 38: Asia LPWAN Market Revenue (Million), by Application 2024 & 2032
- Figure 39: Asia LPWAN Market Revenue Share (%), by Application 2024 & 2032
- Figure 40: Asia LPWAN Market Revenue (Million), by Country 2024 & 2032
- Figure 41: Asia LPWAN Market Revenue Share (%), by Country 2024 & 2032
- Figure 42: Australia and New Zealand LPWAN Market Revenue (Million), by Type 2024 & 2032
- Figure 43: Australia and New Zealand LPWAN Market Revenue Share (%), by Type 2024 & 2032
- Figure 44: Australia and New Zealand LPWAN Market Revenue (Million), by Service 2024 & 2032
- Figure 45: Australia and New Zealand LPWAN Market Revenue Share (%), by Service 2024 & 2032
- Figure 46: Australia and New Zealand LPWAN Market Revenue (Million), by End User 2024 & 2032
- Figure 47: Australia and New Zealand LPWAN Market Revenue Share (%), by End User 2024 & 2032
- Figure 48: Australia and New Zealand LPWAN Market Revenue (Million), by Application 2024 & 2032
- Figure 49: Australia and New Zealand LPWAN Market Revenue Share (%), by Application 2024 & 2032
- Figure 50: Australia and New Zealand LPWAN Market Revenue (Million), by Country 2024 & 2032
- Figure 51: Australia and New Zealand LPWAN Market Revenue Share (%), by Country 2024 & 2032
- Figure 52: Latin America LPWAN Market Revenue (Million), by Type 2024 & 2032
- Figure 53: Latin America LPWAN Market Revenue Share (%), by Type 2024 & 2032
- Figure 54: Latin America LPWAN Market Revenue (Million), by Service 2024 & 2032
- Figure 55: Latin America LPWAN Market Revenue Share (%), by Service 2024 & 2032
- Figure 56: Latin America LPWAN Market Revenue (Million), by End User 2024 & 2032
- Figure 57: Latin America LPWAN Market Revenue Share (%), by End User 2024 & 2032
- Figure 58: Latin America LPWAN Market Revenue (Million), by Application 2024 & 2032
- Figure 59: Latin America LPWAN Market Revenue Share (%), by Application 2024 & 2032
- Figure 60: Latin America LPWAN Market Revenue (Million), by Country 2024 & 2032
- Figure 61: Latin America LPWAN Market Revenue Share (%), by Country 2024 & 2032
- Figure 62: Middle East and Africa LPWAN Market Revenue (Million), by Type 2024 & 2032
- Figure 63: Middle East and Africa LPWAN Market Revenue Share (%), by Type 2024 & 2032
- Figure 64: Middle East and Africa LPWAN Market Revenue (Million), by Service 2024 & 2032
- Figure 65: Middle East and Africa LPWAN Market Revenue Share (%), by Service 2024 & 2032
- Figure 66: Middle East and Africa LPWAN Market Revenue (Million), by End User 2024 & 2032
- Figure 67: Middle East and Africa LPWAN Market Revenue Share (%), by End User 2024 & 2032
- Figure 68: Middle East and Africa LPWAN Market Revenue (Million), by Application 2024 & 2032
- Figure 69: Middle East and Africa LPWAN Market Revenue Share (%), by Application 2024 & 2032
- Figure 70: Middle East and Africa LPWAN Market Revenue (Million), by Country 2024 & 2032
- Figure 71: Middle East and Africa LPWAN Market Revenue Share (%), by Country 2024 & 2032
List of Tables
- Table 1: Global LPWAN Market Revenue Million Forecast, by Region 2019 & 2032
- Table 2: Global LPWAN Market Revenue Million Forecast, by Type 2019 & 2032
- Table 3: Global LPWAN Market Revenue Million Forecast, by Service 2019 & 2032
- Table 4: Global LPWAN Market Revenue Million Forecast, by End User 2019 & 2032
- Table 5: Global LPWAN Market Revenue Million Forecast, by Application 2019 & 2032
- Table 6: Global LPWAN Market Revenue Million Forecast, by Region 2019 & 2032
- Table 7: Global LPWAN Market Revenue Million Forecast, by Country 2019 & 2032
- Table 8: LPWAN Market Revenue (Million) Forecast, by Application 2019 & 2032
- Table 9: Global LPWAN Market Revenue Million Forecast, by Country 2019 & 2032
- Table 10: LPWAN Market Revenue (Million) Forecast, by Application 2019 & 2032
- Table 11: Global LPWAN Market Revenue Million Forecast, by Country 2019 & 2032
- Table 12: LPWAN Market Revenue (Million) Forecast, by Application 2019 & 2032
- Table 13: Global LPWAN Market Revenue Million Forecast, by Country 2019 & 2032
- Table 14: LPWAN Market Revenue (Million) Forecast, by Application 2019 & 2032
- Table 15: Global LPWAN Market Revenue Million Forecast, by Country 2019 & 2032
- Table 16: LPWAN Market Revenue (Million) Forecast, by Application 2019 & 2032
- Table 17: Global LPWAN Market Revenue Million Forecast, by Type 2019 & 2032
- Table 18: Global LPWAN Market Revenue Million Forecast, by Service 2019 & 2032
- Table 19: Global LPWAN Market Revenue Million Forecast, by End User 2019 & 2032
- Table 20: Global LPWAN Market Revenue Million Forecast, by Application 2019 & 2032
- Table 21: Global LPWAN Market Revenue Million Forecast, by Country 2019 & 2032
- Table 22: Global LPWAN Market Revenue Million Forecast, by Type 2019 & 2032
- Table 23: Global LPWAN Market Revenue Million Forecast, by Service 2019 & 2032
- Table 24: Global LPWAN Market Revenue Million Forecast, by End User 2019 & 2032
- Table 25: Global LPWAN Market Revenue Million Forecast, by Application 2019 & 2032
- Table 26: Global LPWAN Market Revenue Million Forecast, by Country 2019 & 2032
- Table 27: Global LPWAN Market Revenue Million Forecast, by Type 2019 & 2032
- Table 28: Global LPWAN Market Revenue Million Forecast, by Service 2019 & 2032
- Table 29: Global LPWAN Market Revenue Million Forecast, by End User 2019 & 2032
- Table 30: Global LPWAN Market Revenue Million Forecast, by Application 2019 & 2032
- Table 31: Global LPWAN Market Revenue Million Forecast, by Country 2019 & 2032
- Table 32: Global LPWAN Market Revenue Million Forecast, by Type 2019 & 2032
- Table 33: Global LPWAN Market Revenue Million Forecast, by Service 2019 & 2032
- Table 34: Global LPWAN Market Revenue Million Forecast, by End User 2019 & 2032
- Table 35: Global LPWAN Market Revenue Million Forecast, by Application 2019 & 2032
- Table 36: Global LPWAN Market Revenue Million Forecast, by Country 2019 & 2032
- Table 37: Global LPWAN Market Revenue Million Forecast, by Type 2019 & 2032
- Table 38: Global LPWAN Market Revenue Million Forecast, by Service 2019 & 2032
- Table 39: Global LPWAN Market Revenue Million Forecast, by End User 2019 & 2032
- Table 40: Global LPWAN Market Revenue Million Forecast, by Application 2019 & 2032
- Table 41: Global LPWAN Market Revenue Million Forecast, by Country 2019 & 2032
- Table 42: Global LPWAN Market Revenue Million Forecast, by Type 2019 & 2032
- Table 43: Global LPWAN Market Revenue Million Forecast, by Service 2019 & 2032
- Table 44: Global LPWAN Market Revenue Million Forecast, by End User 2019 & 2032
- Table 45: Global LPWAN Market Revenue Million Forecast, by Application 2019 & 2032
- Table 46: Global LPWAN Market Revenue Million Forecast, by Country 2019 & 2032
Frequently Asked Questions
1. What is the projected Compound Annual Growth Rate (CAGR) of the LPWAN Market?
The projected CAGR is approximately 52.05%.
2. Which companies are prominent players in the LPWAN Market?
Key companies in the market include Semtech Corporation, Cisco Systems Inc, Huawei Technologies Co Ltd, Loriot AG*List Not Exhaustive, AT&T Inc, Sigfox SA, Ingenu Inc, Vodafone Group PLC.
3. What are the main segments of the LPWAN Market?
The market segments include Type, Service, End User, Application.
4. Can you provide details about the market size?
The market size is estimated to be USD 32.01 Million as of 2022.
5. What are some drivers contributing to market growth?
Rising Need of Long Range Connectivity Between Devices5.1.2 5G Technology to Drive the Market Growth.
6. What are the notable trends driving market growth?
5G Technology to Drive the Market Growth.
7. Are there any restraints impacting market growth?
Privacy and Security Concerns.
8. Can you provide examples of recent developments in the market?
April 2023: Semtech Corporation announced the expansion of its PerSe product portfolio with a brand-new integrated circuit (IC) that is intended for 5G mobile devices is being released. With the aid of Semtech's PerSe technology, advanced radio frequency (RF) control may be implemented on end devices like smartphones. Designers may optimize RF performance, improve connectivity, and ensure higher compliance with worldwide specific absorption rate (SAR) criteria for 5G-enabled consumer products with the PerSe connects SX9376.
9. What pricing options are available for accessing the report?
Pricing options include single-user, multi-user, and enterprise licenses priced at USD 4750, USD 5250, and USD 8750 respectively.
10. Is the market size provided in terms of value or volume?
The market size is provided in terms of value, measured in Million.
11. Are there any specific market keywords associated with the report?
Yes, the market keyword associated with the report is "LPWAN Market," which aids in identifying and referencing the specific market segment covered.
12. How do I determine which pricing option suits my needs best?
The pricing options vary based on user requirements and access needs. Individual users may opt for single-user licenses, while businesses requiring broader access may choose multi-user or enterprise licenses for cost-effective access to the report.
13. Are there any additional resources or data provided in the LPWAN Market report?
While the report offers comprehensive insights, it's advisable to review the specific contents or supplementary materials provided to ascertain if additional resources or data are available.
14. How can I stay updated on further developments or reports in the LPWAN Market?
To stay informed about further developments, trends, and reports in the LPWAN Market, consider subscribing to industry newsletters, following relevant companies and organizations, or regularly checking reputable industry news sources and publications.
Methodology
Step 1 - Identification of Relevant Samples Size from Population Database


Step 2 - Approaches for Defining Global Market Size (Value, Volume* & Price*)

Note*: In applicable scenarios
Step 3 - Data Sources
Primary Research
- Web Analytics
- Survey Reports
- Research Institute
- Latest Research Reports
- Opinion Leaders
Secondary Research
- Annual Reports
- White Paper
- Latest Press Release
- Industry Association
- Paid Database
- Investor Presentations

Step 4 - Data Triangulation
Involves using different sources of information in order to increase the validity of a study
These sources are likely to be stakeholders in a program - participants, other researchers, program staff, other community members, and so on.
Then we put all data in single framework & apply various statistical tools to find out the dynamic on the market.
During the analysis stage, feedback from the stakeholder groups would be compared to determine areas of agreement as well as areas of divergence
