

Key Insights
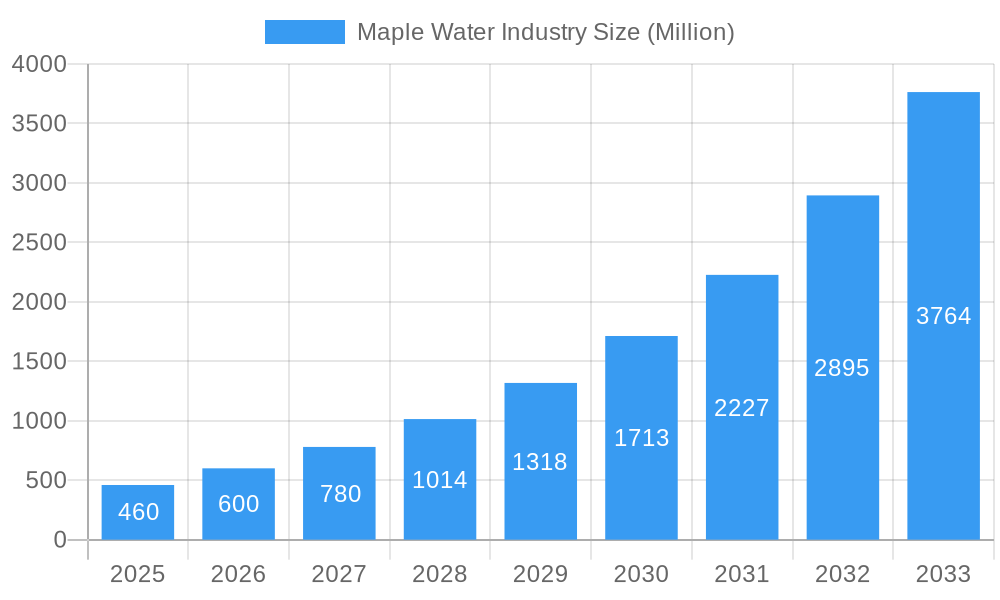
The global maple water market, currently valued at $460 million (2025), is experiencing robust growth, projected to expand at a compound annual growth rate (CAGR) of 30.75% from 2025 to 2033. This significant expansion is driven by several key factors. Increasing consumer awareness of healthier beverage alternatives fuels demand for naturally sweet, low-calorie options like maple water. The rising popularity of functional beverages, emphasizing nutritional benefits beyond simple hydration, further strengthens market appeal. Furthermore, innovative packaging solutions, such as convenient bottles and cartons, cater to diverse consumer preferences and lifestyles, contributing to market growth. The market is segmented by product type (flavored and unflavored), packaging type (bottles, cartons/tetra paks, and others), and distribution channels (supermarkets/hypermarkets, convenience stores, specialty stores, online retailers, and others). North America, particularly the United States and Canada, currently holds the largest market share due to strong domestic production and high consumer adoption. However, Asia-Pacific and European markets are expected to witness substantial growth driven by increasing disposable incomes and changing consumer preferences toward healthier beverages. Competition is intensifying with both established players and emerging brands focusing on product innovation, expanding distribution networks, and targeted marketing campaigns.
Maple Water Industry Market Size (In Million)
The restraining factors influencing market growth are primarily related to limited consumer awareness in certain regions and potential challenges in maintaining consistent supply to meet growing demand. The price point of maple water compared to other beverages might also be a barrier for some consumers. However, these challenges are likely to be offset by the ongoing trend toward healthier and functional beverages, the increasing availability of maple water in diverse retail channels, and the continued efforts of key players to establish brand loyalty and expand market reach. The forecast period anticipates substantial growth across all regions, fueled by rising consumer health consciousness, increased product availability, and effective marketing strategies promoting the unique nutritional benefits of maple water. This will likely lead to new entrants and innovative product variations within the market.
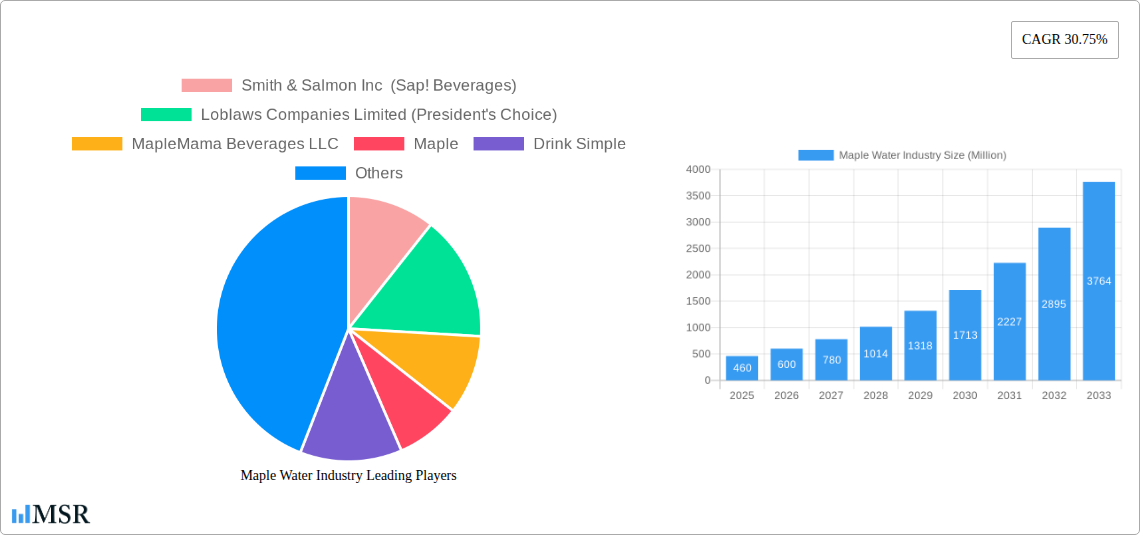
Maple Water Industry Company Market Share
Maple Water Industry: A Comprehensive Market Report (2019-2033)
This comprehensive report provides a detailed analysis of the global maple water industry, encompassing market size, growth drivers, competitive landscape, and future outlook. The study period covers 2019-2033, with a base year of 2025 and a forecast period of 2025-2033. The report offers actionable insights for industry stakeholders, including manufacturers, distributors, investors, and market entrants, helping them navigate the dynamic maple water market and capitalize on emerging opportunities. The global market is projected to reach $XX Million by 2033, showcasing substantial growth potential.
Maple Water Industry Market Concentration & Dynamics
The global maple water market exhibits a moderately concentrated structure, with several key players vying for market share. While precise market share data for individual companies remains proprietary, leading brands like Smith & Salmon Inc (Sap! Beverages), Loblaws Companies Limited (President's Choice), MapleMama Beverages LLC, Maple, Drink Simple, Lower Valley Beverage Co (sapsucker), Kiki Maple Water, Feronia Forests LLC (Vertical Water), Pure Maple Water Company Ltd, and Asarasi hold significant positions. The industry is witnessing increased innovation in product offerings, packaging, and distribution channels.
- Market Concentration: Moderately concentrated, with a few dominant players and a growing number of smaller entrants.
- Innovation Ecosystem: Active, with ongoing research and development in flavor profiles, packaging materials, and sustainable sourcing practices.
- Regulatory Frameworks: Vary by region, impacting labeling requirements, health claims, and sustainability certifications.
- Substitute Products: Coconut water, other fruit juices, and sports drinks represent key substitutes.
- End-User Trends: Growing consumer demand for healthier beverages, natural ingredients, and functional benefits drives market growth.
- M&A Activities: An estimated xx M&A deals occurred during the historical period (2019-2024), indicating consolidation and strategic expansion within the industry. The forecast period is expected to see xx more deals.
Maple Water Industry Insights & Trends
The maple water market is experiencing robust growth, driven by several key factors. The global market size was valued at $XX Million in 2025 and is projected to reach $XX Million by 2033, exhibiting a CAGR of xx%. This growth is fueled by increasing consumer awareness of the health benefits of maple water, its natural sweetness, and its versatility as a functional beverage. Technological advancements in production and packaging contribute to efficiency and sustainability.
- Market Growth Drivers: Rising health consciousness, preference for natural sweeteners, increasing disposable incomes in key markets, and expanding distribution channels.
- Technological Disruptions: Automation in production, innovative packaging solutions (e.g., sustainable materials), and advancements in flavor development.
- Evolving Consumer Behaviors: A growing preference for healthier and natural alternatives to sugary drinks, coupled with a focus on sustainable and ethically sourced products.
Key Markets & Segments Leading Maple Water Industry
The North American market currently dominates the maple water industry, with significant contributions from the US and Canada. However, growth is anticipated in Europe and Asia-Pacific regions due to rising health awareness. Within the product segments:
- Dominant Region: North America
- Dominant Product Type: Unflavored maple water maintains a larger market share compared to flavored options.
- Dominant Packaging Type: Bottles remain the primary packaging choice, although cartons/Tetra Pak are gaining traction due to sustainability considerations.
- Dominant Distribution Channel: Supermarkets/hypermarkets hold the largest market share, followed by convenience stores and online retail channels.
Drivers for Growth in Key Segments:
- Economic Growth: Rising disposable incomes in developed and developing economies.
- Improved Infrastructure: Enhanced cold chain logistics and distribution networks.
- Health Awareness Campaigns: Public health initiatives promoting healthier beverage choices.
Maple Water Industry Product Developments
Recent product innovations include new flavor varieties (e.g., infused with fruits, herbs, or spices), organic and fair-trade certified maple water, and convenient packaging formats like single-serve bottles and pouches. These developments aim to cater to diverse consumer preferences and enhance the product's appeal. Technological advancements focus on improving extraction methods to maintain the natural qualities of maple water and minimizing environmental impact.
Challenges in the Maple Water Industry Market
The maple water industry faces several challenges, including:
- Seasonality of Maple Sap: The limited availability of maple sap during the tapping season impacts production capacity and year-round supply. This constraint is estimated to impact annual production by $XX million.
- High Production Costs: The labor-intensive process of maple sap harvesting and processing contributes to relatively higher production costs compared to other beverages.
- Competition: Competition from other functional beverages and the entry of new players is intensifying.
Forces Driving Maple Water Industry Growth
Technological advancements in extraction and processing, combined with growing consumer demand for healthy and natural beverages, are key drivers of market expansion. Government support for sustainable agriculture practices and favorable regulations also contribute to industry growth. The increased availability of maple water through diverse distribution channels furthers market penetration.
Long-Term Growth Catalysts in the Maple Water Industry
Long-term growth will be driven by strategic partnerships, expansions into new geographical markets (e.g., Asia), and the development of innovative product applications (e.g., use in food and beverages). Furthermore, sustainability initiatives and investments in research and development will contribute to market expansion.
Emerging Opportunities in Maple Water Industry
Emerging opportunities exist in developing functional maple water blends with added ingredients (e.g., probiotics, antioxidants), expanding into new market segments (e.g., sports nutrition), and utilizing innovative packaging materials (e.g., biodegradable plastics). Exploring new distribution channels (e.g., subscription boxes) also offers potential.
Leading Players in the Maple Water Industry Sector
- Smith & Salmon Inc (Sap! Beverages)
- Loblaws Companies Limited (President's Choice)
- MapleMama Beverages LLC
- Maple
- Drink Simple
- Lower Valley Beverage Co (sapsucker)
- Kiki Maple Water
- Feronia Forests LLC (Vertical Water)
- Pure Maple Water Company Ltd
- Asarasi
Key Milestones in Maple Water Industry Industry
- 2020: Increased consumer interest in plant-based beverages fuels market growth.
- 2022: Several new entrants launch innovative maple water products.
- 2023: Major retailers expand their maple water offerings.
- 2024: Focus increases on sustainable sourcing and ethical production practices.
Strategic Outlook for Maple Water Industry Market
The maple water market exhibits significant future potential, driven by continued consumer demand, product diversification, and strategic partnerships. Expanding into new markets, leveraging technological advancements, and focusing on sustainable practices will be vital for sustained growth and success in the industry.
Maple Water Industry Segmentation
-
1. Product Type
- 1.1. Flavored
- 1.2. Unflavored
-
2. Packaging Type
- 2.1. Bottles
- 2.2. Cartons/Tetra Pak
- 2.3. Other Packaging Types
-
3. Distribution Channel
- 3.1. Supermarkets/Hypermarkets
- 3.2. Convenience Stores
- 3.3. Specialty Stores
- 3.4. Online Retail Stores
- 3.5. Other Distribution Channels
Maple Water Industry Segmentation By Geography
-
1. North America
- 1.1. United States
- 1.2. Canada
- 1.3. Mexico
- 1.4. Rest of North America
-
2. Europe
- 2.1. Germany
- 2.2. United Kingdom
- 2.3. France
- 2.4. Italy
- 2.5. Spain
- 2.6. Rest of Europe
-
3. Asia Pacific
- 3.1. China
- 3.2. India
- 3.3. Australia
- 3.4. Japan
-
4. Rest of the World
- 4.1. South America
- 4.2. Middle East and Africa
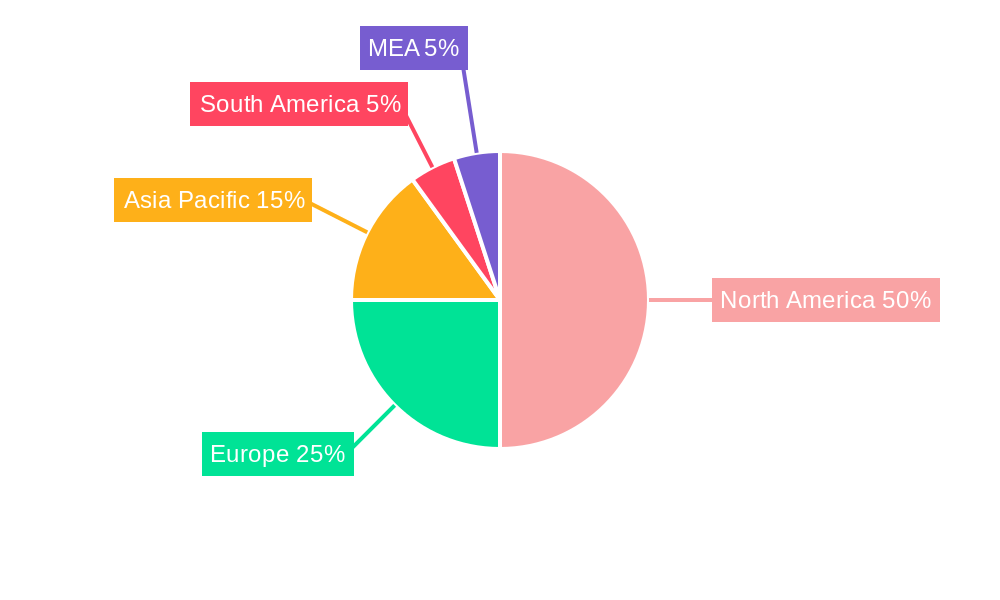
Maple Water Industry Regional Market Share
Geographic Coverage of Maple Water Industry
Maple Water Industry REPORT HIGHLIGHTS
| Aspects | Details |
|---|---|
| Study Period | 2020-2034 |
| Base Year | 2025 |
| Estimated Year | 2026 |
| Forecast Period | 2026-2034 |
| Historical Period | 2020-2025 |
| Growth Rate | CAGR of 30.75% from 2020-2034 |
| Segmentation |
|
Table of Contents
- 1. Introduction
- 1.1. Research Scope
- 1.2. Market Segmentation
- 1.3. Research Objective
- 1.4. Definitions and Assumptions
- 2. Executive Summary
- 2.1. Market Snapshot
- 3. Market Dynamics
- 3.1. Market Drivers
- 3.2. Market Restrains
- 3.3. Market Trends
- 3.4. Market Opportunities
- 4. Market Factor Analysis
- 4.1. Porters Five Forces
- 4.1.1. Bargaining Power of Suppliers
- 4.1.2. Bargaining Power of Buyers
- 4.1.3. Threat of New Entrants
- 4.1.4. Threat of Substitutes
- 4.1.5. Competitive Rivalry
- 4.2. PESTEL analysis
- 4.3. BCG Analysis
- 4.3.1. Stars (High Growth, High Market Share)
- 4.3.2. Cash Cows (Low Growth, High Market Share)
- 4.3.3. Question Mark (High Growth, Low Market Share)
- 4.3.4. Dogs (Low Growth, Low Market Share)
- 4.4. Ansoff Matrix Analysis
- 4.5. Supply Chain Analysis
- 4.6. Regulatory Landscape
- 4.7. Current Market Potential and Opportunity Assessment (TAM–SAM–SOM Framework)
- 4.8. MSR Analyst Note
- 4.1. Porters Five Forces
- 5. Market Analysis, Insights and Forecast 2021-2033
- 5.1. Market Analysis, Insights and Forecast - by Product Type
- 5.1.1. Flavored
- 5.1.2. Unflavored
- 5.2. Market Analysis, Insights and Forecast - by Packaging Type
- 5.2.1. Bottles
- 5.2.2. Cartons/Tetra Pak
- 5.2.3. Other Packaging Types
- 5.3. Market Analysis, Insights and Forecast - by Distribution Channel
- 5.3.1. Supermarkets/Hypermarkets
- 5.3.2. Convenience Stores
- 5.3.3. Specialty Stores
- 5.3.4. Online Retail Stores
- 5.3.5. Other Distribution Channels
- 5.4. Market Analysis, Insights and Forecast - by Region
- 5.4.1. North America
- 5.4.2. Europe
- 5.4.3. Asia Pacific
- 5.4.4. Rest of the World
- 5.1. Market Analysis, Insights and Forecast - by Product Type
- 6. Global Maple Water Industry Analysis, Insights and Forecast, 2021-2033
- 6.1. Market Analysis, Insights and Forecast - by Product Type
- 6.1.1. Flavored
- 6.1.2. Unflavored
- 6.2. Market Analysis, Insights and Forecast - by Packaging Type
- 6.2.1. Bottles
- 6.2.2. Cartons/Tetra Pak
- 6.2.3. Other Packaging Types
- 6.3. Market Analysis, Insights and Forecast - by Distribution Channel
- 6.3.1. Supermarkets/Hypermarkets
- 6.3.2. Convenience Stores
- 6.3.3. Specialty Stores
- 6.3.4. Online Retail Stores
- 6.3.5. Other Distribution Channels
- 6.1. Market Analysis, Insights and Forecast - by Product Type
- 7. North America Maple Water Industry Analysis, Insights and Forecast, 2020-2032
- 7.1. Market Analysis, Insights and Forecast - by Product Type
- 7.1.1. Flavored
- 7.1.2. Unflavored
- 7.2. Market Analysis, Insights and Forecast - by Packaging Type
- 7.2.1. Bottles
- 7.2.2. Cartons/Tetra Pak
- 7.2.3. Other Packaging Types
- 7.3. Market Analysis, Insights and Forecast - by Distribution Channel
- 7.3.1. Supermarkets/Hypermarkets
- 7.3.2. Convenience Stores
- 7.3.3. Specialty Stores
- 7.3.4. Online Retail Stores
- 7.3.5. Other Distribution Channels
- 7.1. Market Analysis, Insights and Forecast - by Product Type
- 8. Europe Maple Water Industry Analysis, Insights and Forecast, 2020-2032
- 8.1. Market Analysis, Insights and Forecast - by Product Type
- 8.1.1. Flavored
- 8.1.2. Unflavored
- 8.2. Market Analysis, Insights and Forecast - by Packaging Type
- 8.2.1. Bottles
- 8.2.2. Cartons/Tetra Pak
- 8.2.3. Other Packaging Types
- 8.3. Market Analysis, Insights and Forecast - by Distribution Channel
- 8.3.1. Supermarkets/Hypermarkets
- 8.3.2. Convenience Stores
- 8.3.3. Specialty Stores
- 8.3.4. Online Retail Stores
- 8.3.5. Other Distribution Channels
- 8.1. Market Analysis, Insights and Forecast - by Product Type
- 9. Asia Pacific Maple Water Industry Analysis, Insights and Forecast, 2020-2032
- 9.1. Market Analysis, Insights and Forecast - by Product Type
- 9.1.1. Flavored
- 9.1.2. Unflavored
- 9.2. Market Analysis, Insights and Forecast - by Packaging Type
- 9.2.1. Bottles
- 9.2.2. Cartons/Tetra Pak
- 9.2.3. Other Packaging Types
- 9.3. Market Analysis, Insights and Forecast - by Distribution Channel
- 9.3.1. Supermarkets/Hypermarkets
- 9.3.2. Convenience Stores
- 9.3.3. Specialty Stores
- 9.3.4. Online Retail Stores
- 9.3.5. Other Distribution Channels
- 9.1. Market Analysis, Insights and Forecast - by Product Type
- 10. Rest of the World Maple Water Industry Analysis, Insights and Forecast, 2020-2032
- 10.1. Market Analysis, Insights and Forecast - by Product Type
- 10.1.1. Flavored
- 10.1.2. Unflavored
- 10.2. Market Analysis, Insights and Forecast - by Packaging Type
- 10.2.1. Bottles
- 10.2.2. Cartons/Tetra Pak
- 10.2.3. Other Packaging Types
- 10.3. Market Analysis, Insights and Forecast - by Distribution Channel
- 10.3.1. Supermarkets/Hypermarkets
- 10.3.2. Convenience Stores
- 10.3.3. Specialty Stores
- 10.3.4. Online Retail Stores
- 10.3.5. Other Distribution Channels
- 10.1. Market Analysis, Insights and Forecast - by Product Type
- 11. Competitive Analysis
- 11.1. Company Profiles
- 11.1.1 Smith & Salmon Inc (Sap! Beverages)
- 11.1.1.1. Company Overview
- 11.1.1.2. Products
- 11.1.1.3. Company Financials
- 11.1.1.4. SWOT Analysis
- 11.1.2 Loblaws Companies Limited (President's Choice)
- 11.1.2.1. Company Overview
- 11.1.2.2. Products
- 11.1.2.3. Company Financials
- 11.1.2.4. SWOT Analysis
- 11.1.3 MapleMama Beverages LLC
- 11.1.3.1. Company Overview
- 11.1.3.2. Products
- 11.1.3.3. Company Financials
- 11.1.3.4. SWOT Analysis
- 11.1.4 Maple
- 11.1.4.1. Company Overview
- 11.1.4.2. Products
- 11.1.4.3. Company Financials
- 11.1.4.4. SWOT Analysis
- 11.1.5 Drink Simple
- 11.1.5.1. Company Overview
- 11.1.5.2. Products
- 11.1.5.3. Company Financials
- 11.1.5.4. SWOT Analysis
- 11.1.6 Lower Valley Beverage Co(sapsucker)*List Not Exhaustive
- 11.1.6.1. Company Overview
- 11.1.6.2. Products
- 11.1.6.3. Company Financials
- 11.1.6.4. SWOT Analysis
- 11.1.7 Kiki Maple Water
- 11.1.7.1. Company Overview
- 11.1.7.2. Products
- 11.1.7.3. Company Financials
- 11.1.7.4. SWOT Analysis
- 11.1.8 Feronia Forests LLC (Vertical Water)
- 11.1.8.1. Company Overview
- 11.1.8.2. Products
- 11.1.8.3. Company Financials
- 11.1.8.4. SWOT Analysis
- 11.1.9 Pure Maple Water Company Ltd
- 11.1.9.1. Company Overview
- 11.1.9.2. Products
- 11.1.9.3. Company Financials
- 11.1.9.4. SWOT Analysis
- 11.1.10 Asarasi
- 11.1.10.1. Company Overview
- 11.1.10.2. Products
- 11.1.10.3. Company Financials
- 11.1.10.4. SWOT Analysis
- 11.1.1 Smith & Salmon Inc (Sap! Beverages)
- 11.2. Market Entropy
- 11.2.1 Company's Key Areas Served
- 11.2.2 Recent Developments
- 11.3. Company Market Share Analysis 2025
- 11.3.1 Top 5 Companies Market Share Analysis
- 11.3.2 Top 3 Companies Market Share Analysis
- 11.4. List of Potential Customers
- 12. Research Methodology
List of Figures
- Figure 1: Global Maple Water Industry Revenue Breakdown (Million, %) by Region 2025 & 2033
- Figure 2: North America Maple Water Industry Revenue (Million), by Product Type 2025 & 2033
- Figure 3: North America Maple Water Industry Revenue Share (%), by Product Type 2025 & 2033
- Figure 4: North America Maple Water Industry Revenue (Million), by Packaging Type 2025 & 2033
- Figure 5: North America Maple Water Industry Revenue Share (%), by Packaging Type 2025 & 2033
- Figure 6: North America Maple Water Industry Revenue (Million), by Distribution Channel 2025 & 2033
- Figure 7: North America Maple Water Industry Revenue Share (%), by Distribution Channel 2025 & 2033
- Figure 8: North America Maple Water Industry Revenue (Million), by Country 2025 & 2033
- Figure 9: North America Maple Water Industry Revenue Share (%), by Country 2025 & 2033
- Figure 10: Europe Maple Water Industry Revenue (Million), by Product Type 2025 & 2033
- Figure 11: Europe Maple Water Industry Revenue Share (%), by Product Type 2025 & 2033
- Figure 12: Europe Maple Water Industry Revenue (Million), by Packaging Type 2025 & 2033
- Figure 13: Europe Maple Water Industry Revenue Share (%), by Packaging Type 2025 & 2033
- Figure 14: Europe Maple Water Industry Revenue (Million), by Distribution Channel 2025 & 2033
- Figure 15: Europe Maple Water Industry Revenue Share (%), by Distribution Channel 2025 & 2033
- Figure 16: Europe Maple Water Industry Revenue (Million), by Country 2025 & 2033
- Figure 17: Europe Maple Water Industry Revenue Share (%), by Country 2025 & 2033
- Figure 18: Asia Pacific Maple Water Industry Revenue (Million), by Product Type 2025 & 2033
- Figure 19: Asia Pacific Maple Water Industry Revenue Share (%), by Product Type 2025 & 2033
- Figure 20: Asia Pacific Maple Water Industry Revenue (Million), by Packaging Type 2025 & 2033
- Figure 21: Asia Pacific Maple Water Industry Revenue Share (%), by Packaging Type 2025 & 2033
- Figure 22: Asia Pacific Maple Water Industry Revenue (Million), by Distribution Channel 2025 & 2033
- Figure 23: Asia Pacific Maple Water Industry Revenue Share (%), by Distribution Channel 2025 & 2033
- Figure 24: Asia Pacific Maple Water Industry Revenue (Million), by Country 2025 & 2033
- Figure 25: Asia Pacific Maple Water Industry Revenue Share (%), by Country 2025 & 2033
- Figure 26: Rest of the World Maple Water Industry Revenue (Million), by Product Type 2025 & 2033
- Figure 27: Rest of the World Maple Water Industry Revenue Share (%), by Product Type 2025 & 2033
- Figure 28: Rest of the World Maple Water Industry Revenue (Million), by Packaging Type 2025 & 2033
- Figure 29: Rest of the World Maple Water Industry Revenue Share (%), by Packaging Type 2025 & 2033
- Figure 30: Rest of the World Maple Water Industry Revenue (Million), by Distribution Channel 2025 & 2033
- Figure 31: Rest of the World Maple Water Industry Revenue Share (%), by Distribution Channel 2025 & 2033
- Figure 32: Rest of the World Maple Water Industry Revenue (Million), by Country 2025 & 2033
- Figure 33: Rest of the World Maple Water Industry Revenue Share (%), by Country 2025 & 2033
List of Tables
- Table 1: Global Maple Water Industry Revenue Million Forecast, by Product Type 2020 & 2033
- Table 2: Global Maple Water Industry Revenue Million Forecast, by Packaging Type 2020 & 2033
- Table 3: Global Maple Water Industry Revenue Million Forecast, by Distribution Channel 2020 & 2033
- Table 4: Global Maple Water Industry Revenue Million Forecast, by Region 2020 & 2033
- Table 5: Global Maple Water Industry Revenue Million Forecast, by Product Type 2020 & 2033
- Table 6: Global Maple Water Industry Revenue Million Forecast, by Packaging Type 2020 & 2033
- Table 7: Global Maple Water Industry Revenue Million Forecast, by Distribution Channel 2020 & 2033
- Table 8: Global Maple Water Industry Revenue Million Forecast, by Country 2020 & 2033
- Table 9: United States Maple Water Industry Revenue (Million) Forecast, by Application 2020 & 2033
- Table 10: Canada Maple Water Industry Revenue (Million) Forecast, by Application 2020 & 2033
- Table 11: Mexico Maple Water Industry Revenue (Million) Forecast, by Application 2020 & 2033
- Table 12: Rest of North America Maple Water Industry Revenue (Million) Forecast, by Application 2020 & 2033
- Table 13: Global Maple Water Industry Revenue Million Forecast, by Product Type 2020 & 2033
- Table 14: Global Maple Water Industry Revenue Million Forecast, by Packaging Type 2020 & 2033
- Table 15: Global Maple Water Industry Revenue Million Forecast, by Distribution Channel 2020 & 2033
- Table 16: Global Maple Water Industry Revenue Million Forecast, by Country 2020 & 2033
- Table 17: Germany Maple Water Industry Revenue (Million) Forecast, by Application 2020 & 2033
- Table 18: United Kingdom Maple Water Industry Revenue (Million) Forecast, by Application 2020 & 2033
- Table 19: France Maple Water Industry Revenue (Million) Forecast, by Application 2020 & 2033
- Table 20: Italy Maple Water Industry Revenue (Million) Forecast, by Application 2020 & 2033
- Table 21: Spain Maple Water Industry Revenue (Million) Forecast, by Application 2020 & 2033
- Table 22: Rest of Europe Maple Water Industry Revenue (Million) Forecast, by Application 2020 & 2033
- Table 23: Global Maple Water Industry Revenue Million Forecast, by Product Type 2020 & 2033
- Table 24: Global Maple Water Industry Revenue Million Forecast, by Packaging Type 2020 & 2033
- Table 25: Global Maple Water Industry Revenue Million Forecast, by Distribution Channel 2020 & 2033
- Table 26: Global Maple Water Industry Revenue Million Forecast, by Country 2020 & 2033
- Table 27: China Maple Water Industry Revenue (Million) Forecast, by Application 2020 & 2033
- Table 28: India Maple Water Industry Revenue (Million) Forecast, by Application 2020 & 2033
- Table 29: Australia Maple Water Industry Revenue (Million) Forecast, by Application 2020 & 2033
- Table 30: Japan Maple Water Industry Revenue (Million) Forecast, by Application 2020 & 2033
- Table 31: Global Maple Water Industry Revenue Million Forecast, by Product Type 2020 & 2033
- Table 32: Global Maple Water Industry Revenue Million Forecast, by Packaging Type 2020 & 2033
- Table 33: Global Maple Water Industry Revenue Million Forecast, by Distribution Channel 2020 & 2033
- Table 34: Global Maple Water Industry Revenue Million Forecast, by Country 2020 & 2033
- Table 35: South America Maple Water Industry Revenue (Million) Forecast, by Application 2020 & 2033
- Table 36: Middle East and Africa Maple Water Industry Revenue (Million) Forecast, by Application 2020 & 2033
Frequently Asked Questions
1. What is the projected Compound Annual Growth Rate (CAGR) of the Maple Water Industry?
The projected CAGR is approximately 30.75%.
2. Which companies are prominent players in the Maple Water Industry?
Key companies in the market include Smith & Salmon Inc (Sap! Beverages), Loblaws Companies Limited (President's Choice), MapleMama Beverages LLC, Maple, Drink Simple, Lower Valley Beverage Co(sapsucker)*List Not Exhaustive, Kiki Maple Water, Feronia Forests LLC (Vertical Water), Pure Maple Water Company Ltd, Asarasi.
3. What are the main segments of the Maple Water Industry?
The market segments include Product Type, Packaging Type, Distribution Channel.
4. Can you provide details about the market size?
The market size is estimated to be USD 0.46 Million as of 2022.
5. What are some drivers contributing to market growth?
Popularization of Adventure Sports and Expedition; Suitability of the Freeze-Dried Technique for Heat Sensitive Food Products.
6. What are the notable trends driving market growth?
Value-added Hydration is Evolving Consumer Preferences in the Maple Water Market.
7. Are there any restraints impacting market growth?
High Cost Associated with the Freeze-Drying Technology.
8. Can you provide examples of recent developments in the market?
N/A
9. What pricing options are available for accessing the report?
Pricing options include single-user, multi-user, and enterprise licenses priced at USD 4750, USD 5250, and USD 8750 respectively.
10. Is the market size provided in terms of value or volume?
The market size is provided in terms of value, measured in Million.
11. Are there any specific market keywords associated with the report?
Yes, the market keyword associated with the report is "Maple Water Industry," which aids in identifying and referencing the specific market segment covered.
12. How do I determine which pricing option suits my needs best?
The pricing options vary based on user requirements and access needs. Individual users may opt for single-user licenses, while businesses requiring broader access may choose multi-user or enterprise licenses for cost-effective access to the report.
13. Are there any additional resources or data provided in the Maple Water Industry report?
While the report offers comprehensive insights, it's advisable to review the specific contents or supplementary materials provided to ascertain if additional resources or data are available.
14. How can I stay updated on further developments or reports in the Maple Water Industry?
To stay informed about further developments, trends, and reports in the Maple Water Industry, consider subscribing to industry newsletters, following relevant companies and organizations, or regularly checking reputable industry news sources and publications.
Methodology
Step 1 - Identification of Relevant Samples Size from Population Database


Step 2 - Approaches for Defining Global Market Size (Value, Volume* & Price*)

Note*: In applicable scenarios
Step 3 - Data Sources
Primary Research
- Web Analytics
- Survey Reports
- Research Institute
- Latest Research Reports
- Opinion Leaders
Secondary Research
- Annual Reports
- White Paper
- Latest Press Release
- Industry Association
- Paid Database
- Investor Presentations

Step 4 - Data Triangulation
Involves using different sources of information in order to increase the validity of a study
These sources are likely to be stakeholders in a program - participants, other researchers, program staff, other community members, and so on.
Then we put all data in single framework & apply various statistical tools to find out the dynamic on the market.
During the analysis stage, feedback from the stakeholder groups would be compared to determine areas of agreement as well as areas of divergence