

Key Insights
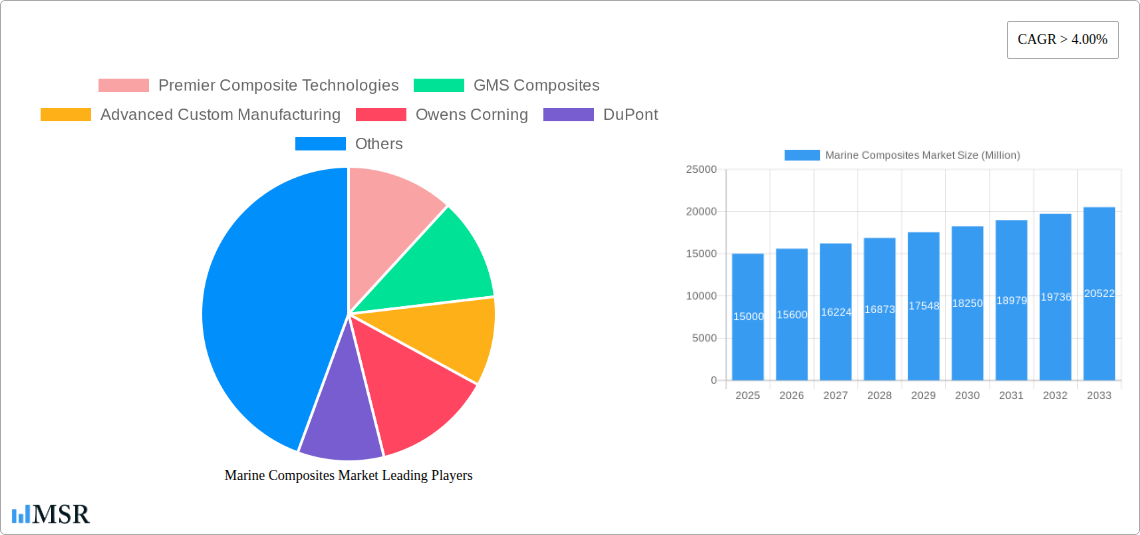
The marine composites market is poised for substantial expansion, projecting a Compound Annual Growth Rate (CAGR) of 5%. The global market size was valued at $1341 million in the base year 2025 and is expected to continue its upward trajectory. This growth is propelled by the increasing adoption of lightweight, high-strength composite materials across the marine sector. Key drivers include the surging popularity of recreational boating and advancements in composite technology that enhance vessel performance and longevity. Furthermore, the marine industry's commitment to sustainability and fuel efficiency is a significant catalyst, favoring lighter composites to reduce fuel consumption and environmental impact. Specific market segments, such as high-performance sailboats and powerboats, are experiencing accelerated demand for advanced materials like carbon fiber reinforced polymers (CFRPs) and premium resin systems. Conversely, slower growth in certain segments may be attributed to the prevalence of traditional materials or the initial cost of some composite solutions.
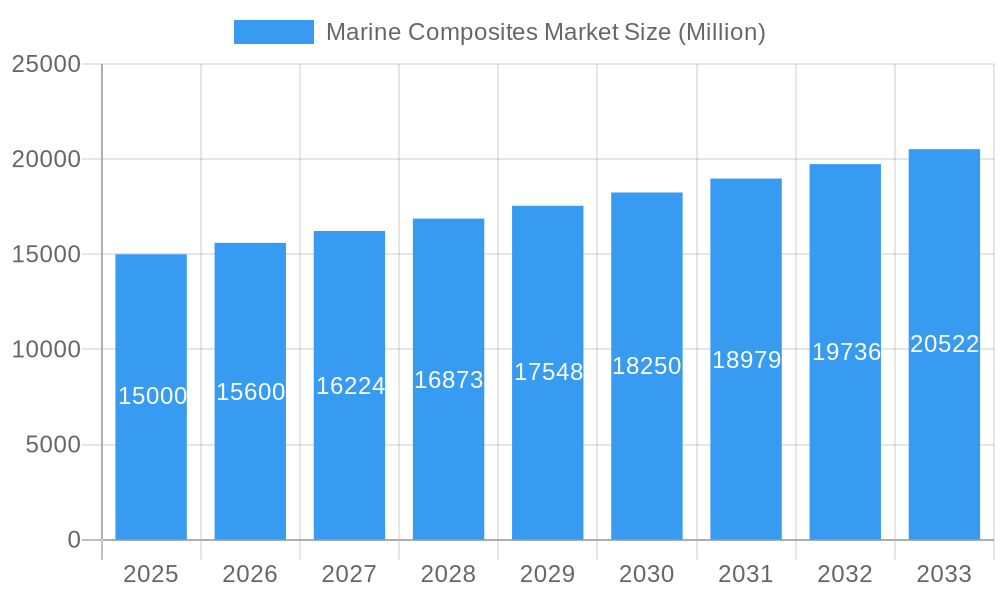
Marine Composites Market Market Size (In Billion)
Regionally, the Asia-Pacific market, particularly China and India, is anticipated to lead growth due to expanding shipbuilding activities and rising recreational boating participation. North America and Europe, established markets, will see sustained growth driven by technological innovation and fleet replacement initiatives. The competitive environment is robust, featuring industry leaders such as Owens Corning and DuPont alongside specialized composite manufacturers.
Marine Composites Market Company Market Share
Market segmentation reveals critical dynamics. While the sailboat and powerboat segments are rapidly advancing due to performance benefits, the cruise ship sector presents a distinct growth pattern influenced by large-scale project investments and manufacturing complexities. Composite material selection is application-specific; metal matrix composites are often chosen for high-stress components, whereas polymer matrix composites are prevalent in recreational vessels. Epoxy resins remain dominant due to their superior properties, but the emergence of high-performance alternatives, including bio-based resins, is set to redefine the resin type segment. This multifaceted landscape underscores the market's resilience and promising future.
Marine Composites Market Report: 2019-2033 Forecast
This comprehensive report provides an in-depth analysis of the global Marine Composites Market, offering invaluable insights for industry stakeholders, investors, and strategic decision-makers. Covering the period from 2019 to 2033, with a base year of 2025 and a forecast period of 2025-2033, this report meticulously examines market dynamics, key segments, leading players, and future growth prospects. The market size is estimated to reach xx Million by 2025 and is projected to experience a CAGR of xx% during the forecast period.
Marine Composites Market Concentration & Dynamics
The Marine Composites Market exhibits a moderately concentrated structure, with several key players holding significant market share. Premier Composite Technologies, GMS Composites, Advanced Custom Manufacturing, Owens Corning, DuPont, Hyosung, Hexcel Corporation, Gurit, Airborne, and Toray Group (ZOLTEK Corporation) are among the prominent companies shaping the market landscape. However, the presence of numerous smaller players and regional manufacturers indicates a competitive environment. The market share of the top 5 players is estimated at xx%.
- Innovation Ecosystems: Significant R&D investments are driving innovation in resin types (epoxy, polyester, and others), composite materials (polymer matrix composites, metal matrix composites, and ceramic matrix composites), and manufacturing processes.
- Regulatory Frameworks: Stringent environmental regulations regarding volatile organic compounds (VOCs) and waste management are influencing material selection and manufacturing processes. Compliance costs and the need for sustainable solutions are shaping market dynamics.
- Substitute Products: Alternative materials like traditional metals and wood pose competitive pressure. However, the superior strength-to-weight ratio and design flexibility of composites continue to drive market growth.
- End-User Trends: Growing demand for lightweight, high-performance vessels in the recreational boating, commercial shipping, and defense sectors is a key driver. Increasing adoption of electric and hybrid propulsion systems also presents growth opportunities.
- M&A Activities: The market has witnessed xx M&A deals in the last five years, driven by efforts to expand product portfolios, gain market share, and enhance technological capabilities.
Marine Composites Market Industry Insights & Trends
The Marine Composites Market is witnessing robust growth fueled by several key factors. The rising demand for lightweight, durable, and fuel-efficient vessels, coupled with the increasing adoption of composites in various vessel types, is a major contributor. The market's expansion is further driven by technological advancements in composite materials and manufacturing processes, leading to improved performance characteristics and reduced production costs. Consumer preference for aesthetically pleasing and environmentally friendly boats also contributes to market expansion. The market is projected to reach xx Million by 2033, representing significant growth opportunities. Technological disruptions, such as the development of self-healing composites and advanced manufacturing techniques (e.g., 3D printing), are further accelerating market growth. Changing consumer preferences towards eco-friendly and sustainable options are influencing material selection and production methods.
Key Markets & Segments Leading Marine Composites Market
The Polymer Matrix Composites segment currently dominates the market, driven by its cost-effectiveness and versatility. Within vessel types, Power Boats represent the largest segment, reflecting strong demand in the recreational boating sector. The Epoxy resin type is the most widely used due to its superior bonding properties and resistance to marine environments. Geographically, North America and Europe currently hold the largest market shares.
Key Market Drivers:
- North America: Strong recreational boating industry, high disposable income, and technological advancements.
- Europe: Significant shipbuilding industry, focus on sustainable technologies, and government support for green initiatives.
- Asia-Pacific: Rapid economic growth, increasing demand for marine transportation, and rising investment in infrastructure development.
Dominance Analysis:
The dominance of Polymer Matrix Composites stems from their favorable cost-benefit ratio. The high demand for Power Boats underscores the popularity of recreational boating. North America and Europe benefit from established shipbuilding industries and consumer preferences.
Marine Composites Market Product Developments
Recent product innovations include the development of self-healing composites that can repair minor damage autonomously, extending the lifespan of marine structures. Lightweight, high-strength composites with enhanced resistance to UV degradation and saltwater corrosion are gaining traction. These advancements offer enhanced durability, reduced maintenance, and improved performance, providing a competitive edge in the market.
Challenges in the Marine Composites Market Market
The market faces challenges such as high initial material costs, complex manufacturing processes, and the need for skilled labor. Supply chain disruptions and fluctuations in raw material prices also pose significant challenges. Stringent environmental regulations necessitate the development of more sustainable production methods. Furthermore, competition from traditional materials and the need to comply with safety standards present considerable hurdles.
Forces Driving Marine Composites Market Growth
Technological advancements in material science and manufacturing techniques are primary growth drivers. The increasing demand for fuel-efficient vessels and eco-friendly materials is propelling market expansion. Government support for sustainable maritime technologies and infrastructure development further enhances market prospects. Rising disposable incomes and the growing popularity of recreational boating are also significantly contributing factors.
Long-Term Growth Catalysts
Long-term growth will be driven by continued innovation in composite materials, leading to improved performance and cost reduction. Strategic partnerships between material suppliers, manufacturers, and technology providers will facilitate the development and adoption of advanced composite technologies. Expansion into emerging markets and the development of specialized composite solutions for specific applications (e.g., high-speed ferries, offshore wind energy structures) will further stimulate market growth.
Emerging Opportunities in Marine Composites Market
Emerging opportunities lie in the development of biodegradable and recyclable composite materials. The growing demand for electric and hybrid vessels presents significant opportunities for lightweight, high-strength composites. Expansion into new markets such as offshore renewable energy structures and the development of advanced manufacturing techniques, such as 3D printing, will unlock new growth avenues.
Leading Players in the Marine Composites Market Sector
- Premier Composite Technologies
- GMS Composites
- Advanced Custom Manufacturing
- Owens Corning
- DuPont
- Hyosung
- Hexcel Corporation
- Gurit
- Airborne
- Toray Group (ZOLTEK Corporation)
- List Not Exhaustive
Key Milestones in Marine Composites Market Industry
- 2020: Introduction of a new self-healing composite material by X company.
- 2021: Merger between two major players in the polymer matrix composites segment.
- 2022: Launch of a new automated manufacturing process by Y company.
- 2023: Significant investment in R&D for sustainable composite materials by Z company.
Strategic Outlook for Marine Composites Market Market
The Marine Composites Market is poised for significant growth in the coming years, driven by technological advancements, increasing demand for sustainable solutions, and expansion into new markets. Companies can leverage this growth by focusing on innovation, strategic partnerships, and expansion into high-growth segments. Investing in research and development of sustainable materials and advanced manufacturing techniques will be crucial for long-term success.
Marine Composites Market Segmentation
-
1. Composite Type
- 1.1. Metal Matrix Composites
- 1.2. Polymer Matrix Composites
- 1.3. Ceramic Matrix Composites
-
2. Resin Type
- 2.1. Epoxy
- 2.2. Polyester
- 2.3. Other Resin Types
-
3. Vessel Type
- 3.1. Sailboats
- 3.2. Cruise Ships
- 3.3. Power Boats
- 3.4. Other Vessel Types
Marine Composites Market Segmentation By Geography
-
1. Asia Pacific
- 1.1. China
- 1.2. India
- 1.3. Japan
- 1.4. South Korea
- 1.5. Rest of Asia Pacific
-
2. North America
- 2.1. United States
- 2.2. Canada
- 2.3. Mexico
-
3. Europe
- 3.1. Germany
- 3.2. United Kingdom
- 3.3. Italy
- 3.4. France
- 3.5. Rest of Europe
-
4. South America
- 4.1. Brazil
- 4.2. Argentina
- 4.3. Rest of South America
-
5. Middle East and Africa
- 5.1. Saudi Arabia
- 5.2. South Africa
- 5.3. Rest of Middle East and Africa
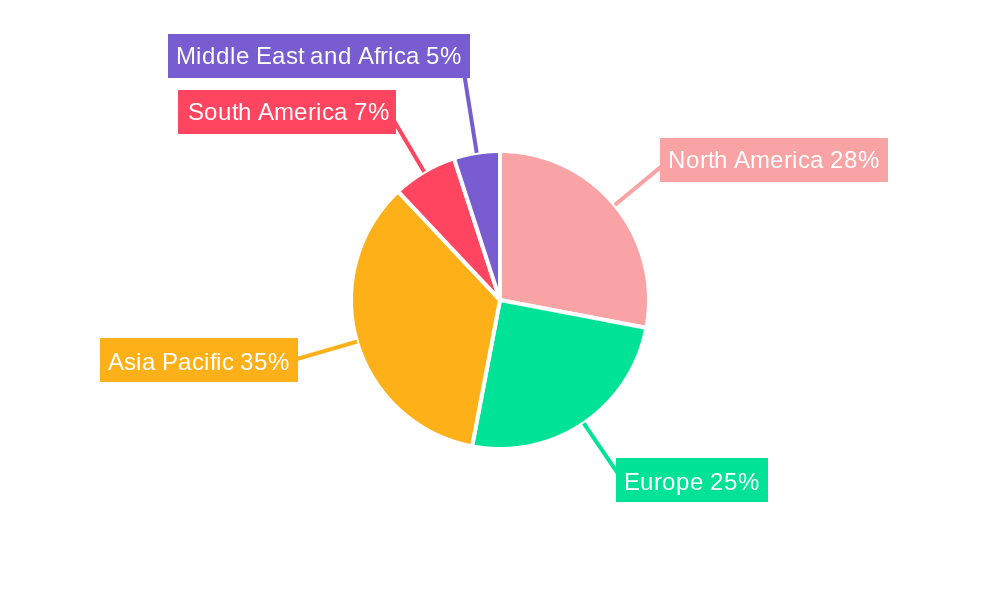
Marine Composites Market Regional Market Share
Geographic Coverage of Marine Composites Market
Marine Composites Market REPORT HIGHLIGHTS
| Aspects | Details |
|---|---|
| Study Period | 2020-2034 |
| Base Year | 2025 |
| Estimated Year | 2026 |
| Forecast Period | 2026-2034 |
| Historical Period | 2020-2025 |
| Growth Rate | CAGR of 5% from 2020-2034 |
| Segmentation |
|
Table of Contents
- 1. Introduction
- 1.1. Research Scope
- 1.2. Market Segmentation
- 1.3. Research Objective
- 1.4. Definitions and Assumptions
- 2. Executive Summary
- 2.1. Market Snapshot
- 3. Market Dynamics
- 3.1. Market Drivers
- 3.2. Market Restrains
- 3.3. Market Trends
- 3.4. Market Opportunities
- 4. Market Factor Analysis
- 4.1. Porters Five Forces
- 4.1.1. Bargaining Power of Suppliers
- 4.1.2. Bargaining Power of Buyers
- 4.1.3. Threat of New Entrants
- 4.1.4. Threat of Substitutes
- 4.1.5. Competitive Rivalry
- 4.2. PESTEL analysis
- 4.3. BCG Analysis
- 4.3.1. Stars (High Growth, High Market Share)
- 4.3.2. Cash Cows (Low Growth, High Market Share)
- 4.3.3. Question Mark (High Growth, Low Market Share)
- 4.3.4. Dogs (Low Growth, Low Market Share)
- 4.4. Ansoff Matrix Analysis
- 4.5. Supply Chain Analysis
- 4.6. Regulatory Landscape
- 4.7. Current Market Potential and Opportunity Assessment (TAM–SAM–SOM Framework)
- 4.8. MSR Analyst Note
- 4.1. Porters Five Forces
- 5. Market Analysis, Insights and Forecast 2021-2033
- 5.1. Market Analysis, Insights and Forecast - by Composite Type
- 5.1.1. Metal Matrix Composites
- 5.1.2. Polymer Matrix Composites
- 5.1.3. Ceramic Matrix Composites
- 5.2. Market Analysis, Insights and Forecast - by Resin Type
- 5.2.1. Epoxy
- 5.2.2. Polyester
- 5.2.3. Other Resin Types
- 5.3. Market Analysis, Insights and Forecast - by Vessel Type
- 5.3.1. Sailboats
- 5.3.2. Cruise Ships
- 5.3.3. Power Boats
- 5.3.4. Other Vessel Types
- 5.4. Market Analysis, Insights and Forecast - by Region
- 5.4.1. Asia Pacific
- 5.4.2. North America
- 5.4.3. Europe
- 5.4.4. South America
- 5.4.5. Middle East and Africa
- 5.1. Market Analysis, Insights and Forecast - by Composite Type
- 6. Global Marine Composites Market Analysis, Insights and Forecast, 2021-2033
- 6.1. Market Analysis, Insights and Forecast - by Composite Type
- 6.1.1. Metal Matrix Composites
- 6.1.2. Polymer Matrix Composites
- 6.1.3. Ceramic Matrix Composites
- 6.2. Market Analysis, Insights and Forecast - by Resin Type
- 6.2.1. Epoxy
- 6.2.2. Polyester
- 6.2.3. Other Resin Types
- 6.3. Market Analysis, Insights and Forecast - by Vessel Type
- 6.3.1. Sailboats
- 6.3.2. Cruise Ships
- 6.3.3. Power Boats
- 6.3.4. Other Vessel Types
- 6.1. Market Analysis, Insights and Forecast - by Composite Type
- 7. Asia Pacific Marine Composites Market Analysis, Insights and Forecast, 2020-2032
- 7.1. Market Analysis, Insights and Forecast - by Composite Type
- 7.1.1. Metal Matrix Composites
- 7.1.2. Polymer Matrix Composites
- 7.1.3. Ceramic Matrix Composites
- 7.2. Market Analysis, Insights and Forecast - by Resin Type
- 7.2.1. Epoxy
- 7.2.2. Polyester
- 7.2.3. Other Resin Types
- 7.3. Market Analysis, Insights and Forecast - by Vessel Type
- 7.3.1. Sailboats
- 7.3.2. Cruise Ships
- 7.3.3. Power Boats
- 7.3.4. Other Vessel Types
- 7.1. Market Analysis, Insights and Forecast - by Composite Type
- 8. North America Marine Composites Market Analysis, Insights and Forecast, 2020-2032
- 8.1. Market Analysis, Insights and Forecast - by Composite Type
- 8.1.1. Metal Matrix Composites
- 8.1.2. Polymer Matrix Composites
- 8.1.3. Ceramic Matrix Composites
- 8.2. Market Analysis, Insights and Forecast - by Resin Type
- 8.2.1. Epoxy
- 8.2.2. Polyester
- 8.2.3. Other Resin Types
- 8.3. Market Analysis, Insights and Forecast - by Vessel Type
- 8.3.1. Sailboats
- 8.3.2. Cruise Ships
- 8.3.3. Power Boats
- 8.3.4. Other Vessel Types
- 8.1. Market Analysis, Insights and Forecast - by Composite Type
- 9. Europe Marine Composites Market Analysis, Insights and Forecast, 2020-2032
- 9.1. Market Analysis, Insights and Forecast - by Composite Type
- 9.1.1. Metal Matrix Composites
- 9.1.2. Polymer Matrix Composites
- 9.1.3. Ceramic Matrix Composites
- 9.2. Market Analysis, Insights and Forecast - by Resin Type
- 9.2.1. Epoxy
- 9.2.2. Polyester
- 9.2.3. Other Resin Types
- 9.3. Market Analysis, Insights and Forecast - by Vessel Type
- 9.3.1. Sailboats
- 9.3.2. Cruise Ships
- 9.3.3. Power Boats
- 9.3.4. Other Vessel Types
- 9.1. Market Analysis, Insights and Forecast - by Composite Type
- 10. South America Marine Composites Market Analysis, Insights and Forecast, 2020-2032
- 10.1. Market Analysis, Insights and Forecast - by Composite Type
- 10.1.1. Metal Matrix Composites
- 10.1.2. Polymer Matrix Composites
- 10.1.3. Ceramic Matrix Composites
- 10.2. Market Analysis, Insights and Forecast - by Resin Type
- 10.2.1. Epoxy
- 10.2.2. Polyester
- 10.2.3. Other Resin Types
- 10.3. Market Analysis, Insights and Forecast - by Vessel Type
- 10.3.1. Sailboats
- 10.3.2. Cruise Ships
- 10.3.3. Power Boats
- 10.3.4. Other Vessel Types
- 10.1. Market Analysis, Insights and Forecast - by Composite Type
- 11. Middle East and Africa Marine Composites Market Analysis, Insights and Forecast, 2020-2032
- 11.1. Market Analysis, Insights and Forecast - by Composite Type
- 11.1.1. Metal Matrix Composites
- 11.1.2. Polymer Matrix Composites
- 11.1.3. Ceramic Matrix Composites
- 11.2. Market Analysis, Insights and Forecast - by Resin Type
- 11.2.1. Epoxy
- 11.2.2. Polyester
- 11.2.3. Other Resin Types
- 11.3. Market Analysis, Insights and Forecast - by Vessel Type
- 11.3.1. Sailboats
- 11.3.2. Cruise Ships
- 11.3.3. Power Boats
- 11.3.4. Other Vessel Types
- 11.1. Market Analysis, Insights and Forecast - by Composite Type
- 12. Competitive Analysis
- 12.1. Company Profiles
- 12.1.1 Premier Composite Technologies
- 12.1.1.1. Company Overview
- 12.1.1.2. Products
- 12.1.1.3. Company Financials
- 12.1.1.4. SWOT Analysis
- 12.1.2 GMS Composites
- 12.1.2.1. Company Overview
- 12.1.2.2. Products
- 12.1.2.3. Company Financials
- 12.1.2.4. SWOT Analysis
- 12.1.3 Advanced Custom Manufacturing
- 12.1.3.1. Company Overview
- 12.1.3.2. Products
- 12.1.3.3. Company Financials
- 12.1.3.4. SWOT Analysis
- 12.1.4 Owens Corning
- 12.1.4.1. Company Overview
- 12.1.4.2. Products
- 12.1.4.3. Company Financials
- 12.1.4.4. SWOT Analysis
- 12.1.5 DuPont
- 12.1.5.1. Company Overview
- 12.1.5.2. Products
- 12.1.5.3. Company Financials
- 12.1.5.4. SWOT Analysis
- 12.1.6 Hyosung
- 12.1.6.1. Company Overview
- 12.1.6.2. Products
- 12.1.6.3. Company Financials
- 12.1.6.4. SWOT Analysis
- 12.1.7 Hexcel Corporation
- 12.1.7.1. Company Overview
- 12.1.7.2. Products
- 12.1.7.3. Company Financials
- 12.1.7.4. SWOT Analysis
- 12.1.8 Gurit
- 12.1.8.1. Company Overview
- 12.1.8.2. Products
- 12.1.8.3. Company Financials
- 12.1.8.4. SWOT Analysis
- 12.1.9 Airborne
- 12.1.9.1. Company Overview
- 12.1.9.2. Products
- 12.1.9.3. Company Financials
- 12.1.9.4. SWOT Analysis
- 12.1.10 Toray Group (ZOLTEK Corporation)*List Not Exhaustive
- 12.1.10.1. Company Overview
- 12.1.10.2. Products
- 12.1.10.3. Company Financials
- 12.1.10.4. SWOT Analysis
- 12.1.1 Premier Composite Technologies
- 12.2. Market Entropy
- 12.2.1 Company's Key Areas Served
- 12.2.2 Recent Developments
- 12.3. Company Market Share Analysis 2025
- 12.3.1 Top 5 Companies Market Share Analysis
- 12.3.2 Top 3 Companies Market Share Analysis
- 12.4. List of Potential Customers
- 13. Research Methodology
List of Figures
- Figure 1: Global Marine Composites Market Revenue Breakdown (million, %) by Region 2025 & 2033
- Figure 2: Asia Pacific Marine Composites Market Revenue (million), by Composite Type 2025 & 2033
- Figure 3: Asia Pacific Marine Composites Market Revenue Share (%), by Composite Type 2025 & 2033
- Figure 4: Asia Pacific Marine Composites Market Revenue (million), by Resin Type 2025 & 2033
- Figure 5: Asia Pacific Marine Composites Market Revenue Share (%), by Resin Type 2025 & 2033
- Figure 6: Asia Pacific Marine Composites Market Revenue (million), by Vessel Type 2025 & 2033
- Figure 7: Asia Pacific Marine Composites Market Revenue Share (%), by Vessel Type 2025 & 2033
- Figure 8: Asia Pacific Marine Composites Market Revenue (million), by Country 2025 & 2033
- Figure 9: Asia Pacific Marine Composites Market Revenue Share (%), by Country 2025 & 2033
- Figure 10: North America Marine Composites Market Revenue (million), by Composite Type 2025 & 2033
- Figure 11: North America Marine Composites Market Revenue Share (%), by Composite Type 2025 & 2033
- Figure 12: North America Marine Composites Market Revenue (million), by Resin Type 2025 & 2033
- Figure 13: North America Marine Composites Market Revenue Share (%), by Resin Type 2025 & 2033
- Figure 14: North America Marine Composites Market Revenue (million), by Vessel Type 2025 & 2033
- Figure 15: North America Marine Composites Market Revenue Share (%), by Vessel Type 2025 & 2033
- Figure 16: North America Marine Composites Market Revenue (million), by Country 2025 & 2033
- Figure 17: North America Marine Composites Market Revenue Share (%), by Country 2025 & 2033
- Figure 18: Europe Marine Composites Market Revenue (million), by Composite Type 2025 & 2033
- Figure 19: Europe Marine Composites Market Revenue Share (%), by Composite Type 2025 & 2033
- Figure 20: Europe Marine Composites Market Revenue (million), by Resin Type 2025 & 2033
- Figure 21: Europe Marine Composites Market Revenue Share (%), by Resin Type 2025 & 2033
- Figure 22: Europe Marine Composites Market Revenue (million), by Vessel Type 2025 & 2033
- Figure 23: Europe Marine Composites Market Revenue Share (%), by Vessel Type 2025 & 2033
- Figure 24: Europe Marine Composites Market Revenue (million), by Country 2025 & 2033
- Figure 25: Europe Marine Composites Market Revenue Share (%), by Country 2025 & 2033
- Figure 26: South America Marine Composites Market Revenue (million), by Composite Type 2025 & 2033
- Figure 27: South America Marine Composites Market Revenue Share (%), by Composite Type 2025 & 2033
- Figure 28: South America Marine Composites Market Revenue (million), by Resin Type 2025 & 2033
- Figure 29: South America Marine Composites Market Revenue Share (%), by Resin Type 2025 & 2033
- Figure 30: South America Marine Composites Market Revenue (million), by Vessel Type 2025 & 2033
- Figure 31: South America Marine Composites Market Revenue Share (%), by Vessel Type 2025 & 2033
- Figure 32: South America Marine Composites Market Revenue (million), by Country 2025 & 2033
- Figure 33: South America Marine Composites Market Revenue Share (%), by Country 2025 & 2033
- Figure 34: Middle East and Africa Marine Composites Market Revenue (million), by Composite Type 2025 & 2033
- Figure 35: Middle East and Africa Marine Composites Market Revenue Share (%), by Composite Type 2025 & 2033
- Figure 36: Middle East and Africa Marine Composites Market Revenue (million), by Resin Type 2025 & 2033
- Figure 37: Middle East and Africa Marine Composites Market Revenue Share (%), by Resin Type 2025 & 2033
- Figure 38: Middle East and Africa Marine Composites Market Revenue (million), by Vessel Type 2025 & 2033
- Figure 39: Middle East and Africa Marine Composites Market Revenue Share (%), by Vessel Type 2025 & 2033
- Figure 40: Middle East and Africa Marine Composites Market Revenue (million), by Country 2025 & 2033
- Figure 41: Middle East and Africa Marine Composites Market Revenue Share (%), by Country 2025 & 2033
List of Tables
- Table 1: Global Marine Composites Market Revenue million Forecast, by Composite Type 2020 & 2033
- Table 2: Global Marine Composites Market Revenue million Forecast, by Resin Type 2020 & 2033
- Table 3: Global Marine Composites Market Revenue million Forecast, by Vessel Type 2020 & 2033
- Table 4: Global Marine Composites Market Revenue million Forecast, by Region 2020 & 2033
- Table 5: Global Marine Composites Market Revenue million Forecast, by Composite Type 2020 & 2033
- Table 6: Global Marine Composites Market Revenue million Forecast, by Resin Type 2020 & 2033
- Table 7: Global Marine Composites Market Revenue million Forecast, by Vessel Type 2020 & 2033
- Table 8: Global Marine Composites Market Revenue million Forecast, by Country 2020 & 2033
- Table 9: China Marine Composites Market Revenue (million) Forecast, by Application 2020 & 2033
- Table 10: India Marine Composites Market Revenue (million) Forecast, by Application 2020 & 2033
- Table 11: Japan Marine Composites Market Revenue (million) Forecast, by Application 2020 & 2033
- Table 12: South Korea Marine Composites Market Revenue (million) Forecast, by Application 2020 & 2033
- Table 13: Rest of Asia Pacific Marine Composites Market Revenue (million) Forecast, by Application 2020 & 2033
- Table 14: Global Marine Composites Market Revenue million Forecast, by Composite Type 2020 & 2033
- Table 15: Global Marine Composites Market Revenue million Forecast, by Resin Type 2020 & 2033
- Table 16: Global Marine Composites Market Revenue million Forecast, by Vessel Type 2020 & 2033
- Table 17: Global Marine Composites Market Revenue million Forecast, by Country 2020 & 2033
- Table 18: United States Marine Composites Market Revenue (million) Forecast, by Application 2020 & 2033
- Table 19: Canada Marine Composites Market Revenue (million) Forecast, by Application 2020 & 2033
- Table 20: Mexico Marine Composites Market Revenue (million) Forecast, by Application 2020 & 2033
- Table 21: Global Marine Composites Market Revenue million Forecast, by Composite Type 2020 & 2033
- Table 22: Global Marine Composites Market Revenue million Forecast, by Resin Type 2020 & 2033
- Table 23: Global Marine Composites Market Revenue million Forecast, by Vessel Type 2020 & 2033
- Table 24: Global Marine Composites Market Revenue million Forecast, by Country 2020 & 2033
- Table 25: Germany Marine Composites Market Revenue (million) Forecast, by Application 2020 & 2033
- Table 26: United Kingdom Marine Composites Market Revenue (million) Forecast, by Application 2020 & 2033
- Table 27: Italy Marine Composites Market Revenue (million) Forecast, by Application 2020 & 2033
- Table 28: France Marine Composites Market Revenue (million) Forecast, by Application 2020 & 2033
- Table 29: Rest of Europe Marine Composites Market Revenue (million) Forecast, by Application 2020 & 2033
- Table 30: Global Marine Composites Market Revenue million Forecast, by Composite Type 2020 & 2033
- Table 31: Global Marine Composites Market Revenue million Forecast, by Resin Type 2020 & 2033
- Table 32: Global Marine Composites Market Revenue million Forecast, by Vessel Type 2020 & 2033
- Table 33: Global Marine Composites Market Revenue million Forecast, by Country 2020 & 2033
- Table 34: Brazil Marine Composites Market Revenue (million) Forecast, by Application 2020 & 2033
- Table 35: Argentina Marine Composites Market Revenue (million) Forecast, by Application 2020 & 2033
- Table 36: Rest of South America Marine Composites Market Revenue (million) Forecast, by Application 2020 & 2033
- Table 37: Global Marine Composites Market Revenue million Forecast, by Composite Type 2020 & 2033
- Table 38: Global Marine Composites Market Revenue million Forecast, by Resin Type 2020 & 2033
- Table 39: Global Marine Composites Market Revenue million Forecast, by Vessel Type 2020 & 2033
- Table 40: Global Marine Composites Market Revenue million Forecast, by Country 2020 & 2033
- Table 41: Saudi Arabia Marine Composites Market Revenue (million) Forecast, by Application 2020 & 2033
- Table 42: South Africa Marine Composites Market Revenue (million) Forecast, by Application 2020 & 2033
- Table 43: Rest of Middle East and Africa Marine Composites Market Revenue (million) Forecast, by Application 2020 & 2033
Frequently Asked Questions
1. What is the projected Compound Annual Growth Rate (CAGR) of the Marine Composites Market?
The projected CAGR is approximately 5%.
2. Which companies are prominent players in the Marine Composites Market?
Key companies in the market include Premier Composite Technologies, GMS Composites, Advanced Custom Manufacturing, Owens Corning, DuPont, Hyosung, Hexcel Corporation, Gurit, Airborne, Toray Group (ZOLTEK Corporation)*List Not Exhaustive.
3. What are the main segments of the Marine Composites Market?
The market segments include Composite Type, Resin Type, Vessel Type.
4. Can you provide details about the market size?
The market size is estimated to be USD 1341 million as of 2022.
5. What are some drivers contributing to market growth?
; Increasing Production of Leisure Boats and Cruise Ships; Other Drivers.
6. What are the notable trends driving market growth?
Increasing Demand for Cruise Ships.
7. Are there any restraints impacting market growth?
; Unfavorable Conditions Arising Due to COVID-19 Outbreak; Other Restraints.
8. Can you provide examples of recent developments in the market?
N/A
9. What pricing options are available for accessing the report?
Pricing options include single-user, multi-user, and enterprise licenses priced at USD 4750, USD 5250, and USD 8750 respectively.
10. Is the market size provided in terms of value or volume?
The market size is provided in terms of value, measured in million.
11. Are there any specific market keywords associated with the report?
Yes, the market keyword associated with the report is "Marine Composites Market," which aids in identifying and referencing the specific market segment covered.
12. How do I determine which pricing option suits my needs best?
The pricing options vary based on user requirements and access needs. Individual users may opt for single-user licenses, while businesses requiring broader access may choose multi-user or enterprise licenses for cost-effective access to the report.
13. Are there any additional resources or data provided in the Marine Composites Market report?
While the report offers comprehensive insights, it's advisable to review the specific contents or supplementary materials provided to ascertain if additional resources or data are available.
14. How can I stay updated on further developments or reports in the Marine Composites Market?
To stay informed about further developments, trends, and reports in the Marine Composites Market, consider subscribing to industry newsletters, following relevant companies and organizations, or regularly checking reputable industry news sources and publications.
Methodology
Step 1 - Identification of Relevant Samples Size from Population Database


Step 2 - Approaches for Defining Global Market Size (Value, Volume* & Price*)

Note*: In applicable scenarios
Step 3 - Data Sources
Primary Research
- Web Analytics
- Survey Reports
- Research Institute
- Latest Research Reports
- Opinion Leaders
Secondary Research
- Annual Reports
- White Paper
- Latest Press Release
- Industry Association
- Paid Database
- Investor Presentations

Step 4 - Data Triangulation
Involves using different sources of information in order to increase the validity of a study
These sources are likely to be stakeholders in a program - participants, other researchers, program staff, other community members, and so on.
Then we put all data in single framework & apply various statistical tools to find out the dynamic on the market.
During the analysis stage, feedback from the stakeholder groups would be compared to determine areas of agreement as well as areas of divergence