

Key Insights
The Medium Density Fiberboard (MDF) market is poised for robust expansion, driven by its extensive utility across multiple industries. The market, currently valued at 44.84 billion in the base year 2024, is projected to grow at a Compound Annual Growth Rate (CAGR) of 5.6%. This upward trajectory is underpinned by several key drivers. Surging demand for furniture, particularly within rapidly developing economies such as India and China, is a primary contributor. The burgeoning construction sector, encompassing both residential and commercial projects, further elevates MDF demand for applications including cabinetry, flooring, and millwork. Additionally, the escalating preference for sustainable building materials and the widespread adoption of advanced manufacturing processes within the MDF industry are also stimulating market growth. Leading companies are actively investing in research and development to enhance product quality and introduce novel solutions, thereby reinforcing their competitive standing.
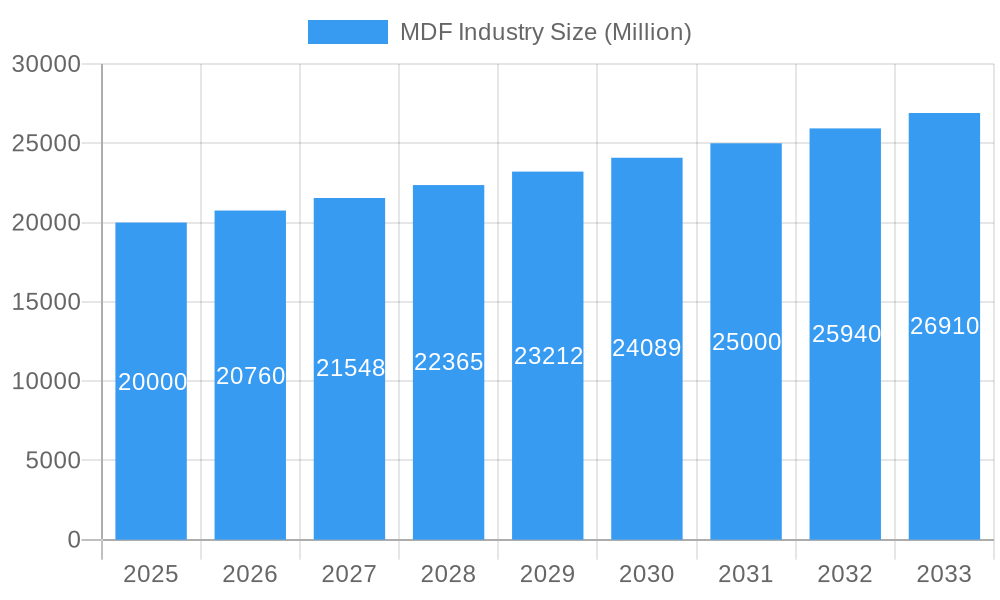
MDF Industry Market Size (In Billion)
Despite positive growth prospects, certain factors may impede market expansion. Volatility in raw material prices, notably wood fiber, presents a notable risk to profitability. Environmental considerations, including deforestation and formaldehyde emissions during MDF production, necessitate the implementation of sustainable manufacturing practices and adherence to stringent environmental regulations. Furthermore, competition from substitute materials like particleboard and plywood impacts MDF's market share. Nevertheless, the industry's strategic emphasis on innovation, sustainability, and the exploration of new application domains ensures the MDF market remains an attractive investment prospect. Regional growth is anticipated to be dynamic, with the Asia-Pacific region expected to lead expansion due to its substantial and growing populations and active construction activities. North America and Europe are anticipated to sustain their roles as mature markets with steady growth.
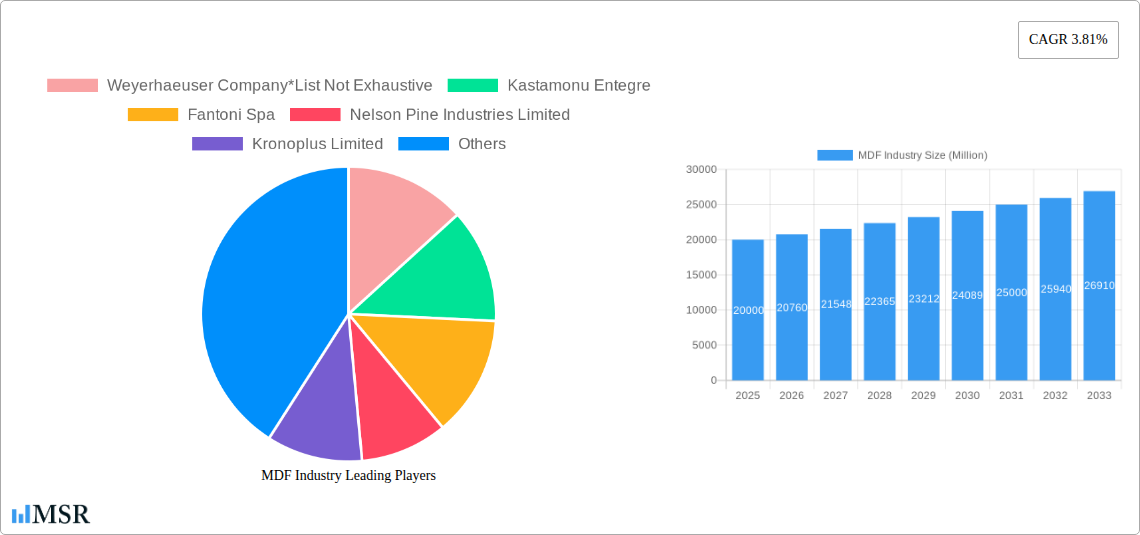
MDF Industry Company Market Share
MDF Industry Market Report: 2019-2033 Forecast
This comprehensive report provides an in-depth analysis of the global Medium Density Fiberboard (MDF) industry, offering valuable insights for stakeholders, investors, and industry professionals. Covering the period from 2019 to 2033, with a focus on 2025, this report meticulously examines market dynamics, key players, and emerging trends to provide a clear strategic outlook for the MDF market. The global MDF market size is projected to reach USD xx Million by 2033, exhibiting a Compound Annual Growth Rate (CAGR) of xx% during the forecast period (2025-2033).
MDF Industry Market Concentration & Dynamics
The global MDF market is characterized by a moderately concentrated landscape, with a handful of major players holding significant market share. However, the presence of numerous regional and smaller players contributes to a dynamic competitive environment. Market share data for 2024 suggests that the top five players control approximately xx% of the global market. Innovation is crucial, with companies investing heavily in research and development to improve product quality, expand applications, and enhance sustainability. Regulatory frameworks concerning environmental protection and sustainable forestry significantly impact the industry, driving the adoption of eco-friendly manufacturing processes. Substitute products, such as particleboard and plywood, exert competitive pressure, forcing MDF producers to differentiate through product innovation and cost optimization. End-user trends, particularly in the construction and furniture sectors, influence demand, with growth in residential and commercial construction driving significant MDF consumption. Mergers and acquisitions (M&A) activity has been relatively steady in recent years, with approximately xx M&A deals recorded between 2019 and 2024, primarily focused on expanding geographic reach and product portfolios.
- Market Share: Top 5 players control approximately xx% (2024 data).
- M&A Activity: Approximately xx deals between 2019 and 2024.
- Key Drivers: Innovation, regulatory compliance, end-user demand.
- Challenges: Substitute products, competition.
MDF Industry Insights & Trends
The MDF market experienced robust growth during the historical period (2019-2024), driven primarily by the construction boom across key regions. This growth trajectory is expected to continue, albeit at a moderated pace, throughout the forecast period (2025-2033). Technological advancements, such as improved manufacturing processes and the development of specialized MDF products with enhanced properties (e.g., moisture resistance, fire retardancy), are key growth drivers. Changing consumer preferences, with increasing demand for sustainable and aesthetically pleasing products, are influencing product design and marketing strategies. The market size reached USD xx Million in 2024 and is projected to reach USD xx Million by 2033, driven by sustained demand from the furniture, construction, and packaging industries.
Key Markets & Segments Leading MDF Industry
The Asia-Pacific region dominates the global MDF market, driven by rapid urbanization, infrastructure development, and a burgeoning furniture industry. China, India, and other Southeast Asian nations account for a significant portion of this regional dominance. Within the application segments, furniture (USD xx Million in 2024), cabinet (USD xx Million in 2024), and flooring (USD xx Million in 2024) represent the largest revenue streams. The residential sector is the primary end-user, fuelled by rising disposable incomes and housing construction.
- Dominant Region: Asia-Pacific
- Leading Application Segments: Furniture, Cabinet, Flooring
- Primary End-User: Residential Sector
- Growth Drivers:
- Asia-Pacific: Rapid urbanization, infrastructure development, rising disposable incomes.
- Furniture: Increasing demand for affordable and versatile furniture.
- Residential: Growth in housing construction, particularly in developing economies.
MDF Industry Product Developments
Recent years have witnessed significant innovations in MDF technology, focusing on improved performance characteristics and sustainable manufacturing. Manufacturers are introducing high-density MDF for demanding applications, moisture-resistant MDF for outdoor use, and fire-retardant MDF for safety-critical environments. These advancements expand the applications of MDF beyond traditional uses and create new market opportunities. The focus on sustainability has led to the development of MDF boards from recycled wood fiber and other renewable resources, enhancing the product's environmental credentials.
Challenges in the MDF Industry Market
The MDF industry faces several challenges, including fluctuating raw material prices, supply chain disruptions, and increasing environmental regulations. These factors can significantly impact production costs and profitability. Intense competition from substitute products and the need for continuous innovation to maintain a competitive edge also pose significant challenges. The increasing costs associated with sustainable practices further impact the cost of production and final product price.
Forces Driving MDF Industry Growth
Several factors are driving the growth of the MDF industry, including rising construction activity globally, increased demand for furniture, and the growing popularity of MDF in various applications. Technological advancements leading to improved product quality and functionality are also strong growth catalysts. Favorable government policies supporting the forestry sector and sustainable wood usage further accelerate market expansion.
Challenges in the MDF Industry Market
Long-term growth hinges on continued innovation in product development and manufacturing processes, strategic partnerships to secure raw material supply, and expansion into new markets with high growth potential. Sustainability initiatives and environmentally friendly manufacturing practices will be increasingly important for maintaining market share and attracting environmentally conscious consumers.
Emerging Opportunities in MDF Industry
Emerging opportunities include the expansion into new and specialized applications, such as automotive interiors and high-tech components. The development of eco-friendly MDF using recycled materials and sustainable forestry practices presents significant growth prospects. Targeting niche markets with specialized products and focusing on value-added services will also provide attractive opportunities for market expansion.
Leading Players in the MDF Industry Sector
- Weyerhaeuser Company
- Kastamonu Entegre
- Fantoni Spa
- Nelson Pine Industries Limited
- Kronoplus Limited
- Korosten MDF Manufacture
- EGGER Group
- Dexco
- ARAUCO
- West Fraser
- SWISS KRONO
- Roseburg
- Masisa
- Eucatex
- Sonae Arauco
- DAIKEN CORPORATION
Key Milestones in MDF Industry Industry
- June 2022: Kronoplus invested USD 473.26 Million to build a new manufacturing facility in Tortosa, Spain, with a planned production of 720,000 m³/year. This significantly expands Kronoplus's MDF production capacity.
- January 2022: Kastamonu introduced new decors for its Evogloss line of MDF boards, enhancing its product portfolio and competitiveness in the decorative panel market.
Strategic Outlook for MDF Industry Market
The MDF industry is poised for continued growth, driven by robust demand from key end-use sectors and ongoing product innovation. Strategic opportunities exist in expanding into emerging markets, focusing on sustainable manufacturing practices, and developing specialized MDF products to cater to niche market requirements. Companies that embrace innovation, sustainable practices, and efficient supply chain management will be best positioned to capitalize on future market opportunities and achieve sustainable growth.
MDF Industry Segmentation
-
1. Application
- 1.1. Cabinet
- 1.2. Flooring
- 1.3. Furniture
- 1.4. Molding, Door, and Millwork
- 1.5. Packaging System
- 1.6. Other Applications
-
2. End-user Sector
- 2.1. Residential
- 2.2. Commercial
- 2.3. Institutional
MDF Industry Segmentation By Geography
-
1. Asia Pacific
- 1.1. China
- 1.2. India
- 1.3. Japan
- 1.4. South Korea
- 1.5. Vietnam
- 1.6. Rest of Asia Pacific
-
2. North America
- 2.1. United States
- 2.2. Canada
- 2.3. Mexico
-
3. Europe
- 3.1. Germany
- 3.2. United Kingdom
- 3.3. Italy
- 3.4. France
- 3.5. Rest of Europe
-
4. South America
- 4.1. Brazil
- 4.2. Argentina
- 4.3. Rest of South America
-
5. Middle East and Africa
- 5.1. Saudi Arabia
- 5.2. South Africa
- 5.3. Rest of Middle East and Africa
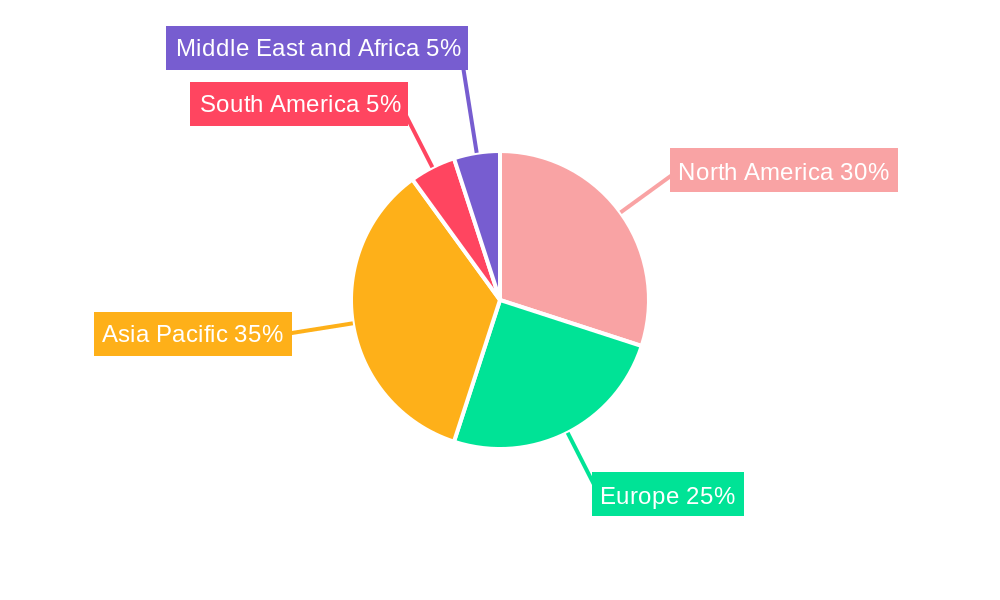
MDF Industry Regional Market Share
Geographic Coverage of MDF Industry
MDF Industry REPORT HIGHLIGHTS
| Aspects | Details |
|---|---|
| Study Period | 2020-2034 |
| Base Year | 2025 |
| Estimated Year | 2026 |
| Forecast Period | 2026-2034 |
| Historical Period | 2020-2025 |
| Growth Rate | CAGR of 5.6% from 2020-2034 |
| Segmentation |
|
Table of Contents
- 1. Introduction
- 1.1. Research Scope
- 1.2. Market Segmentation
- 1.3. Research Objective
- 1.4. Definitions and Assumptions
- 2. Executive Summary
- 2.1. Market Snapshot
- 3. Market Dynamics
- 3.1. Market Drivers
- 3.2. Market Restrains
- 3.3. Market Trends
- 3.4. Market Opportunities
- 4. Market Factor Analysis
- 4.1. Porters Five Forces
- 4.1.1. Bargaining Power of Suppliers
- 4.1.2. Bargaining Power of Buyers
- 4.1.3. Threat of New Entrants
- 4.1.4. Threat of Substitutes
- 4.1.5. Competitive Rivalry
- 4.2. PESTEL analysis
- 4.3. BCG Analysis
- 4.3.1. Stars (High Growth, High Market Share)
- 4.3.2. Cash Cows (Low Growth, High Market Share)
- 4.3.3. Question Mark (High Growth, Low Market Share)
- 4.3.4. Dogs (Low Growth, Low Market Share)
- 4.4. Ansoff Matrix Analysis
- 4.5. Supply Chain Analysis
- 4.6. Regulatory Landscape
- 4.7. Current Market Potential and Opportunity Assessment (TAM–SAM–SOM Framework)
- 4.8. MSR Analyst Note
- 4.1. Porters Five Forces
- 5. Market Analysis, Insights and Forecast 2021-2033
- 5.1. Market Analysis, Insights and Forecast - by Application
- 5.1.1. Cabinet
- 5.1.2. Flooring
- 5.1.3. Furniture
- 5.1.4. Molding, Door, and Millwork
- 5.1.5. Packaging System
- 5.1.6. Other Applications
- 5.2. Market Analysis, Insights and Forecast - by End-user Sector
- 5.2.1. Residential
- 5.2.2. Commercial
- 5.2.3. Institutional
- 5.3. Market Analysis, Insights and Forecast - by Region
- 5.3.1. Asia Pacific
- 5.3.2. North America
- 5.3.3. Europe
- 5.3.4. South America
- 5.3.5. Middle East and Africa
- 5.1. Market Analysis, Insights and Forecast - by Application
- 6. Global MDF Industry Analysis, Insights and Forecast, 2021-2033
- 6.1. Market Analysis, Insights and Forecast - by Application
- 6.1.1. Cabinet
- 6.1.2. Flooring
- 6.1.3. Furniture
- 6.1.4. Molding, Door, and Millwork
- 6.1.5. Packaging System
- 6.1.6. Other Applications
- 6.2. Market Analysis, Insights and Forecast - by End-user Sector
- 6.2.1. Residential
- 6.2.2. Commercial
- 6.2.3. Institutional
- 6.1. Market Analysis, Insights and Forecast - by Application
- 7. Asia Pacific MDF Industry Analysis, Insights and Forecast, 2020-2032
- 7.1. Market Analysis, Insights and Forecast - by Application
- 7.1.1. Cabinet
- 7.1.2. Flooring
- 7.1.3. Furniture
- 7.1.4. Molding, Door, and Millwork
- 7.1.5. Packaging System
- 7.1.6. Other Applications
- 7.2. Market Analysis, Insights and Forecast - by End-user Sector
- 7.2.1. Residential
- 7.2.2. Commercial
- 7.2.3. Institutional
- 7.1. Market Analysis, Insights and Forecast - by Application
- 8. North America MDF Industry Analysis, Insights and Forecast, 2020-2032
- 8.1. Market Analysis, Insights and Forecast - by Application
- 8.1.1. Cabinet
- 8.1.2. Flooring
- 8.1.3. Furniture
- 8.1.4. Molding, Door, and Millwork
- 8.1.5. Packaging System
- 8.1.6. Other Applications
- 8.2. Market Analysis, Insights and Forecast - by End-user Sector
- 8.2.1. Residential
- 8.2.2. Commercial
- 8.2.3. Institutional
- 8.1. Market Analysis, Insights and Forecast - by Application
- 9. Europe MDF Industry Analysis, Insights and Forecast, 2020-2032
- 9.1. Market Analysis, Insights and Forecast - by Application
- 9.1.1. Cabinet
- 9.1.2. Flooring
- 9.1.3. Furniture
- 9.1.4. Molding, Door, and Millwork
- 9.1.5. Packaging System
- 9.1.6. Other Applications
- 9.2. Market Analysis, Insights and Forecast - by End-user Sector
- 9.2.1. Residential
- 9.2.2. Commercial
- 9.2.3. Institutional
- 9.1. Market Analysis, Insights and Forecast - by Application
- 10. South America MDF Industry Analysis, Insights and Forecast, 2020-2032
- 10.1. Market Analysis, Insights and Forecast - by Application
- 10.1.1. Cabinet
- 10.1.2. Flooring
- 10.1.3. Furniture
- 10.1.4. Molding, Door, and Millwork
- 10.1.5. Packaging System
- 10.1.6. Other Applications
- 10.2. Market Analysis, Insights and Forecast - by End-user Sector
- 10.2.1. Residential
- 10.2.2. Commercial
- 10.2.3. Institutional
- 10.1. Market Analysis, Insights and Forecast - by Application
- 11. Middle East and Africa MDF Industry Analysis, Insights and Forecast, 2020-2032
- 11.1. Market Analysis, Insights and Forecast - by Application
- 11.1.1. Cabinet
- 11.1.2. Flooring
- 11.1.3. Furniture
- 11.1.4. Molding, Door, and Millwork
- 11.1.5. Packaging System
- 11.1.6. Other Applications
- 11.2. Market Analysis, Insights and Forecast - by End-user Sector
- 11.2.1. Residential
- 11.2.2. Commercial
- 11.2.3. Institutional
- 11.1. Market Analysis, Insights and Forecast - by Application
- 12. Competitive Analysis
- 12.1. Company Profiles
- 12.1.1 Weyerhaeuser Company*List Not Exhaustive
- 12.1.1.1. Company Overview
- 12.1.1.2. Products
- 12.1.1.3. Company Financials
- 12.1.1.4. SWOT Analysis
- 12.1.2 Kastamonu Entegre
- 12.1.2.1. Company Overview
- 12.1.2.2. Products
- 12.1.2.3. Company Financials
- 12.1.2.4. SWOT Analysis
- 12.1.3 Fantoni Spa
- 12.1.3.1. Company Overview
- 12.1.3.2. Products
- 12.1.3.3. Company Financials
- 12.1.3.4. SWOT Analysis
- 12.1.4 Nelson Pine Industries Limited
- 12.1.4.1. Company Overview
- 12.1.4.2. Products
- 12.1.4.3. Company Financials
- 12.1.4.4. SWOT Analysis
- 12.1.5 Kronoplus Limited
- 12.1.5.1. Company Overview
- 12.1.5.2. Products
- 12.1.5.3. Company Financials
- 12.1.5.4. SWOT Analysis
- 12.1.6 Korosten MDF Manufacture
- 12.1.6.1. Company Overview
- 12.1.6.2. Products
- 12.1.6.3. Company Financials
- 12.1.6.4. SWOT Analysis
- 12.1.7 EGGER Group
- 12.1.7.1. Company Overview
- 12.1.7.2. Products
- 12.1.7.3. Company Financials
- 12.1.7.4. SWOT Analysis
- 12.1.8 Dexco
- 12.1.8.1. Company Overview
- 12.1.8.2. Products
- 12.1.8.3. Company Financials
- 12.1.8.4. SWOT Analysis
- 12.1.9 ARAUCO
- 12.1.9.1. Company Overview
- 12.1.9.2. Products
- 12.1.9.3. Company Financials
- 12.1.9.4. SWOT Analysis
- 12.1.10 West Fraser
- 12.1.10.1. Company Overview
- 12.1.10.2. Products
- 12.1.10.3. Company Financials
- 12.1.10.4. SWOT Analysis
- 12.1.11 SWISS KRONO
- 12.1.11.1. Company Overview
- 12.1.11.2. Products
- 12.1.11.3. Company Financials
- 12.1.11.4. SWOT Analysis
- 12.1.12 Roseburg
- 12.1.12.1. Company Overview
- 12.1.12.2. Products
- 12.1.12.3. Company Financials
- 12.1.12.4. SWOT Analysis
- 12.1.13 Masisa
- 12.1.13.1. Company Overview
- 12.1.13.2. Products
- 12.1.13.3. Company Financials
- 12.1.13.4. SWOT Analysis
- 12.1.14 Eucatex
- 12.1.14.1. Company Overview
- 12.1.14.2. Products
- 12.1.14.3. Company Financials
- 12.1.14.4. SWOT Analysis
- 12.1.15 Sonae Arauco
- 12.1.15.1. Company Overview
- 12.1.15.2. Products
- 12.1.15.3. Company Financials
- 12.1.15.4. SWOT Analysis
- 12.1.16 DAIKEN CORPORATION
- 12.1.16.1. Company Overview
- 12.1.16.2. Products
- 12.1.16.3. Company Financials
- 12.1.16.4. SWOT Analysis
- 12.1.1 Weyerhaeuser Company*List Not Exhaustive
- 12.2. Market Entropy
- 12.2.1 Company's Key Areas Served
- 12.2.2 Recent Developments
- 12.3. Company Market Share Analysis 2025
- 12.3.1 Top 5 Companies Market Share Analysis
- 12.3.2 Top 3 Companies Market Share Analysis
- 12.4. List of Potential Customers
- 13. Research Methodology
List of Figures
- Figure 1: Global MDF Industry Revenue Breakdown (billion, %) by Region 2025 & 2033
- Figure 2: Global MDF Industry Volume Breakdown (Million, %) by Region 2025 & 2033
- Figure 3: Asia Pacific MDF Industry Revenue (billion), by Application 2025 & 2033
- Figure 4: Asia Pacific MDF Industry Volume (Million), by Application 2025 & 2033
- Figure 5: Asia Pacific MDF Industry Revenue Share (%), by Application 2025 & 2033
- Figure 6: Asia Pacific MDF Industry Volume Share (%), by Application 2025 & 2033
- Figure 7: Asia Pacific MDF Industry Revenue (billion), by End-user Sector 2025 & 2033
- Figure 8: Asia Pacific MDF Industry Volume (Million), by End-user Sector 2025 & 2033
- Figure 9: Asia Pacific MDF Industry Revenue Share (%), by End-user Sector 2025 & 2033
- Figure 10: Asia Pacific MDF Industry Volume Share (%), by End-user Sector 2025 & 2033
- Figure 11: Asia Pacific MDF Industry Revenue (billion), by Country 2025 & 2033
- Figure 12: Asia Pacific MDF Industry Volume (Million), by Country 2025 & 2033
- Figure 13: Asia Pacific MDF Industry Revenue Share (%), by Country 2025 & 2033
- Figure 14: Asia Pacific MDF Industry Volume Share (%), by Country 2025 & 2033
- Figure 15: North America MDF Industry Revenue (billion), by Application 2025 & 2033
- Figure 16: North America MDF Industry Volume (Million), by Application 2025 & 2033
- Figure 17: North America MDF Industry Revenue Share (%), by Application 2025 & 2033
- Figure 18: North America MDF Industry Volume Share (%), by Application 2025 & 2033
- Figure 19: North America MDF Industry Revenue (billion), by End-user Sector 2025 & 2033
- Figure 20: North America MDF Industry Volume (Million), by End-user Sector 2025 & 2033
- Figure 21: North America MDF Industry Revenue Share (%), by End-user Sector 2025 & 2033
- Figure 22: North America MDF Industry Volume Share (%), by End-user Sector 2025 & 2033
- Figure 23: North America MDF Industry Revenue (billion), by Country 2025 & 2033
- Figure 24: North America MDF Industry Volume (Million), by Country 2025 & 2033
- Figure 25: North America MDF Industry Revenue Share (%), by Country 2025 & 2033
- Figure 26: North America MDF Industry Volume Share (%), by Country 2025 & 2033
- Figure 27: Europe MDF Industry Revenue (billion), by Application 2025 & 2033
- Figure 28: Europe MDF Industry Volume (Million), by Application 2025 & 2033
- Figure 29: Europe MDF Industry Revenue Share (%), by Application 2025 & 2033
- Figure 30: Europe MDF Industry Volume Share (%), by Application 2025 & 2033
- Figure 31: Europe MDF Industry Revenue (billion), by End-user Sector 2025 & 2033
- Figure 32: Europe MDF Industry Volume (Million), by End-user Sector 2025 & 2033
- Figure 33: Europe MDF Industry Revenue Share (%), by End-user Sector 2025 & 2033
- Figure 34: Europe MDF Industry Volume Share (%), by End-user Sector 2025 & 2033
- Figure 35: Europe MDF Industry Revenue (billion), by Country 2025 & 2033
- Figure 36: Europe MDF Industry Volume (Million), by Country 2025 & 2033
- Figure 37: Europe MDF Industry Revenue Share (%), by Country 2025 & 2033
- Figure 38: Europe MDF Industry Volume Share (%), by Country 2025 & 2033
- Figure 39: South America MDF Industry Revenue (billion), by Application 2025 & 2033
- Figure 40: South America MDF Industry Volume (Million), by Application 2025 & 2033
- Figure 41: South America MDF Industry Revenue Share (%), by Application 2025 & 2033
- Figure 42: South America MDF Industry Volume Share (%), by Application 2025 & 2033
- Figure 43: South America MDF Industry Revenue (billion), by End-user Sector 2025 & 2033
- Figure 44: South America MDF Industry Volume (Million), by End-user Sector 2025 & 2033
- Figure 45: South America MDF Industry Revenue Share (%), by End-user Sector 2025 & 2033
- Figure 46: South America MDF Industry Volume Share (%), by End-user Sector 2025 & 2033
- Figure 47: South America MDF Industry Revenue (billion), by Country 2025 & 2033
- Figure 48: South America MDF Industry Volume (Million), by Country 2025 & 2033
- Figure 49: South America MDF Industry Revenue Share (%), by Country 2025 & 2033
- Figure 50: South America MDF Industry Volume Share (%), by Country 2025 & 2033
- Figure 51: Middle East and Africa MDF Industry Revenue (billion), by Application 2025 & 2033
- Figure 52: Middle East and Africa MDF Industry Volume (Million), by Application 2025 & 2033
- Figure 53: Middle East and Africa MDF Industry Revenue Share (%), by Application 2025 & 2033
- Figure 54: Middle East and Africa MDF Industry Volume Share (%), by Application 2025 & 2033
- Figure 55: Middle East and Africa MDF Industry Revenue (billion), by End-user Sector 2025 & 2033
- Figure 56: Middle East and Africa MDF Industry Volume (Million), by End-user Sector 2025 & 2033
- Figure 57: Middle East and Africa MDF Industry Revenue Share (%), by End-user Sector 2025 & 2033
- Figure 58: Middle East and Africa MDF Industry Volume Share (%), by End-user Sector 2025 & 2033
- Figure 59: Middle East and Africa MDF Industry Revenue (billion), by Country 2025 & 2033
- Figure 60: Middle East and Africa MDF Industry Volume (Million), by Country 2025 & 2033
- Figure 61: Middle East and Africa MDF Industry Revenue Share (%), by Country 2025 & 2033
- Figure 62: Middle East and Africa MDF Industry Volume Share (%), by Country 2025 & 2033
List of Tables
- Table 1: Global MDF Industry Revenue billion Forecast, by Application 2020 & 2033
- Table 2: Global MDF Industry Volume Million Forecast, by Application 2020 & 2033
- Table 3: Global MDF Industry Revenue billion Forecast, by End-user Sector 2020 & 2033
- Table 4: Global MDF Industry Volume Million Forecast, by End-user Sector 2020 & 2033
- Table 5: Global MDF Industry Revenue billion Forecast, by Region 2020 & 2033
- Table 6: Global MDF Industry Volume Million Forecast, by Region 2020 & 2033
- Table 7: Global MDF Industry Revenue billion Forecast, by Application 2020 & 2033
- Table 8: Global MDF Industry Volume Million Forecast, by Application 2020 & 2033
- Table 9: Global MDF Industry Revenue billion Forecast, by End-user Sector 2020 & 2033
- Table 10: Global MDF Industry Volume Million Forecast, by End-user Sector 2020 & 2033
- Table 11: Global MDF Industry Revenue billion Forecast, by Country 2020 & 2033
- Table 12: Global MDF Industry Volume Million Forecast, by Country 2020 & 2033
- Table 13: China MDF Industry Revenue (billion) Forecast, by Application 2020 & 2033
- Table 14: China MDF Industry Volume (Million) Forecast, by Application 2020 & 2033
- Table 15: India MDF Industry Revenue (billion) Forecast, by Application 2020 & 2033
- Table 16: India MDF Industry Volume (Million) Forecast, by Application 2020 & 2033
- Table 17: Japan MDF Industry Revenue (billion) Forecast, by Application 2020 & 2033
- Table 18: Japan MDF Industry Volume (Million) Forecast, by Application 2020 & 2033
- Table 19: South Korea MDF Industry Revenue (billion) Forecast, by Application 2020 & 2033
- Table 20: South Korea MDF Industry Volume (Million) Forecast, by Application 2020 & 2033
- Table 21: Vietnam MDF Industry Revenue (billion) Forecast, by Application 2020 & 2033
- Table 22: Vietnam MDF Industry Volume (Million) Forecast, by Application 2020 & 2033
- Table 23: Rest of Asia Pacific MDF Industry Revenue (billion) Forecast, by Application 2020 & 2033
- Table 24: Rest of Asia Pacific MDF Industry Volume (Million) Forecast, by Application 2020 & 2033
- Table 25: Global MDF Industry Revenue billion Forecast, by Application 2020 & 2033
- Table 26: Global MDF Industry Volume Million Forecast, by Application 2020 & 2033
- Table 27: Global MDF Industry Revenue billion Forecast, by End-user Sector 2020 & 2033
- Table 28: Global MDF Industry Volume Million Forecast, by End-user Sector 2020 & 2033
- Table 29: Global MDF Industry Revenue billion Forecast, by Country 2020 & 2033
- Table 30: Global MDF Industry Volume Million Forecast, by Country 2020 & 2033
- Table 31: United States MDF Industry Revenue (billion) Forecast, by Application 2020 & 2033
- Table 32: United States MDF Industry Volume (Million) Forecast, by Application 2020 & 2033
- Table 33: Canada MDF Industry Revenue (billion) Forecast, by Application 2020 & 2033
- Table 34: Canada MDF Industry Volume (Million) Forecast, by Application 2020 & 2033
- Table 35: Mexico MDF Industry Revenue (billion) Forecast, by Application 2020 & 2033
- Table 36: Mexico MDF Industry Volume (Million) Forecast, by Application 2020 & 2033
- Table 37: Global MDF Industry Revenue billion Forecast, by Application 2020 & 2033
- Table 38: Global MDF Industry Volume Million Forecast, by Application 2020 & 2033
- Table 39: Global MDF Industry Revenue billion Forecast, by End-user Sector 2020 & 2033
- Table 40: Global MDF Industry Volume Million Forecast, by End-user Sector 2020 & 2033
- Table 41: Global MDF Industry Revenue billion Forecast, by Country 2020 & 2033
- Table 42: Global MDF Industry Volume Million Forecast, by Country 2020 & 2033
- Table 43: Germany MDF Industry Revenue (billion) Forecast, by Application 2020 & 2033
- Table 44: Germany MDF Industry Volume (Million) Forecast, by Application 2020 & 2033
- Table 45: United Kingdom MDF Industry Revenue (billion) Forecast, by Application 2020 & 2033
- Table 46: United Kingdom MDF Industry Volume (Million) Forecast, by Application 2020 & 2033
- Table 47: Italy MDF Industry Revenue (billion) Forecast, by Application 2020 & 2033
- Table 48: Italy MDF Industry Volume (Million) Forecast, by Application 2020 & 2033
- Table 49: France MDF Industry Revenue (billion) Forecast, by Application 2020 & 2033
- Table 50: France MDF Industry Volume (Million) Forecast, by Application 2020 & 2033
- Table 51: Rest of Europe MDF Industry Revenue (billion) Forecast, by Application 2020 & 2033
- Table 52: Rest of Europe MDF Industry Volume (Million) Forecast, by Application 2020 & 2033
- Table 53: Global MDF Industry Revenue billion Forecast, by Application 2020 & 2033
- Table 54: Global MDF Industry Volume Million Forecast, by Application 2020 & 2033
- Table 55: Global MDF Industry Revenue billion Forecast, by End-user Sector 2020 & 2033
- Table 56: Global MDF Industry Volume Million Forecast, by End-user Sector 2020 & 2033
- Table 57: Global MDF Industry Revenue billion Forecast, by Country 2020 & 2033
- Table 58: Global MDF Industry Volume Million Forecast, by Country 2020 & 2033
- Table 59: Brazil MDF Industry Revenue (billion) Forecast, by Application 2020 & 2033
- Table 60: Brazil MDF Industry Volume (Million) Forecast, by Application 2020 & 2033
- Table 61: Argentina MDF Industry Revenue (billion) Forecast, by Application 2020 & 2033
- Table 62: Argentina MDF Industry Volume (Million) Forecast, by Application 2020 & 2033
- Table 63: Rest of South America MDF Industry Revenue (billion) Forecast, by Application 2020 & 2033
- Table 64: Rest of South America MDF Industry Volume (Million) Forecast, by Application 2020 & 2033
- Table 65: Global MDF Industry Revenue billion Forecast, by Application 2020 & 2033
- Table 66: Global MDF Industry Volume Million Forecast, by Application 2020 & 2033
- Table 67: Global MDF Industry Revenue billion Forecast, by End-user Sector 2020 & 2033
- Table 68: Global MDF Industry Volume Million Forecast, by End-user Sector 2020 & 2033
- Table 69: Global MDF Industry Revenue billion Forecast, by Country 2020 & 2033
- Table 70: Global MDF Industry Volume Million Forecast, by Country 2020 & 2033
- Table 71: Saudi Arabia MDF Industry Revenue (billion) Forecast, by Application 2020 & 2033
- Table 72: Saudi Arabia MDF Industry Volume (Million) Forecast, by Application 2020 & 2033
- Table 73: South Africa MDF Industry Revenue (billion) Forecast, by Application 2020 & 2033
- Table 74: South Africa MDF Industry Volume (Million) Forecast, by Application 2020 & 2033
- Table 75: Rest of Middle East and Africa MDF Industry Revenue (billion) Forecast, by Application 2020 & 2033
- Table 76: Rest of Middle East and Africa MDF Industry Volume (Million) Forecast, by Application 2020 & 2033
Frequently Asked Questions
1. What is the projected Compound Annual Growth Rate (CAGR) of the MDF Industry?
The projected CAGR is approximately 5.6%.
2. Which companies are prominent players in the MDF Industry?
Key companies in the market include Weyerhaeuser Company*List Not Exhaustive, Kastamonu Entegre, Fantoni Spa, Nelson Pine Industries Limited, Kronoplus Limited, Korosten MDF Manufacture, EGGER Group, Dexco, ARAUCO, West Fraser, SWISS KRONO, Roseburg, Masisa, Eucatex, Sonae Arauco, DAIKEN CORPORATION.
3. What are the main segments of the MDF Industry?
The market segments include Application, End-user Sector.
4. Can you provide details about the market size?
The market size is estimated to be USD 44.84 billion as of 2022.
5. What are some drivers contributing to market growth?
Increase in the Demand for MDF for Furniture; Easy Availability of Raw Materials; Expansion of the Residential Sector.
6. What are the notable trends driving market growth?
Increase Demand for Furniture in Residential Sector..
7. Are there any restraints impacting market growth?
Stringent Government Regulations; Presence of Product Substitutes.
8. Can you provide examples of recent developments in the market?
In June 2022, Kronoplus invested EUR 400 million (USD 473.26 million) to build a new manufacturing facility for wood-based panels with a planned production of 720,000 m³/year covering 25 hectares in Tortosa. This will enhance the company's business in medium density fiberboard (MDF) market.
9. What pricing options are available for accessing the report?
Pricing options include single-user, multi-user, and enterprise licenses priced at USD 4750, USD 5250, and USD 8750 respectively.
10. Is the market size provided in terms of value or volume?
The market size is provided in terms of value, measured in billion and volume, measured in Million.
11. Are there any specific market keywords associated with the report?
Yes, the market keyword associated with the report is "MDF Industry," which aids in identifying and referencing the specific market segment covered.
12. How do I determine which pricing option suits my needs best?
The pricing options vary based on user requirements and access needs. Individual users may opt for single-user licenses, while businesses requiring broader access may choose multi-user or enterprise licenses for cost-effective access to the report.
13. Are there any additional resources or data provided in the MDF Industry report?
While the report offers comprehensive insights, it's advisable to review the specific contents or supplementary materials provided to ascertain if additional resources or data are available.
14. How can I stay updated on further developments or reports in the MDF Industry?
To stay informed about further developments, trends, and reports in the MDF Industry, consider subscribing to industry newsletters, following relevant companies and organizations, or regularly checking reputable industry news sources and publications.
Methodology
Step 1 - Identification of Relevant Samples Size from Population Database


Step 2 - Approaches for Defining Global Market Size (Value, Volume* & Price*)

Note*: In applicable scenarios
Step 3 - Data Sources
Primary Research
- Web Analytics
- Survey Reports
- Research Institute
- Latest Research Reports
- Opinion Leaders
Secondary Research
- Annual Reports
- White Paper
- Latest Press Release
- Industry Association
- Paid Database
- Investor Presentations

Step 4 - Data Triangulation
Involves using different sources of information in order to increase the validity of a study
These sources are likely to be stakeholders in a program - participants, other researchers, program staff, other community members, and so on.
Then we put all data in single framework & apply various statistical tools to find out the dynamic on the market.
During the analysis stage, feedback from the stakeholder groups would be compared to determine areas of agreement as well as areas of divergence