

Key Insights
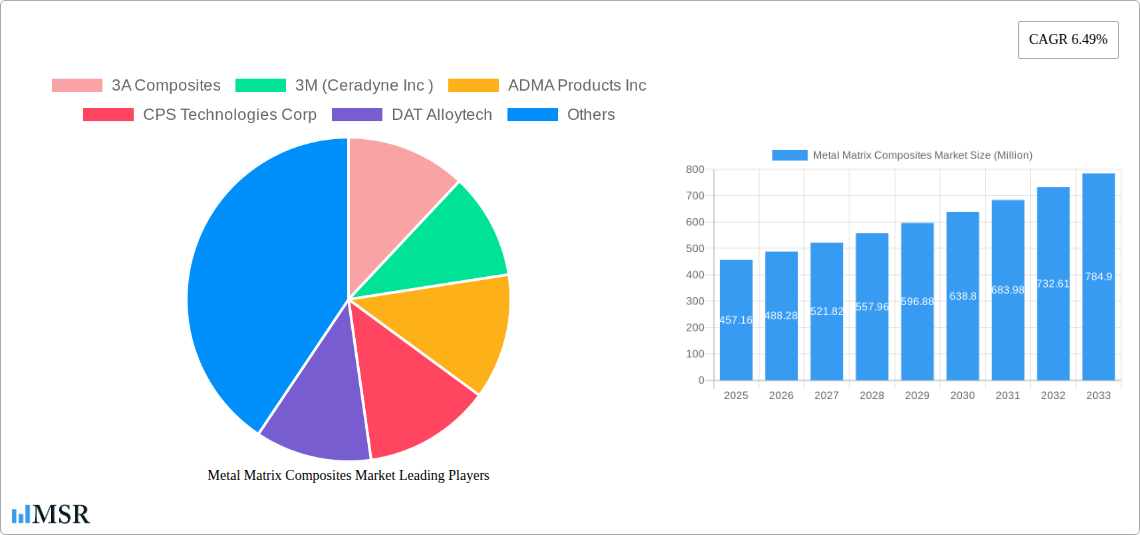
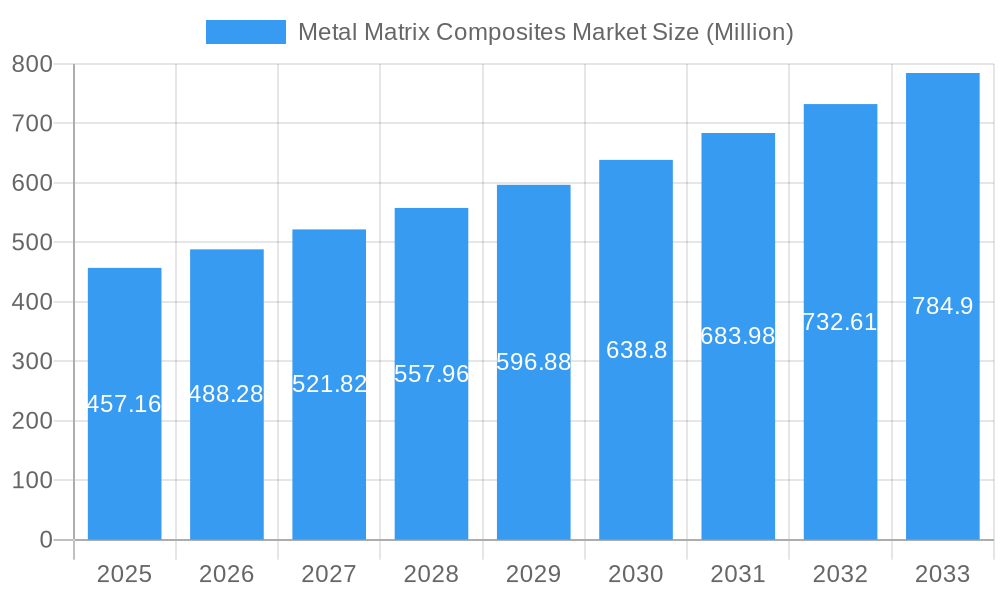
The Metal Matrix Composites (MMCs) market, valued at $457.16 million in 2025, is projected to experience robust growth, driven by increasing demand across diverse sectors like aerospace, automotive, and electronics. A Compound Annual Growth Rate (CAGR) of 6.49% from 2025 to 2033 signifies a significant expansion, fueled by several key factors. The rising adoption of MMCs in lightweighting applications, particularly in the automotive and aerospace industries aiming for improved fuel efficiency and performance, is a major driver. Furthermore, advancements in manufacturing techniques, enabling greater precision and cost-effectiveness, are contributing to market expansion. The increasing preference for high-strength, high-temperature resistant materials in demanding environments further bolsters the market's growth trajectory. While challenges exist, such as the relatively high cost of MMCs compared to traditional materials and complexities associated with their manufacturing process, these are being mitigated through ongoing research and development efforts. The market is segmented by material type (aluminum, magnesium, titanium, etc.), application (aerospace, automotive, electronics, etc.), and region, with notable players like 3A Composites, 3M, and others actively shaping market competition through innovation and strategic partnerships.
Metal Matrix Composites Market Market Size (In Million)
Looking ahead, the MMC market is poised for continued expansion. The burgeoning adoption of electric vehicles (EVs) presents a significant opportunity, with MMCs offering lightweight and durable components for batteries and chassis. Furthermore, the growing demand for advanced materials in defense and space exploration applications will further stimulate growth. The ongoing focus on sustainability and reducing carbon emissions is also driving the adoption of MMCs as a more efficient and environmentally friendly alternative to traditional materials. However, the market's growth will be influenced by fluctuating raw material prices and potential supply chain disruptions. Companies are focusing on strategic collaborations, process optimization, and exploring novel MMC formulations to navigate these challenges and capitalize on future growth opportunities. The overall outlook for the Metal Matrix Composites market remains positive, with substantial growth potential across various segments and geographical regions.
Metal Matrix Composites Market Company Market Share
Unlock Growth Opportunities in the Booming Metal Matrix Composites Market: A Comprehensive Report (2019-2033)
This comprehensive report provides an in-depth analysis of the Metal Matrix Composites (MMCs) market, offering invaluable insights for industry stakeholders seeking to capitalize on its significant growth potential. Covering the period 2019-2033, with a focus on 2025, this report meticulously examines market dynamics, key players, emerging trends, and future opportunities. The global MMC market is projected to reach xx Million by 2033, exhibiting a CAGR of xx% during the forecast period (2025-2033).
Metal Matrix Composites Market Market Concentration & Dynamics
The Metal Matrix Composites market exhibits a moderately concentrated landscape, with a handful of major players holding significant market share. However, the presence of numerous smaller, specialized companies contributes to a dynamic competitive environment. Innovation plays a pivotal role, with ongoing R&D driving advancements in material properties and applications. Stringent regulatory frameworks, particularly concerning material safety and environmental impact, shape manufacturing practices. Substitute materials, such as traditional alloys, pose a competitive threat, though MMCs' superior strength-to-weight ratio and performance characteristics often outweigh this challenge. End-user trends in aerospace, automotive, and energy sectors are key drivers of market demand. Mergers and acquisitions (M&A) activity reflects the consolidation trend within the industry. In recent years, the number of M&A deals has averaged approximately xx per year, with a noticeable uptick in activity in 2021 and 2022.
- Market Share: Top 5 players hold approximately xx% of the market share.
- M&A Activity: An average of xx M&A deals annually, reflecting industry consolidation.
- Innovation Ecosystem: High level of R&D activity focused on enhancing material properties and expanding applications.
- Regulatory Landscape: Stringent safety and environmental regulations influencing manufacturing processes.
Metal Matrix Composites Market Industry Insights & Trends
The Metal Matrix Composites market is experiencing robust growth driven by several factors. The increasing demand from diverse sectors such as aerospace, automotive, and energy is a primary catalyst. Technological advancements leading to enhanced material properties, such as improved strength, stiffness, and thermal conductivity, are further bolstering market expansion. The rising adoption of lightweight materials to enhance fuel efficiency and reduce emissions in the automotive and aerospace industries is a key growth driver. Evolving consumer preferences for more durable and high-performance products are also driving demand. The global market size reached xx Million in 2024, and is expected to reach xx Million by 2025.
Key Markets & Segments Leading Metal Matrix Composites Market
The aerospace sector currently dominates the Metal Matrix Composites market, accounting for approximately xx% of global demand. This dominance is driven by the need for lightweight yet high-strength materials in aircraft and spacecraft construction. North America holds the largest regional market share, propelled by robust aerospace and automotive industries.
- Key Drivers for North America Dominance:
- Strong aerospace and automotive industries.
- Extensive R&D investments in materials science.
- Favorable government regulations and incentives.
- Key Drivers for Aerospace Sector Dominance:
- Need for lightweight, high-strength materials.
- Stringent safety and performance requirements.
- Continuous innovation in aircraft and spacecraft design.
Metal Matrix Composites Market Product Developments
Recent advancements in metal matrix composite technology have focused on improving material properties, expanding applications, and optimizing manufacturing processes. Innovations include the development of novel matrix alloys, reinforced materials with enhanced strength and durability, and cost-effective manufacturing techniques. These advancements have enabled the use of MMCs in a wider range of applications, from high-performance automotive parts to advanced aerospace components, providing manufacturers with a clear competitive edge.
Challenges in the Metal Matrix Composites Market Market
The Metal Matrix Composites market faces several challenges. High manufacturing costs associated with complex processing techniques can hinder market penetration. Supply chain disruptions impacting the availability of raw materials represent another significant obstacle. Intense competition from substitute materials, coupled with fluctuating raw material prices, further complicates market dynamics. These factors can collectively impact the overall profitability and growth trajectory of the MMC industry.
Forces Driving Metal Matrix Composites Market Growth
Several key factors are fueling the growth of the Metal Matrix Composites market. The rising demand for lightweight and high-strength materials in aerospace, automotive, and energy industries acts as a significant growth driver. Technological advancements in manufacturing processes lead to improved material properties and lower production costs, enhancing market competitiveness. Favorable government regulations and incentives aimed at promoting the use of advanced materials further stimulate market expansion.
Challenges in the Metal Matrix Composites Market Market
Long-term growth in the Metal Matrix Composites market hinges on overcoming existing challenges and capitalizing on emerging opportunities. Continued R&D investment in enhancing material properties and expanding applications will be crucial. Strategic partnerships between materials producers, manufacturers, and end-users will help to accelerate market penetration. Expansion into new markets, particularly in developing economies with growing industrial sectors, will be instrumental in driving long-term market growth.
Emerging Opportunities in Metal Matrix Composites Market
Emerging opportunities in the Metal Matrix Composites market include the growing adoption of MMCs in renewable energy applications, such as wind turbine blades and solar panels. Advances in additive manufacturing (3D printing) offer the potential for customized MMC components with complex geometries. Increasing demand for lightweight and high-strength materials in the defense and sporting goods industries presents further growth potential.
Leading Players in the Metal Matrix Composites Market Sector
- 3A Composites
- 3M (Ceradyne Inc)
- ADMA Products Inc
- CPS Technologies Corp
- DAT Alloytech
- Denka Company Limited
- GKN Sinter Metals Engineering GmbH
- Hitachi Metals Ltd
- Materion Corporation
- MTC Powder Solutions AB
- Plansee Group
- Sumitomo Electric Industries Ltd
- Thermal Transfer Composites LLC
- TISICS Ltd
Key Milestones in Metal Matrix Composites Market Industry
- January 2022: Plansee Group acquired Mi-Tech Tungsten Metals, expanding its North American market position for tungsten products. This strategic move enhanced Plansee's capabilities in supplying key raw materials for MMC production.
- March 2021: Alvant and 3M formed a strategic partnership to advance metal matrix composite technology for real-world applications. This collaboration combined Alvant's expertise in AMC manufacturing with 3M's extensive resources and market reach, accelerating innovation and market penetration.
Strategic Outlook for Metal Matrix Composites Market Market
The future of the Metal Matrix Composites market looks promising. Continued technological innovation, coupled with strategic partnerships and market expansion, will drive substantial growth. Focusing on cost reduction, enhancing material properties, and developing new applications will be vital for companies seeking to thrive in this competitive landscape. The market's long-term potential is significant, driven by the increasing demand for high-performance, lightweight materials across various industries.
Metal Matrix Composites Market Segmentation
-
1. Type
- 1.1. Nickel
- 1.2. Aluminium
- 1.3. Refractory
- 1.4. Other Types
-
2. Fillers
- 2.1. Silicon Carbide
- 2.2. Aluminum Oxide
- 2.3. Titanium Carbide
- 2.4. Other Fillers
-
3. End-user Industry
- 3.1. Automotive and Locomotive
- 3.2. Electrical and Electronics
- 3.3. Aerospace and Defense
- 3.4. Industrial
- 3.5. Other End-user Industries
Metal Matrix Composites Market Segmentation By Geography
-
1. Asia Pacific
- 1.1. China
- 1.2. India
- 1.3. Japan
- 1.4. South Korea
- 1.5. Rest of Asia Pacific
-
2. North America
- 2.1. United States
- 2.2. Canada
- 2.3. Mexico
-
3. Europe
- 3.1. Germany
- 3.2. United Kingdom
- 3.3. Italy
- 3.4. France
- 3.5. Spain
- 3.6. Rest of Europe
-
4. South America
- 4.1. Brazil
- 4.2. Argentina
- 4.3. Rest of South America
-
5. Middle East and Africa
- 5.1. Saudi Arabia
- 5.2. South Africa
- 5.3. Rest of Middle East and Africa
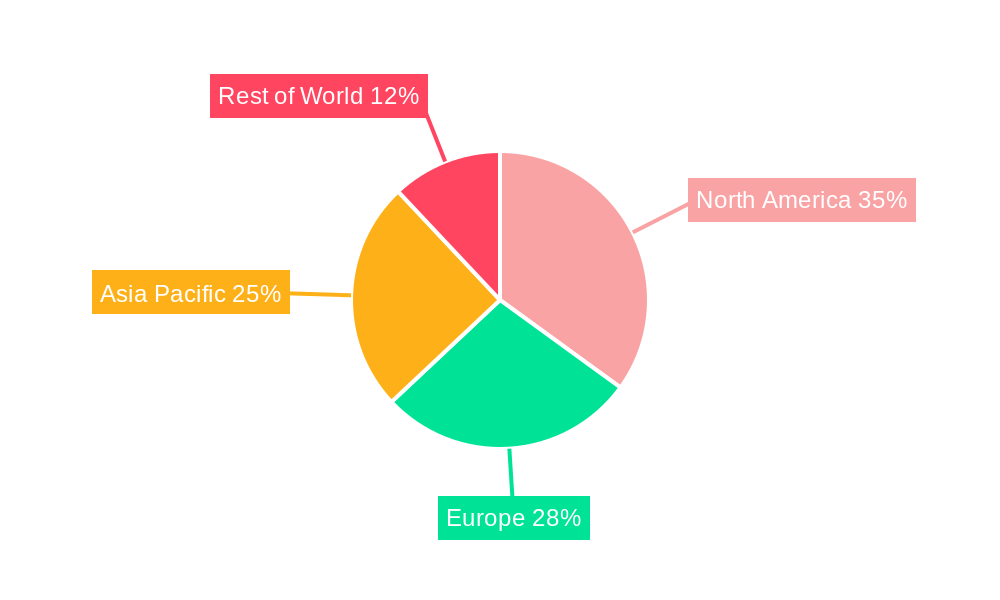
Metal Matrix Composites Market Regional Market Share
Geographic Coverage of Metal Matrix Composites Market
Metal Matrix Composites Market REPORT HIGHLIGHTS
| Aspects | Details |
|---|---|
| Study Period | 2020-2034 |
| Base Year | 2025 |
| Estimated Year | 2026 |
| Forecast Period | 2026-2034 |
| Historical Period | 2020-2025 |
| Growth Rate | CAGR of 6.49% from 2020-2034 |
| Segmentation |
|
Table of Contents
- 1. Introduction
- 1.1. Research Scope
- 1.2. Market Segmentation
- 1.3. Research Objective
- 1.4. Definitions and Assumptions
- 2. Executive Summary
- 2.1. Market Snapshot
- 3. Market Dynamics
- 3.1. Market Drivers
- 3.2. Market Restrains
- 3.3. Market Trends
- 3.4. Market Opportunities
- 4. Market Factor Analysis
- 4.1. Porters Five Forces
- 4.1.1. Bargaining Power of Suppliers
- 4.1.2. Bargaining Power of Buyers
- 4.1.3. Threat of New Entrants
- 4.1.4. Threat of Substitutes
- 4.1.5. Competitive Rivalry
- 4.2. PESTEL analysis
- 4.3. BCG Analysis
- 4.3.1. Stars (High Growth, High Market Share)
- 4.3.2. Cash Cows (Low Growth, High Market Share)
- 4.3.3. Question Mark (High Growth, Low Market Share)
- 4.3.4. Dogs (Low Growth, Low Market Share)
- 4.4. Ansoff Matrix Analysis
- 4.5. Supply Chain Analysis
- 4.6. Regulatory Landscape
- 4.7. Current Market Potential and Opportunity Assessment (TAM–SAM–SOM Framework)
- 4.8. MSR Analyst Note
- 4.1. Porters Five Forces
- 5. Market Analysis, Insights and Forecast 2021-2033
- 5.1. Market Analysis, Insights and Forecast - by Type
- 5.1.1. Nickel
- 5.1.2. Aluminium
- 5.1.3. Refractory
- 5.1.4. Other Types
- 5.2. Market Analysis, Insights and Forecast - by Fillers
- 5.2.1. Silicon Carbide
- 5.2.2. Aluminum Oxide
- 5.2.3. Titanium Carbide
- 5.2.4. Other Fillers
- 5.3. Market Analysis, Insights and Forecast - by End-user Industry
- 5.3.1. Automotive and Locomotive
- 5.3.2. Electrical and Electronics
- 5.3.3. Aerospace and Defense
- 5.3.4. Industrial
- 5.3.5. Other End-user Industries
- 5.4. Market Analysis, Insights and Forecast - by Region
- 5.4.1. Asia Pacific
- 5.4.2. North America
- 5.4.3. Europe
- 5.4.4. South America
- 5.4.5. Middle East and Africa
- 5.1. Market Analysis, Insights and Forecast - by Type
- 6. Global Metal Matrix Composites Market Analysis, Insights and Forecast, 2021-2033
- 6.1. Market Analysis, Insights and Forecast - by Type
- 6.1.1. Nickel
- 6.1.2. Aluminium
- 6.1.3. Refractory
- 6.1.4. Other Types
- 6.2. Market Analysis, Insights and Forecast - by Fillers
- 6.2.1. Silicon Carbide
- 6.2.2. Aluminum Oxide
- 6.2.3. Titanium Carbide
- 6.2.4. Other Fillers
- 6.3. Market Analysis, Insights and Forecast - by End-user Industry
- 6.3.1. Automotive and Locomotive
- 6.3.2. Electrical and Electronics
- 6.3.3. Aerospace and Defense
- 6.3.4. Industrial
- 6.3.5. Other End-user Industries
- 6.1. Market Analysis, Insights and Forecast - by Type
- 7. Asia Pacific Metal Matrix Composites Market Analysis, Insights and Forecast, 2020-2032
- 7.1. Market Analysis, Insights and Forecast - by Type
- 7.1.1. Nickel
- 7.1.2. Aluminium
- 7.1.3. Refractory
- 7.1.4. Other Types
- 7.2. Market Analysis, Insights and Forecast - by Fillers
- 7.2.1. Silicon Carbide
- 7.2.2. Aluminum Oxide
- 7.2.3. Titanium Carbide
- 7.2.4. Other Fillers
- 7.3. Market Analysis, Insights and Forecast - by End-user Industry
- 7.3.1. Automotive and Locomotive
- 7.3.2. Electrical and Electronics
- 7.3.3. Aerospace and Defense
- 7.3.4. Industrial
- 7.3.5. Other End-user Industries
- 7.1. Market Analysis, Insights and Forecast - by Type
- 8. North America Metal Matrix Composites Market Analysis, Insights and Forecast, 2020-2032
- 8.1. Market Analysis, Insights and Forecast - by Type
- 8.1.1. Nickel
- 8.1.2. Aluminium
- 8.1.3. Refractory
- 8.1.4. Other Types
- 8.2. Market Analysis, Insights and Forecast - by Fillers
- 8.2.1. Silicon Carbide
- 8.2.2. Aluminum Oxide
- 8.2.3. Titanium Carbide
- 8.2.4. Other Fillers
- 8.3. Market Analysis, Insights and Forecast - by End-user Industry
- 8.3.1. Automotive and Locomotive
- 8.3.2. Electrical and Electronics
- 8.3.3. Aerospace and Defense
- 8.3.4. Industrial
- 8.3.5. Other End-user Industries
- 8.1. Market Analysis, Insights and Forecast - by Type
- 9. Europe Metal Matrix Composites Market Analysis, Insights and Forecast, 2020-2032
- 9.1. Market Analysis, Insights and Forecast - by Type
- 9.1.1. Nickel
- 9.1.2. Aluminium
- 9.1.3. Refractory
- 9.1.4. Other Types
- 9.2. Market Analysis, Insights and Forecast - by Fillers
- 9.2.1. Silicon Carbide
- 9.2.2. Aluminum Oxide
- 9.2.3. Titanium Carbide
- 9.2.4. Other Fillers
- 9.3. Market Analysis, Insights and Forecast - by End-user Industry
- 9.3.1. Automotive and Locomotive
- 9.3.2. Electrical and Electronics
- 9.3.3. Aerospace and Defense
- 9.3.4. Industrial
- 9.3.5. Other End-user Industries
- 9.1. Market Analysis, Insights and Forecast - by Type
- 10. South America Metal Matrix Composites Market Analysis, Insights and Forecast, 2020-2032
- 10.1. Market Analysis, Insights and Forecast - by Type
- 10.1.1. Nickel
- 10.1.2. Aluminium
- 10.1.3. Refractory
- 10.1.4. Other Types
- 10.2. Market Analysis, Insights and Forecast - by Fillers
- 10.2.1. Silicon Carbide
- 10.2.2. Aluminum Oxide
- 10.2.3. Titanium Carbide
- 10.2.4. Other Fillers
- 10.3. Market Analysis, Insights and Forecast - by End-user Industry
- 10.3.1. Automotive and Locomotive
- 10.3.2. Electrical and Electronics
- 10.3.3. Aerospace and Defense
- 10.3.4. Industrial
- 10.3.5. Other End-user Industries
- 10.1. Market Analysis, Insights and Forecast - by Type
- 11. Middle East and Africa Metal Matrix Composites Market Analysis, Insights and Forecast, 2020-2032
- 11.1. Market Analysis, Insights and Forecast - by Type
- 11.1.1. Nickel
- 11.1.2. Aluminium
- 11.1.3. Refractory
- 11.1.4. Other Types
- 11.2. Market Analysis, Insights and Forecast - by Fillers
- 11.2.1. Silicon Carbide
- 11.2.2. Aluminum Oxide
- 11.2.3. Titanium Carbide
- 11.2.4. Other Fillers
- 11.3. Market Analysis, Insights and Forecast - by End-user Industry
- 11.3.1. Automotive and Locomotive
- 11.3.2. Electrical and Electronics
- 11.3.3. Aerospace and Defense
- 11.3.4. Industrial
- 11.3.5. Other End-user Industries
- 11.1. Market Analysis, Insights and Forecast - by Type
- 12. Competitive Analysis
- 12.1. Company Profiles
- 12.1.1 3A Composites
- 12.1.1.1. Company Overview
- 12.1.1.2. Products
- 12.1.1.3. Company Financials
- 12.1.1.4. SWOT Analysis
- 12.1.2 3M (Ceradyne Inc )
- 12.1.2.1. Company Overview
- 12.1.2.2. Products
- 12.1.2.3. Company Financials
- 12.1.2.4. SWOT Analysis
- 12.1.3 ADMA Products Inc
- 12.1.3.1. Company Overview
- 12.1.3.2. Products
- 12.1.3.3. Company Financials
- 12.1.3.4. SWOT Analysis
- 12.1.4 CPS Technologies Corp
- 12.1.4.1. Company Overview
- 12.1.4.2. Products
- 12.1.4.3. Company Financials
- 12.1.4.4. SWOT Analysis
- 12.1.5 DAT Alloytech
- 12.1.5.1. Company Overview
- 12.1.5.2. Products
- 12.1.5.3. Company Financials
- 12.1.5.4. SWOT Analysis
- 12.1.6 Denka Company Limited
- 12.1.6.1. Company Overview
- 12.1.6.2. Products
- 12.1.6.3. Company Financials
- 12.1.6.4. SWOT Analysis
- 12.1.7 GKN Sinter Metals Engineering GmbH
- 12.1.7.1. Company Overview
- 12.1.7.2. Products
- 12.1.7.3. Company Financials
- 12.1.7.4. SWOT Analysis
- 12.1.8 Hitachi Metals Ltd
- 12.1.8.1. Company Overview
- 12.1.8.2. Products
- 12.1.8.3. Company Financials
- 12.1.8.4. SWOT Analysis
- 12.1.9 Materion Corporation
- 12.1.9.1. Company Overview
- 12.1.9.2. Products
- 12.1.9.3. Company Financials
- 12.1.9.4. SWOT Analysis
- 12.1.10 MTC Powder Solutions AB
- 12.1.10.1. Company Overview
- 12.1.10.2. Products
- 12.1.10.3. Company Financials
- 12.1.10.4. SWOT Analysis
- 12.1.11 Plansee Group
- 12.1.11.1. Company Overview
- 12.1.11.2. Products
- 12.1.11.3. Company Financials
- 12.1.11.4. SWOT Analysis
- 12.1.12 Sumitomo Electric Industries Ltd
- 12.1.12.1. Company Overview
- 12.1.12.2. Products
- 12.1.12.3. Company Financials
- 12.1.12.4. SWOT Analysis
- 12.1.13 Thermal Transfer Composites LLC
- 12.1.13.1. Company Overview
- 12.1.13.2. Products
- 12.1.13.3. Company Financials
- 12.1.13.4. SWOT Analysis
- 12.1.14 TISICS Ltd*List Not Exhaustive
- 12.1.14.1. Company Overview
- 12.1.14.2. Products
- 12.1.14.3. Company Financials
- 12.1.14.4. SWOT Analysis
- 12.1.1 3A Composites
- 12.2. Market Entropy
- 12.2.1 Company's Key Areas Served
- 12.2.2 Recent Developments
- 12.3. Company Market Share Analysis 2025
- 12.3.1 Top 5 Companies Market Share Analysis
- 12.3.2 Top 3 Companies Market Share Analysis
- 12.4. List of Potential Customers
- 13. Research Methodology
List of Figures
- Figure 1: Global Metal Matrix Composites Market Revenue Breakdown (Million, %) by Region 2025 & 2033
- Figure 2: Global Metal Matrix Composites Market Volume Breakdown (Million, %) by Region 2025 & 2033
- Figure 3: Asia Pacific Metal Matrix Composites Market Revenue (Million), by Type 2025 & 2033
- Figure 4: Asia Pacific Metal Matrix Composites Market Volume (Million), by Type 2025 & 2033
- Figure 5: Asia Pacific Metal Matrix Composites Market Revenue Share (%), by Type 2025 & 2033
- Figure 6: Asia Pacific Metal Matrix Composites Market Volume Share (%), by Type 2025 & 2033
- Figure 7: Asia Pacific Metal Matrix Composites Market Revenue (Million), by Fillers 2025 & 2033
- Figure 8: Asia Pacific Metal Matrix Composites Market Volume (Million), by Fillers 2025 & 2033
- Figure 9: Asia Pacific Metal Matrix Composites Market Revenue Share (%), by Fillers 2025 & 2033
- Figure 10: Asia Pacific Metal Matrix Composites Market Volume Share (%), by Fillers 2025 & 2033
- Figure 11: Asia Pacific Metal Matrix Composites Market Revenue (Million), by End-user Industry 2025 & 2033
- Figure 12: Asia Pacific Metal Matrix Composites Market Volume (Million), by End-user Industry 2025 & 2033
- Figure 13: Asia Pacific Metal Matrix Composites Market Revenue Share (%), by End-user Industry 2025 & 2033
- Figure 14: Asia Pacific Metal Matrix Composites Market Volume Share (%), by End-user Industry 2025 & 2033
- Figure 15: Asia Pacific Metal Matrix Composites Market Revenue (Million), by Country 2025 & 2033
- Figure 16: Asia Pacific Metal Matrix Composites Market Volume (Million), by Country 2025 & 2033
- Figure 17: Asia Pacific Metal Matrix Composites Market Revenue Share (%), by Country 2025 & 2033
- Figure 18: Asia Pacific Metal Matrix Composites Market Volume Share (%), by Country 2025 & 2033
- Figure 19: North America Metal Matrix Composites Market Revenue (Million), by Type 2025 & 2033
- Figure 20: North America Metal Matrix Composites Market Volume (Million), by Type 2025 & 2033
- Figure 21: North America Metal Matrix Composites Market Revenue Share (%), by Type 2025 & 2033
- Figure 22: North America Metal Matrix Composites Market Volume Share (%), by Type 2025 & 2033
- Figure 23: North America Metal Matrix Composites Market Revenue (Million), by Fillers 2025 & 2033
- Figure 24: North America Metal Matrix Composites Market Volume (Million), by Fillers 2025 & 2033
- Figure 25: North America Metal Matrix Composites Market Revenue Share (%), by Fillers 2025 & 2033
- Figure 26: North America Metal Matrix Composites Market Volume Share (%), by Fillers 2025 & 2033
- Figure 27: North America Metal Matrix Composites Market Revenue (Million), by End-user Industry 2025 & 2033
- Figure 28: North America Metal Matrix Composites Market Volume (Million), by End-user Industry 2025 & 2033
- Figure 29: North America Metal Matrix Composites Market Revenue Share (%), by End-user Industry 2025 & 2033
- Figure 30: North America Metal Matrix Composites Market Volume Share (%), by End-user Industry 2025 & 2033
- Figure 31: North America Metal Matrix Composites Market Revenue (Million), by Country 2025 & 2033
- Figure 32: North America Metal Matrix Composites Market Volume (Million), by Country 2025 & 2033
- Figure 33: North America Metal Matrix Composites Market Revenue Share (%), by Country 2025 & 2033
- Figure 34: North America Metal Matrix Composites Market Volume Share (%), by Country 2025 & 2033
- Figure 35: Europe Metal Matrix Composites Market Revenue (Million), by Type 2025 & 2033
- Figure 36: Europe Metal Matrix Composites Market Volume (Million), by Type 2025 & 2033
- Figure 37: Europe Metal Matrix Composites Market Revenue Share (%), by Type 2025 & 2033
- Figure 38: Europe Metal Matrix Composites Market Volume Share (%), by Type 2025 & 2033
- Figure 39: Europe Metal Matrix Composites Market Revenue (Million), by Fillers 2025 & 2033
- Figure 40: Europe Metal Matrix Composites Market Volume (Million), by Fillers 2025 & 2033
- Figure 41: Europe Metal Matrix Composites Market Revenue Share (%), by Fillers 2025 & 2033
- Figure 42: Europe Metal Matrix Composites Market Volume Share (%), by Fillers 2025 & 2033
- Figure 43: Europe Metal Matrix Composites Market Revenue (Million), by End-user Industry 2025 & 2033
- Figure 44: Europe Metal Matrix Composites Market Volume (Million), by End-user Industry 2025 & 2033
- Figure 45: Europe Metal Matrix Composites Market Revenue Share (%), by End-user Industry 2025 & 2033
- Figure 46: Europe Metal Matrix Composites Market Volume Share (%), by End-user Industry 2025 & 2033
- Figure 47: Europe Metal Matrix Composites Market Revenue (Million), by Country 2025 & 2033
- Figure 48: Europe Metal Matrix Composites Market Volume (Million), by Country 2025 & 2033
- Figure 49: Europe Metal Matrix Composites Market Revenue Share (%), by Country 2025 & 2033
- Figure 50: Europe Metal Matrix Composites Market Volume Share (%), by Country 2025 & 2033
- Figure 51: South America Metal Matrix Composites Market Revenue (Million), by Type 2025 & 2033
- Figure 52: South America Metal Matrix Composites Market Volume (Million), by Type 2025 & 2033
- Figure 53: South America Metal Matrix Composites Market Revenue Share (%), by Type 2025 & 2033
- Figure 54: South America Metal Matrix Composites Market Volume Share (%), by Type 2025 & 2033
- Figure 55: South America Metal Matrix Composites Market Revenue (Million), by Fillers 2025 & 2033
- Figure 56: South America Metal Matrix Composites Market Volume (Million), by Fillers 2025 & 2033
- Figure 57: South America Metal Matrix Composites Market Revenue Share (%), by Fillers 2025 & 2033
- Figure 58: South America Metal Matrix Composites Market Volume Share (%), by Fillers 2025 & 2033
- Figure 59: South America Metal Matrix Composites Market Revenue (Million), by End-user Industry 2025 & 2033
- Figure 60: South America Metal Matrix Composites Market Volume (Million), by End-user Industry 2025 & 2033
- Figure 61: South America Metal Matrix Composites Market Revenue Share (%), by End-user Industry 2025 & 2033
- Figure 62: South America Metal Matrix Composites Market Volume Share (%), by End-user Industry 2025 & 2033
- Figure 63: South America Metal Matrix Composites Market Revenue (Million), by Country 2025 & 2033
- Figure 64: South America Metal Matrix Composites Market Volume (Million), by Country 2025 & 2033
- Figure 65: South America Metal Matrix Composites Market Revenue Share (%), by Country 2025 & 2033
- Figure 66: South America Metal Matrix Composites Market Volume Share (%), by Country 2025 & 2033
- Figure 67: Middle East and Africa Metal Matrix Composites Market Revenue (Million), by Type 2025 & 2033
- Figure 68: Middle East and Africa Metal Matrix Composites Market Volume (Million), by Type 2025 & 2033
- Figure 69: Middle East and Africa Metal Matrix Composites Market Revenue Share (%), by Type 2025 & 2033
- Figure 70: Middle East and Africa Metal Matrix Composites Market Volume Share (%), by Type 2025 & 2033
- Figure 71: Middle East and Africa Metal Matrix Composites Market Revenue (Million), by Fillers 2025 & 2033
- Figure 72: Middle East and Africa Metal Matrix Composites Market Volume (Million), by Fillers 2025 & 2033
- Figure 73: Middle East and Africa Metal Matrix Composites Market Revenue Share (%), by Fillers 2025 & 2033
- Figure 74: Middle East and Africa Metal Matrix Composites Market Volume Share (%), by Fillers 2025 & 2033
- Figure 75: Middle East and Africa Metal Matrix Composites Market Revenue (Million), by End-user Industry 2025 & 2033
- Figure 76: Middle East and Africa Metal Matrix Composites Market Volume (Million), by End-user Industry 2025 & 2033
- Figure 77: Middle East and Africa Metal Matrix Composites Market Revenue Share (%), by End-user Industry 2025 & 2033
- Figure 78: Middle East and Africa Metal Matrix Composites Market Volume Share (%), by End-user Industry 2025 & 2033
- Figure 79: Middle East and Africa Metal Matrix Composites Market Revenue (Million), by Country 2025 & 2033
- Figure 80: Middle East and Africa Metal Matrix Composites Market Volume (Million), by Country 2025 & 2033
- Figure 81: Middle East and Africa Metal Matrix Composites Market Revenue Share (%), by Country 2025 & 2033
- Figure 82: Middle East and Africa Metal Matrix Composites Market Volume Share (%), by Country 2025 & 2033
List of Tables
- Table 1: Global Metal Matrix Composites Market Revenue Million Forecast, by Type 2020 & 2033
- Table 2: Global Metal Matrix Composites Market Volume Million Forecast, by Type 2020 & 2033
- Table 3: Global Metal Matrix Composites Market Revenue Million Forecast, by Fillers 2020 & 2033
- Table 4: Global Metal Matrix Composites Market Volume Million Forecast, by Fillers 2020 & 2033
- Table 5: Global Metal Matrix Composites Market Revenue Million Forecast, by End-user Industry 2020 & 2033
- Table 6: Global Metal Matrix Composites Market Volume Million Forecast, by End-user Industry 2020 & 2033
- Table 7: Global Metal Matrix Composites Market Revenue Million Forecast, by Region 2020 & 2033
- Table 8: Global Metal Matrix Composites Market Volume Million Forecast, by Region 2020 & 2033
- Table 9: Global Metal Matrix Composites Market Revenue Million Forecast, by Type 2020 & 2033
- Table 10: Global Metal Matrix Composites Market Volume Million Forecast, by Type 2020 & 2033
- Table 11: Global Metal Matrix Composites Market Revenue Million Forecast, by Fillers 2020 & 2033
- Table 12: Global Metal Matrix Composites Market Volume Million Forecast, by Fillers 2020 & 2033
- Table 13: Global Metal Matrix Composites Market Revenue Million Forecast, by End-user Industry 2020 & 2033
- Table 14: Global Metal Matrix Composites Market Volume Million Forecast, by End-user Industry 2020 & 2033
- Table 15: Global Metal Matrix Composites Market Revenue Million Forecast, by Country 2020 & 2033
- Table 16: Global Metal Matrix Composites Market Volume Million Forecast, by Country 2020 & 2033
- Table 17: China Metal Matrix Composites Market Revenue (Million) Forecast, by Application 2020 & 2033
- Table 18: China Metal Matrix Composites Market Volume (Million) Forecast, by Application 2020 & 2033
- Table 19: India Metal Matrix Composites Market Revenue (Million) Forecast, by Application 2020 & 2033
- Table 20: India Metal Matrix Composites Market Volume (Million) Forecast, by Application 2020 & 2033
- Table 21: Japan Metal Matrix Composites Market Revenue (Million) Forecast, by Application 2020 & 2033
- Table 22: Japan Metal Matrix Composites Market Volume (Million) Forecast, by Application 2020 & 2033
- Table 23: South Korea Metal Matrix Composites Market Revenue (Million) Forecast, by Application 2020 & 2033
- Table 24: South Korea Metal Matrix Composites Market Volume (Million) Forecast, by Application 2020 & 2033
- Table 25: Rest of Asia Pacific Metal Matrix Composites Market Revenue (Million) Forecast, by Application 2020 & 2033
- Table 26: Rest of Asia Pacific Metal Matrix Composites Market Volume (Million) Forecast, by Application 2020 & 2033
- Table 27: Global Metal Matrix Composites Market Revenue Million Forecast, by Type 2020 & 2033
- Table 28: Global Metal Matrix Composites Market Volume Million Forecast, by Type 2020 & 2033
- Table 29: Global Metal Matrix Composites Market Revenue Million Forecast, by Fillers 2020 & 2033
- Table 30: Global Metal Matrix Composites Market Volume Million Forecast, by Fillers 2020 & 2033
- Table 31: Global Metal Matrix Composites Market Revenue Million Forecast, by End-user Industry 2020 & 2033
- Table 32: Global Metal Matrix Composites Market Volume Million Forecast, by End-user Industry 2020 & 2033
- Table 33: Global Metal Matrix Composites Market Revenue Million Forecast, by Country 2020 & 2033
- Table 34: Global Metal Matrix Composites Market Volume Million Forecast, by Country 2020 & 2033
- Table 35: United States Metal Matrix Composites Market Revenue (Million) Forecast, by Application 2020 & 2033
- Table 36: United States Metal Matrix Composites Market Volume (Million) Forecast, by Application 2020 & 2033
- Table 37: Canada Metal Matrix Composites Market Revenue (Million) Forecast, by Application 2020 & 2033
- Table 38: Canada Metal Matrix Composites Market Volume (Million) Forecast, by Application 2020 & 2033
- Table 39: Mexico Metal Matrix Composites Market Revenue (Million) Forecast, by Application 2020 & 2033
- Table 40: Mexico Metal Matrix Composites Market Volume (Million) Forecast, by Application 2020 & 2033
- Table 41: Global Metal Matrix Composites Market Revenue Million Forecast, by Type 2020 & 2033
- Table 42: Global Metal Matrix Composites Market Volume Million Forecast, by Type 2020 & 2033
- Table 43: Global Metal Matrix Composites Market Revenue Million Forecast, by Fillers 2020 & 2033
- Table 44: Global Metal Matrix Composites Market Volume Million Forecast, by Fillers 2020 & 2033
- Table 45: Global Metal Matrix Composites Market Revenue Million Forecast, by End-user Industry 2020 & 2033
- Table 46: Global Metal Matrix Composites Market Volume Million Forecast, by End-user Industry 2020 & 2033
- Table 47: Global Metal Matrix Composites Market Revenue Million Forecast, by Country 2020 & 2033
- Table 48: Global Metal Matrix Composites Market Volume Million Forecast, by Country 2020 & 2033
- Table 49: Germany Metal Matrix Composites Market Revenue (Million) Forecast, by Application 2020 & 2033
- Table 50: Germany Metal Matrix Composites Market Volume (Million) Forecast, by Application 2020 & 2033
- Table 51: United Kingdom Metal Matrix Composites Market Revenue (Million) Forecast, by Application 2020 & 2033
- Table 52: United Kingdom Metal Matrix Composites Market Volume (Million) Forecast, by Application 2020 & 2033
- Table 53: Italy Metal Matrix Composites Market Revenue (Million) Forecast, by Application 2020 & 2033
- Table 54: Italy Metal Matrix Composites Market Volume (Million) Forecast, by Application 2020 & 2033
- Table 55: France Metal Matrix Composites Market Revenue (Million) Forecast, by Application 2020 & 2033
- Table 56: France Metal Matrix Composites Market Volume (Million) Forecast, by Application 2020 & 2033
- Table 57: Spain Metal Matrix Composites Market Revenue (Million) Forecast, by Application 2020 & 2033
- Table 58: Spain Metal Matrix Composites Market Volume (Million) Forecast, by Application 2020 & 2033
- Table 59: Rest of Europe Metal Matrix Composites Market Revenue (Million) Forecast, by Application 2020 & 2033
- Table 60: Rest of Europe Metal Matrix Composites Market Volume (Million) Forecast, by Application 2020 & 2033
- Table 61: Global Metal Matrix Composites Market Revenue Million Forecast, by Type 2020 & 2033
- Table 62: Global Metal Matrix Composites Market Volume Million Forecast, by Type 2020 & 2033
- Table 63: Global Metal Matrix Composites Market Revenue Million Forecast, by Fillers 2020 & 2033
- Table 64: Global Metal Matrix Composites Market Volume Million Forecast, by Fillers 2020 & 2033
- Table 65: Global Metal Matrix Composites Market Revenue Million Forecast, by End-user Industry 2020 & 2033
- Table 66: Global Metal Matrix Composites Market Volume Million Forecast, by End-user Industry 2020 & 2033
- Table 67: Global Metal Matrix Composites Market Revenue Million Forecast, by Country 2020 & 2033
- Table 68: Global Metal Matrix Composites Market Volume Million Forecast, by Country 2020 & 2033
- Table 69: Brazil Metal Matrix Composites Market Revenue (Million) Forecast, by Application 2020 & 2033
- Table 70: Brazil Metal Matrix Composites Market Volume (Million) Forecast, by Application 2020 & 2033
- Table 71: Argentina Metal Matrix Composites Market Revenue (Million) Forecast, by Application 2020 & 2033
- Table 72: Argentina Metal Matrix Composites Market Volume (Million) Forecast, by Application 2020 & 2033
- Table 73: Rest of South America Metal Matrix Composites Market Revenue (Million) Forecast, by Application 2020 & 2033
- Table 74: Rest of South America Metal Matrix Composites Market Volume (Million) Forecast, by Application 2020 & 2033
- Table 75: Global Metal Matrix Composites Market Revenue Million Forecast, by Type 2020 & 2033
- Table 76: Global Metal Matrix Composites Market Volume Million Forecast, by Type 2020 & 2033
- Table 77: Global Metal Matrix Composites Market Revenue Million Forecast, by Fillers 2020 & 2033
- Table 78: Global Metal Matrix Composites Market Volume Million Forecast, by Fillers 2020 & 2033
- Table 79: Global Metal Matrix Composites Market Revenue Million Forecast, by End-user Industry 2020 & 2033
- Table 80: Global Metal Matrix Composites Market Volume Million Forecast, by End-user Industry 2020 & 2033
- Table 81: Global Metal Matrix Composites Market Revenue Million Forecast, by Country 2020 & 2033
- Table 82: Global Metal Matrix Composites Market Volume Million Forecast, by Country 2020 & 2033
- Table 83: Saudi Arabia Metal Matrix Composites Market Revenue (Million) Forecast, by Application 2020 & 2033
- Table 84: Saudi Arabia Metal Matrix Composites Market Volume (Million) Forecast, by Application 2020 & 2033
- Table 85: South Africa Metal Matrix Composites Market Revenue (Million) Forecast, by Application 2020 & 2033
- Table 86: South Africa Metal Matrix Composites Market Volume (Million) Forecast, by Application 2020 & 2033
- Table 87: Rest of Middle East and Africa Metal Matrix Composites Market Revenue (Million) Forecast, by Application 2020 & 2033
- Table 88: Rest of Middle East and Africa Metal Matrix Composites Market Volume (Million) Forecast, by Application 2020 & 2033
Frequently Asked Questions
1. What is the projected Compound Annual Growth Rate (CAGR) of the Metal Matrix Composites Market?
The projected CAGR is approximately 6.49%.
2. Which companies are prominent players in the Metal Matrix Composites Market?
Key companies in the market include 3A Composites, 3M (Ceradyne Inc ), ADMA Products Inc, CPS Technologies Corp, DAT Alloytech, Denka Company Limited, GKN Sinter Metals Engineering GmbH, Hitachi Metals Ltd, Materion Corporation, MTC Powder Solutions AB, Plansee Group, Sumitomo Electric Industries Ltd, Thermal Transfer Composites LLC, TISICS Ltd*List Not Exhaustive.
3. What are the main segments of the Metal Matrix Composites Market?
The market segments include Type, Fillers, End-user Industry.
4. Can you provide details about the market size?
The market size is estimated to be USD 457.16 Million as of 2022.
5. What are some drivers contributing to market growth?
Increasing Demand for Lightweight Materials in Aerospace and Defense Industry; Superior Properties of Metal Matrix Composites over Metals.
6. What are the notable trends driving market growth?
Electrical and Electronics Segment to Register Fastest Growth.
7. Are there any restraints impacting market growth?
Increasing Demand for Lightweight Materials in Aerospace and Defense Industry; Superior Properties of Metal Matrix Composites over Metals.
8. Can you provide examples of recent developments in the market?
In January 2022, Plansee Group signed a definitive agreement to acquire Mi-Tech Tungsten Metals. The acquisition will help Plansee Group expand its market position for tungsten products in North America.
9. What pricing options are available for accessing the report?
Pricing options include single-user, multi-user, and enterprise licenses priced at USD 4750, USD 5250, and USD 8750 respectively.
10. Is the market size provided in terms of value or volume?
The market size is provided in terms of value, measured in Million and volume, measured in Million.
11. Are there any specific market keywords associated with the report?
Yes, the market keyword associated with the report is "Metal Matrix Composites Market," which aids in identifying and referencing the specific market segment covered.
12. How do I determine which pricing option suits my needs best?
The pricing options vary based on user requirements and access needs. Individual users may opt for single-user licenses, while businesses requiring broader access may choose multi-user or enterprise licenses for cost-effective access to the report.
13. Are there any additional resources or data provided in the Metal Matrix Composites Market report?
While the report offers comprehensive insights, it's advisable to review the specific contents or supplementary materials provided to ascertain if additional resources or data are available.
14. How can I stay updated on further developments or reports in the Metal Matrix Composites Market?
To stay informed about further developments, trends, and reports in the Metal Matrix Composites Market, consider subscribing to industry newsletters, following relevant companies and organizations, or regularly checking reputable industry news sources and publications.
Methodology
Step 1 - Identification of Relevant Samples Size from Population Database


Step 2 - Approaches for Defining Global Market Size (Value, Volume* & Price*)

Note*: In applicable scenarios
Step 3 - Data Sources
Primary Research
- Web Analytics
- Survey Reports
- Research Institute
- Latest Research Reports
- Opinion Leaders
Secondary Research
- Annual Reports
- White Paper
- Latest Press Release
- Industry Association
- Paid Database
- Investor Presentations

Step 4 - Data Triangulation
Involves using different sources of information in order to increase the validity of a study
These sources are likely to be stakeholders in a program - participants, other researchers, program staff, other community members, and so on.
Then we put all data in single framework & apply various statistical tools to find out the dynamic on the market.
During the analysis stage, feedback from the stakeholder groups would be compared to determine areas of agreement as well as areas of divergence