

Key Insights
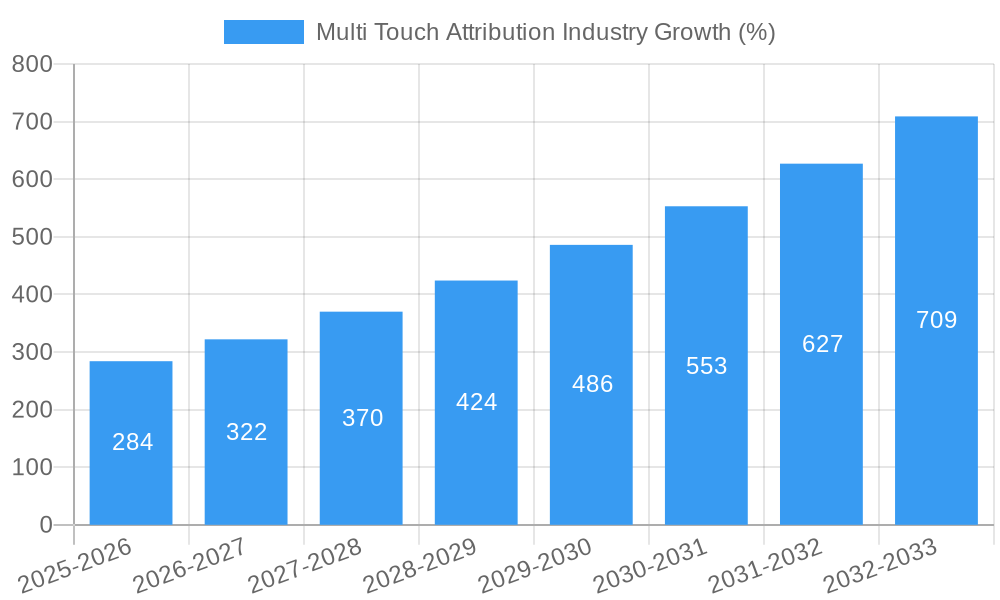
The Multi-Touch Attribution (MTA) market is experiencing robust growth, projected to reach $2.14 billion in 2025 and exhibiting a Compound Annual Growth Rate (CAGR) of 13.64% from 2025 to 2033. This expansion is fueled by several key factors. The increasing reliance on digital marketing necessitates accurate measurement of campaign effectiveness beyond last-click attribution. Businesses across various sectors, including Retail & E-commerce, BFSI (Banking, Financial Services, and Insurance), IT & Telecom, and Consumer Electronics, are adopting MTA solutions to optimize their marketing spend and improve return on investment (ROI). The rising complexity of customer journeys, involving multiple touchpoints across various channels, further underscores the need for sophisticated MTA tools to gain a holistic understanding of marketing performance. Furthermore, the growing adoption of advanced analytics and machine learning capabilities within MTA platforms enhances their precision and provides valuable insights for strategic decision-making. This allows marketers to refine their strategies, personalize customer experiences, and ultimately drive higher conversion rates.
The market segmentation reveals a diverse landscape, with Retail & E-commerce representing a significant share due to the intense competition and the need for precise attribution in highly-competitive online marketplaces. The BFSI sector's adoption of MTA reflects the increasing importance of digital channels in customer acquisition and retention. Geographical distribution reveals strong growth in North America and Asia Pacific, driven by high digital adoption rates and a growing number of tech-savvy consumers. However, the market also faces certain restraints, including the complexity of implementation and the high cost associated with deploying sophisticated MTA solutions, particularly for smaller businesses. Despite these challenges, the overall market outlook remains highly positive, driven by continuous technological advancements and the increasing demand for data-driven marketing strategies. The presence of established players like Nielsen and Adobe, alongside several innovative startups, fosters intense competition and fuels innovation within the industry.

Unlock the Potential of Multi-Touch Attribution: A Comprehensive Market Report (2019-2033)
This comprehensive report delivers an in-depth analysis of the Multi-Touch Attribution (MTA) industry, providing invaluable insights for stakeholders, investors, and industry professionals. With a detailed examination spanning the historical period (2019-2024), base year (2025), and forecast period (2025-2033), this report unveils the market's dynamic landscape, growth drivers, and future trajectory. The study encompasses a market size valuation of xx Million in 2025, projecting a Compound Annual Growth Rate (CAGR) of xx% throughout the forecast period. This report analyzes key players like The Nielsen Company, Adobe Inc, and Merkle Inc, among others, offering actionable strategies to navigate this rapidly evolving market.
Multi Touch Attribution Industry Market Concentration & Dynamics
The Multi-Touch Attribution industry exhibits a moderately concentrated market structure, with a few major players holding significant market share. The Nielsen Company, Adobe Inc, and Merkle Inc are amongst the leading players, collectively accounting for an estimated xx% of the market in 2025. However, the landscape is dynamic, with a growing number of smaller, specialized firms competing based on niche capabilities and innovative solutions.
The industry's innovation ecosystem is robust, fueled by ongoing advancements in data analytics, machine learning, and artificial intelligence. Regulatory frameworks, particularly those concerning data privacy (e.g., GDPR, CCPA), exert significant influence, shaping data collection practices and influencing the adoption of MTA solutions. Substitute products, primarily relying on simpler attribution models, continue to exist but are gradually losing ground to the increasingly sophisticated capabilities of MTA solutions. End-user trends are pushing demand towards more granular and transparent attribution, driving innovation in areas like cross-device tracking and cookieless solutions.
M&A activity within the MTA space has been moderate, with approximately xx deals recorded between 2019 and 2024. These activities reflect the industry's ongoing consolidation, with larger companies acquiring smaller players to expand their product portfolios and gain market share.
- Market Share (2025): Top 3 players: xx%
- M&A Deal Count (2019-2024): xx
- Key Regulatory Factors: GDPR, CCPA
Multi Touch Attribution Industry Industry Insights & Trends
The Multi-Touch Attribution market is experiencing robust growth driven by several factors. The increasing adoption of digital marketing strategies across various industries fuels the demand for accurate and comprehensive attribution solutions. The shift towards data-driven decision-making, coupled with the growing complexity of marketing campaigns, underscores the need for MTA to optimize return on investment (ROI). Technological disruptions, particularly advancements in machine learning and artificial intelligence, are enabling the development of more sophisticated MTA algorithms capable of handling large volumes of data and delivering precise attribution insights. Evolving consumer behavior, with its increased reliance on multiple devices and channels, necessitates the use of MTA to gain a holistic understanding of customer journeys.
The market size in 2025 is estimated at xx Million, growing at a CAGR of xx% during the forecast period. This growth trajectory reflects the market's significant potential, driven by factors including growing adoption across various industries and advancements in MTA technology.
Key Markets & Segments Leading Multi Touch Attribution Industry
The Retail & E-commerce segment dominates the Multi-Touch Attribution market, accounting for the largest share of xx Million in 2025. This dominance is primarily attributed to the sector's high reliance on digital marketing and the need for accurate attribution to optimize online campaigns. The BFSI (Banking, Financial Services, and Insurance) sector is another significant market segment, driven by the need for precise measurement of marketing ROI in customer acquisition and retention efforts. The IT & Telecom sector, characterized by its large-scale digital marketing operations, also contributes substantially to MTA adoption.
- Retail & E-commerce: High digital marketing spend, focus on ROI optimization.
- BFSI: Emphasis on customer acquisition and retention through targeted campaigns.
- IT & Telecom: Large-scale digital marketing campaigns and competitive landscape.
- Other End-user Industries: Growing adoption across diverse sectors.
Regional Dominance: The North American region is currently the leading market for MTA solutions, owing to high digital marketing maturity and technological advancements.
Multi Touch Attribution Industry Product Developments
Recent product innovations focus on enhancing the accuracy, scalability, and usability of MTA solutions. Advancements in AI and machine learning enable more precise attribution modeling, while improved user interfaces streamline data analysis and reporting. The integration of MTA solutions with other marketing technology platforms is also a key trend, facilitating seamless data flow and operational efficiency. The focus is on providing comprehensive, real-time insights into campaign performance across multiple touchpoints, providing a competitive edge for businesses aiming to maximize their return on marketing investment.
Challenges in the Multi Touch Attribution Industry Market
The MTA market faces several challenges, including data privacy regulations (e.g., GDPR, CCPA) that limit data collection and sharing. The complexity of integrating various data sources and the need for skilled professionals to manage MTA solutions pose significant hurdles. Finally, intense competition among vendors necessitates continuous innovation and the development of differentiated value propositions to sustain market share. These factors collectively impact market growth and adoption rates.
Forces Driving Multi Touch Attribution Industry Growth
The growth of the MTA market is propelled by several key forces. Advancements in AI and machine learning enable more accurate and comprehensive attribution models. The increasing demand for data-driven marketing decisions necessitates the use of sophisticated MTA solutions. Furthermore, the rise of cross-device and cookieless tracking methodologies is expanding the capabilities and applicability of MTA across various platforms.
Long-Term Growth Catalysts in the Multi Touch Attribution Industry
Long-term growth hinges on continuous innovation in attribution methodologies to address evolving consumer behavior and data privacy concerns. Strategic partnerships between MTA vendors and other martech companies will accelerate market penetration and integration. Finally, expansion into new markets, particularly in developing economies with growing digital adoption, will unlock significant growth opportunities.
Emerging Opportunities in Multi Touch Attribution Industry
Emerging opportunities include the development of more sophisticated cookieless attribution solutions, catering to increasing privacy concerns. The integration of MTA with other marketing technologies (e.g., CRM, CDP) to create comprehensive marketing ecosystems presents another avenue for growth. Finally, exploring emerging markets and industries, like the metaverse, that are driving unprecedented demand for sophisticated attribution solutions, offers immense potential.
Leading Players in the Multi Touch Attribution Industry Sector
- The Nielsen Company
- Conversion Logic Inc
- Adobe Inc
- Merkle Inc
- Neustar Inc
- Engagio Inc
- Ipsos Group SA
- Equifax Inc
- AppsFlyer
- LeadsRx Inc
- LeanData Inc
- Manthan
Key Milestones in Multi Touch Attribution Industry Industry
- March 2022: Quotient launched its impression-based, multi-touch media measurement methodology, expanding the reach and applicability of MTA.
- May 2022: Clinch and Neustar's collaboration enhanced the comprehensiveness and real-time insights provided by MTA solutions, improving campaign optimization capabilities.
Strategic Outlook for Multi Touch Attribution Industry Market
The future of the Multi-Touch Attribution market is bright, driven by continuous technological advancements and the ever-increasing demand for accurate marketing measurement. Strategic partnerships, expansion into new markets, and the development of innovative attribution methodologies will be crucial to capturing the significant growth potential that lies ahead. The market is poised for substantial expansion, driven by both organic growth and strategic acquisitions.
Multi Touch Attribution Industry Segmentation
-
1. End-user Industry
- 1.1. Retail & E-commerce
- 1.2. BFSI
- 1.3. IT & Telecom
- 1.4. Consumer Electronics
- 1.5. Travel & Tourism
- 1.6. Other En
Multi Touch Attribution Industry Segmentation By Geography
- 1. North America
- 2. Europe
- 3. Asia Pacific
- 4. Latin America
- 5. Middle East and Africa

Multi Touch Attribution Industry REPORT HIGHLIGHTS
| Aspects | Details |
|---|---|
| Study Period | 2019-2033 |
| Base Year | 2024 |
| Estimated Year | 2025 |
| Forecast Period | 2025-2033 |
| Historical Period | 2019-2024 |
| Growth Rate | CAGR of 13.64% from 2019-2033 |
| Segmentation |
|
Table of Contents
- 1. Introduction
- 1.1. Research Scope
- 1.2. Market Segmentation
- 1.3. Research Methodology
- 1.4. Definitions and Assumptions
- 2. Executive Summary
- 2.1. Introduction
- 3. Market Dynamics
- 3.1. Introduction
- 3.2. Market Drivers
- 3.2.1 Increasing Focus of Marketers on Maximizing the ROI; Growing Number of Marketing Channels and Need for Optimization of Marketing Expenditure; Adoption of Technology and Solutions such as AI
- 3.2.2 Big Data
- 3.2.3 and Cloud Computing in Marketing
- 3.3. Market Restrains
- 3.3.1 Skepticism About Shifting from Existing Marketing Practices
- 3.3.2 Training and Change Management
- 3.4. Market Trends
- 3.4.1. Retail & E-commerce Industry Expected to Show Maximum Growth
- 4. Market Factor Analysis
- 4.1. Porters Five Forces
- 4.2. Supply/Value Chain
- 4.3. PESTEL analysis
- 4.4. Market Entropy
- 4.5. Patent/Trademark Analysis
- 5. Global Multi Touch Attribution Industry Analysis, Insights and Forecast, 2019-2031
- 5.1. Market Analysis, Insights and Forecast - by End-user Industry
- 5.1.1. Retail & E-commerce
- 5.1.2. BFSI
- 5.1.3. IT & Telecom
- 5.1.4. Consumer Electronics
- 5.1.5. Travel & Tourism
- 5.1.6. Other En
- 5.2. Market Analysis, Insights and Forecast - by Region
- 5.2.1. North America
- 5.2.2. Europe
- 5.2.3. Asia Pacific
- 5.2.4. Latin America
- 5.2.5. Middle East and Africa
- 5.1. Market Analysis, Insights and Forecast - by End-user Industry
- 6. North America Multi Touch Attribution Industry Analysis, Insights and Forecast, 2019-2031
- 6.1. Market Analysis, Insights and Forecast - by End-user Industry
- 6.1.1. Retail & E-commerce
- 6.1.2. BFSI
- 6.1.3. IT & Telecom
- 6.1.4. Consumer Electronics
- 6.1.5. Travel & Tourism
- 6.1.6. Other En
- 6.1. Market Analysis, Insights and Forecast - by End-user Industry
- 7. Europe Multi Touch Attribution Industry Analysis, Insights and Forecast, 2019-2031
- 7.1. Market Analysis, Insights and Forecast - by End-user Industry
- 7.1.1. Retail & E-commerce
- 7.1.2. BFSI
- 7.1.3. IT & Telecom
- 7.1.4. Consumer Electronics
- 7.1.5. Travel & Tourism
- 7.1.6. Other En
- 7.1. Market Analysis, Insights and Forecast - by End-user Industry
- 8. Asia Pacific Multi Touch Attribution Industry Analysis, Insights and Forecast, 2019-2031
- 8.1. Market Analysis, Insights and Forecast - by End-user Industry
- 8.1.1. Retail & E-commerce
- 8.1.2. BFSI
- 8.1.3. IT & Telecom
- 8.1.4. Consumer Electronics
- 8.1.5. Travel & Tourism
- 8.1.6. Other En
- 8.1. Market Analysis, Insights and Forecast - by End-user Industry
- 9. Latin America Multi Touch Attribution Industry Analysis, Insights and Forecast, 2019-2031
- 9.1. Market Analysis, Insights and Forecast - by End-user Industry
- 9.1.1. Retail & E-commerce
- 9.1.2. BFSI
- 9.1.3. IT & Telecom
- 9.1.4. Consumer Electronics
- 9.1.5. Travel & Tourism
- 9.1.6. Other En
- 9.1. Market Analysis, Insights and Forecast - by End-user Industry
- 10. Middle East and Africa Multi Touch Attribution Industry Analysis, Insights and Forecast, 2019-2031
- 10.1. Market Analysis, Insights and Forecast - by End-user Industry
- 10.1.1. Retail & E-commerce
- 10.1.2. BFSI
- 10.1.3. IT & Telecom
- 10.1.4. Consumer Electronics
- 10.1.5. Travel & Tourism
- 10.1.6. Other En
- 10.1. Market Analysis, Insights and Forecast - by End-user Industry
- 11. North America Multi Touch Attribution Industry Analysis, Insights and Forecast, 2019-2031
- 11.1. Market Analysis, Insights and Forecast - By Country/Sub-region
- 11.1.1 United States
- 11.1.2 Canada
- 11.1.3 Mexico
- 12. Europe Multi Touch Attribution Industry Analysis, Insights and Forecast, 2019-2031
- 12.1. Market Analysis, Insights and Forecast - By Country/Sub-region
- 12.1.1 Germany
- 12.1.2 United Kingdom
- 12.1.3 France
- 12.1.4 Spain
- 12.1.5 Italy
- 12.1.6 Spain
- 12.1.7 Belgium
- 12.1.8 Netherland
- 12.1.9 Nordics
- 12.1.10 Rest of Europe
- 13. Asia Pacific Multi Touch Attribution Industry Analysis, Insights and Forecast, 2019-2031
- 13.1. Market Analysis, Insights and Forecast - By Country/Sub-region
- 13.1.1 China
- 13.1.2 Japan
- 13.1.3 India
- 13.1.4 South Korea
- 13.1.5 Southeast Asia
- 13.1.6 Australia
- 13.1.7 Indonesia
- 13.1.8 Phillipes
- 13.1.9 Singapore
- 13.1.10 Thailandc
- 13.1.11 Rest of Asia Pacific
- 14. South America Multi Touch Attribution Industry Analysis, Insights and Forecast, 2019-2031
- 14.1. Market Analysis, Insights and Forecast - By Country/Sub-region
- 14.1.1 Brazil
- 14.1.2 Argentina
- 14.1.3 Peru
- 14.1.4 Chile
- 14.1.5 Colombia
- 14.1.6 Ecuador
- 14.1.7 Venezuela
- 14.1.8 Rest of South America
- 15. North America Multi Touch Attribution Industry Analysis, Insights and Forecast, 2019-2031
- 15.1. Market Analysis, Insights and Forecast - By Country/Sub-region
- 15.1.1 United States
- 15.1.2 Canada
- 15.1.3 Mexico
- 16. MEA Multi Touch Attribution Industry Analysis, Insights and Forecast, 2019-2031
- 16.1. Market Analysis, Insights and Forecast - By Country/Sub-region
- 16.1.1 United Arab Emirates
- 16.1.2 Saudi Arabia
- 16.1.3 South Africa
- 16.1.4 Rest of Middle East and Africa
- 17. Competitive Analysis
- 17.1. Global Market Share Analysis 2024
- 17.2. Company Profiles
- 17.2.1 The Nielsen Company
- 17.2.1.1. Overview
- 17.2.1.2. Products
- 17.2.1.3. SWOT Analysis
- 17.2.1.4. Recent Developments
- 17.2.1.5. Financials (Based on Availability)
- 17.2.2 Conversion Logic Inc
- 17.2.2.1. Overview
- 17.2.2.2. Products
- 17.2.2.3. SWOT Analysis
- 17.2.2.4. Recent Developments
- 17.2.2.5. Financials (Based on Availability)
- 17.2.3 Adobe Inc
- 17.2.3.1. Overview
- 17.2.3.2. Products
- 17.2.3.3. SWOT Analysis
- 17.2.3.4. Recent Developments
- 17.2.3.5. Financials (Based on Availability)
- 17.2.4 Merkle Inc
- 17.2.4.1. Overview
- 17.2.4.2. Products
- 17.2.4.3. SWOT Analysis
- 17.2.4.4. Recent Developments
- 17.2.4.5. Financials (Based on Availability)
- 17.2.5 Neustar Inc
- 17.2.5.1. Overview
- 17.2.5.2. Products
- 17.2.5.3. SWOT Analysis
- 17.2.5.4. Recent Developments
- 17.2.5.5. Financials (Based on Availability)
- 17.2.6 Engagio Inc
- 17.2.6.1. Overview
- 17.2.6.2. Products
- 17.2.6.3. SWOT Analysis
- 17.2.6.4. Recent Developments
- 17.2.6.5. Financials (Based on Availability)
- 17.2.7 Ipsos Group SA
- 17.2.7.1. Overview
- 17.2.7.2. Products
- 17.2.7.3. SWOT Analysis
- 17.2.7.4. Recent Developments
- 17.2.7.5. Financials (Based on Availability)
- 17.2.8 Equifax Inc
- 17.2.8.1. Overview
- 17.2.8.2. Products
- 17.2.8.3. SWOT Analysis
- 17.2.8.4. Recent Developments
- 17.2.8.5. Financials (Based on Availability)
- 17.2.9 AppsFlyer
- 17.2.9.1. Overview
- 17.2.9.2. Products
- 17.2.9.3. SWOT Analysis
- 17.2.9.4. Recent Developments
- 17.2.9.5. Financials (Based on Availability)
- 17.2.10 LeadsRx Inc
- 17.2.10.1. Overview
- 17.2.10.2. Products
- 17.2.10.3. SWOT Analysis
- 17.2.10.4. Recent Developments
- 17.2.10.5. Financials (Based on Availability)
- 17.2.11 LeanData Inc
- 17.2.11.1. Overview
- 17.2.11.2. Products
- 17.2.11.3. SWOT Analysis
- 17.2.11.4. Recent Developments
- 17.2.11.5. Financials (Based on Availability)
- 17.2.12 Manthan
- 17.2.12.1. Overview
- 17.2.12.2. Products
- 17.2.12.3. SWOT Analysis
- 17.2.12.4. Recent Developments
- 17.2.12.5. Financials (Based on Availability)
- 17.2.1 The Nielsen Company
List of Figures
- Figure 1: Global Multi Touch Attribution Industry Revenue Breakdown (Million, %) by Region 2024 & 2032
- Figure 2: Global Multi Touch Attribution Industry Volume Breakdown (K Unit, %) by Region 2024 & 2032
- Figure 3: North America Multi Touch Attribution Industry Revenue (Million), by Country 2024 & 2032
- Figure 4: North America Multi Touch Attribution Industry Volume (K Unit), by Country 2024 & 2032
- Figure 5: North America Multi Touch Attribution Industry Revenue Share (%), by Country 2024 & 2032
- Figure 6: North America Multi Touch Attribution Industry Volume Share (%), by Country 2024 & 2032
- Figure 7: Europe Multi Touch Attribution Industry Revenue (Million), by Country 2024 & 2032
- Figure 8: Europe Multi Touch Attribution Industry Volume (K Unit), by Country 2024 & 2032
- Figure 9: Europe Multi Touch Attribution Industry Revenue Share (%), by Country 2024 & 2032
- Figure 10: Europe Multi Touch Attribution Industry Volume Share (%), by Country 2024 & 2032
- Figure 11: Asia Pacific Multi Touch Attribution Industry Revenue (Million), by Country 2024 & 2032
- Figure 12: Asia Pacific Multi Touch Attribution Industry Volume (K Unit), by Country 2024 & 2032
- Figure 13: Asia Pacific Multi Touch Attribution Industry Revenue Share (%), by Country 2024 & 2032
- Figure 14: Asia Pacific Multi Touch Attribution Industry Volume Share (%), by Country 2024 & 2032
- Figure 15: South America Multi Touch Attribution Industry Revenue (Million), by Country 2024 & 2032
- Figure 16: South America Multi Touch Attribution Industry Volume (K Unit), by Country 2024 & 2032
- Figure 17: South America Multi Touch Attribution Industry Revenue Share (%), by Country 2024 & 2032
- Figure 18: South America Multi Touch Attribution Industry Volume Share (%), by Country 2024 & 2032
- Figure 19: North America Multi Touch Attribution Industry Revenue (Million), by Country 2024 & 2032
- Figure 20: North America Multi Touch Attribution Industry Volume (K Unit), by Country 2024 & 2032
- Figure 21: North America Multi Touch Attribution Industry Revenue Share (%), by Country 2024 & 2032
- Figure 22: North America Multi Touch Attribution Industry Volume Share (%), by Country 2024 & 2032
- Figure 23: MEA Multi Touch Attribution Industry Revenue (Million), by Country 2024 & 2032
- Figure 24: MEA Multi Touch Attribution Industry Volume (K Unit), by Country 2024 & 2032
- Figure 25: MEA Multi Touch Attribution Industry Revenue Share (%), by Country 2024 & 2032
- Figure 26: MEA Multi Touch Attribution Industry Volume Share (%), by Country 2024 & 2032
- Figure 27: North America Multi Touch Attribution Industry Revenue (Million), by End-user Industry 2024 & 2032
- Figure 28: North America Multi Touch Attribution Industry Volume (K Unit), by End-user Industry 2024 & 2032
- Figure 29: North America Multi Touch Attribution Industry Revenue Share (%), by End-user Industry 2024 & 2032
- Figure 30: North America Multi Touch Attribution Industry Volume Share (%), by End-user Industry 2024 & 2032
- Figure 31: North America Multi Touch Attribution Industry Revenue (Million), by Country 2024 & 2032
- Figure 32: North America Multi Touch Attribution Industry Volume (K Unit), by Country 2024 & 2032
- Figure 33: North America Multi Touch Attribution Industry Revenue Share (%), by Country 2024 & 2032
- Figure 34: North America Multi Touch Attribution Industry Volume Share (%), by Country 2024 & 2032
- Figure 35: Europe Multi Touch Attribution Industry Revenue (Million), by End-user Industry 2024 & 2032
- Figure 36: Europe Multi Touch Attribution Industry Volume (K Unit), by End-user Industry 2024 & 2032
- Figure 37: Europe Multi Touch Attribution Industry Revenue Share (%), by End-user Industry 2024 & 2032
- Figure 38: Europe Multi Touch Attribution Industry Volume Share (%), by End-user Industry 2024 & 2032
- Figure 39: Europe Multi Touch Attribution Industry Revenue (Million), by Country 2024 & 2032
- Figure 40: Europe Multi Touch Attribution Industry Volume (K Unit), by Country 2024 & 2032
- Figure 41: Europe Multi Touch Attribution Industry Revenue Share (%), by Country 2024 & 2032
- Figure 42: Europe Multi Touch Attribution Industry Volume Share (%), by Country 2024 & 2032
- Figure 43: Asia Pacific Multi Touch Attribution Industry Revenue (Million), by End-user Industry 2024 & 2032
- Figure 44: Asia Pacific Multi Touch Attribution Industry Volume (K Unit), by End-user Industry 2024 & 2032
- Figure 45: Asia Pacific Multi Touch Attribution Industry Revenue Share (%), by End-user Industry 2024 & 2032
- Figure 46: Asia Pacific Multi Touch Attribution Industry Volume Share (%), by End-user Industry 2024 & 2032
- Figure 47: Asia Pacific Multi Touch Attribution Industry Revenue (Million), by Country 2024 & 2032
- Figure 48: Asia Pacific Multi Touch Attribution Industry Volume (K Unit), by Country 2024 & 2032
- Figure 49: Asia Pacific Multi Touch Attribution Industry Revenue Share (%), by Country 2024 & 2032
- Figure 50: Asia Pacific Multi Touch Attribution Industry Volume Share (%), by Country 2024 & 2032
- Figure 51: Latin America Multi Touch Attribution Industry Revenue (Million), by End-user Industry 2024 & 2032
- Figure 52: Latin America Multi Touch Attribution Industry Volume (K Unit), by End-user Industry 2024 & 2032
- Figure 53: Latin America Multi Touch Attribution Industry Revenue Share (%), by End-user Industry 2024 & 2032
- Figure 54: Latin America Multi Touch Attribution Industry Volume Share (%), by End-user Industry 2024 & 2032
- Figure 55: Latin America Multi Touch Attribution Industry Revenue (Million), by Country 2024 & 2032
- Figure 56: Latin America Multi Touch Attribution Industry Volume (K Unit), by Country 2024 & 2032
- Figure 57: Latin America Multi Touch Attribution Industry Revenue Share (%), by Country 2024 & 2032
- Figure 58: Latin America Multi Touch Attribution Industry Volume Share (%), by Country 2024 & 2032
- Figure 59: Middle East and Africa Multi Touch Attribution Industry Revenue (Million), by End-user Industry 2024 & 2032
- Figure 60: Middle East and Africa Multi Touch Attribution Industry Volume (K Unit), by End-user Industry 2024 & 2032
- Figure 61: Middle East and Africa Multi Touch Attribution Industry Revenue Share (%), by End-user Industry 2024 & 2032
- Figure 62: Middle East and Africa Multi Touch Attribution Industry Volume Share (%), by End-user Industry 2024 & 2032
- Figure 63: Middle East and Africa Multi Touch Attribution Industry Revenue (Million), by Country 2024 & 2032
- Figure 64: Middle East and Africa Multi Touch Attribution Industry Volume (K Unit), by Country 2024 & 2032
- Figure 65: Middle East and Africa Multi Touch Attribution Industry Revenue Share (%), by Country 2024 & 2032
- Figure 66: Middle East and Africa Multi Touch Attribution Industry Volume Share (%), by Country 2024 & 2032
List of Tables
- Table 1: Global Multi Touch Attribution Industry Revenue Million Forecast, by Region 2019 & 2032
- Table 2: Global Multi Touch Attribution Industry Volume K Unit Forecast, by Region 2019 & 2032
- Table 3: Global Multi Touch Attribution Industry Revenue Million Forecast, by End-user Industry 2019 & 2032
- Table 4: Global Multi Touch Attribution Industry Volume K Unit Forecast, by End-user Industry 2019 & 2032
- Table 5: Global Multi Touch Attribution Industry Revenue Million Forecast, by Region 2019 & 2032
- Table 6: Global Multi Touch Attribution Industry Volume K Unit Forecast, by Region 2019 & 2032
- Table 7: Global Multi Touch Attribution Industry Revenue Million Forecast, by Country 2019 & 2032
- Table 8: Global Multi Touch Attribution Industry Volume K Unit Forecast, by Country 2019 & 2032
- Table 9: United States Multi Touch Attribution Industry Revenue (Million) Forecast, by Application 2019 & 2032
- Table 10: United States Multi Touch Attribution Industry Volume (K Unit) Forecast, by Application 2019 & 2032
- Table 11: Canada Multi Touch Attribution Industry Revenue (Million) Forecast, by Application 2019 & 2032
- Table 12: Canada Multi Touch Attribution Industry Volume (K Unit) Forecast, by Application 2019 & 2032
- Table 13: Mexico Multi Touch Attribution Industry Revenue (Million) Forecast, by Application 2019 & 2032
- Table 14: Mexico Multi Touch Attribution Industry Volume (K Unit) Forecast, by Application 2019 & 2032
- Table 15: Global Multi Touch Attribution Industry Revenue Million Forecast, by Country 2019 & 2032
- Table 16: Global Multi Touch Attribution Industry Volume K Unit Forecast, by Country 2019 & 2032
- Table 17: Germany Multi Touch Attribution Industry Revenue (Million) Forecast, by Application 2019 & 2032
- Table 18: Germany Multi Touch Attribution Industry Volume (K Unit) Forecast, by Application 2019 & 2032
- Table 19: United Kingdom Multi Touch Attribution Industry Revenue (Million) Forecast, by Application 2019 & 2032
- Table 20: United Kingdom Multi Touch Attribution Industry Volume (K Unit) Forecast, by Application 2019 & 2032
- Table 21: France Multi Touch Attribution Industry Revenue (Million) Forecast, by Application 2019 & 2032
- Table 22: France Multi Touch Attribution Industry Volume (K Unit) Forecast, by Application 2019 & 2032
- Table 23: Spain Multi Touch Attribution Industry Revenue (Million) Forecast, by Application 2019 & 2032
- Table 24: Spain Multi Touch Attribution Industry Volume (K Unit) Forecast, by Application 2019 & 2032
- Table 25: Italy Multi Touch Attribution Industry Revenue (Million) Forecast, by Application 2019 & 2032
- Table 26: Italy Multi Touch Attribution Industry Volume (K Unit) Forecast, by Application 2019 & 2032
- Table 27: Spain Multi Touch Attribution Industry Revenue (Million) Forecast, by Application 2019 & 2032
- Table 28: Spain Multi Touch Attribution Industry Volume (K Unit) Forecast, by Application 2019 & 2032
- Table 29: Belgium Multi Touch Attribution Industry Revenue (Million) Forecast, by Application 2019 & 2032
- Table 30: Belgium Multi Touch Attribution Industry Volume (K Unit) Forecast, by Application 2019 & 2032
- Table 31: Netherland Multi Touch Attribution Industry Revenue (Million) Forecast, by Application 2019 & 2032
- Table 32: Netherland Multi Touch Attribution Industry Volume (K Unit) Forecast, by Application 2019 & 2032
- Table 33: Nordics Multi Touch Attribution Industry Revenue (Million) Forecast, by Application 2019 & 2032
- Table 34: Nordics Multi Touch Attribution Industry Volume (K Unit) Forecast, by Application 2019 & 2032
- Table 35: Rest of Europe Multi Touch Attribution Industry Revenue (Million) Forecast, by Application 2019 & 2032
- Table 36: Rest of Europe Multi Touch Attribution Industry Volume (K Unit) Forecast, by Application 2019 & 2032
- Table 37: Global Multi Touch Attribution Industry Revenue Million Forecast, by Country 2019 & 2032
- Table 38: Global Multi Touch Attribution Industry Volume K Unit Forecast, by Country 2019 & 2032
- Table 39: China Multi Touch Attribution Industry Revenue (Million) Forecast, by Application 2019 & 2032
- Table 40: China Multi Touch Attribution Industry Volume (K Unit) Forecast, by Application 2019 & 2032
- Table 41: Japan Multi Touch Attribution Industry Revenue (Million) Forecast, by Application 2019 & 2032
- Table 42: Japan Multi Touch Attribution Industry Volume (K Unit) Forecast, by Application 2019 & 2032
- Table 43: India Multi Touch Attribution Industry Revenue (Million) Forecast, by Application 2019 & 2032
- Table 44: India Multi Touch Attribution Industry Volume (K Unit) Forecast, by Application 2019 & 2032
- Table 45: South Korea Multi Touch Attribution Industry Revenue (Million) Forecast, by Application 2019 & 2032
- Table 46: South Korea Multi Touch Attribution Industry Volume (K Unit) Forecast, by Application 2019 & 2032
- Table 47: Southeast Asia Multi Touch Attribution Industry Revenue (Million) Forecast, by Application 2019 & 2032
- Table 48: Southeast Asia Multi Touch Attribution Industry Volume (K Unit) Forecast, by Application 2019 & 2032
- Table 49: Australia Multi Touch Attribution Industry Revenue (Million) Forecast, by Application 2019 & 2032
- Table 50: Australia Multi Touch Attribution Industry Volume (K Unit) Forecast, by Application 2019 & 2032
- Table 51: Indonesia Multi Touch Attribution Industry Revenue (Million) Forecast, by Application 2019 & 2032
- Table 52: Indonesia Multi Touch Attribution Industry Volume (K Unit) Forecast, by Application 2019 & 2032
- Table 53: Phillipes Multi Touch Attribution Industry Revenue (Million) Forecast, by Application 2019 & 2032
- Table 54: Phillipes Multi Touch Attribution Industry Volume (K Unit) Forecast, by Application 2019 & 2032
- Table 55: Singapore Multi Touch Attribution Industry Revenue (Million) Forecast, by Application 2019 & 2032
- Table 56: Singapore Multi Touch Attribution Industry Volume (K Unit) Forecast, by Application 2019 & 2032
- Table 57: Thailandc Multi Touch Attribution Industry Revenue (Million) Forecast, by Application 2019 & 2032
- Table 58: Thailandc Multi Touch Attribution Industry Volume (K Unit) Forecast, by Application 2019 & 2032
- Table 59: Rest of Asia Pacific Multi Touch Attribution Industry Revenue (Million) Forecast, by Application 2019 & 2032
- Table 60: Rest of Asia Pacific Multi Touch Attribution Industry Volume (K Unit) Forecast, by Application 2019 & 2032
- Table 61: Global Multi Touch Attribution Industry Revenue Million Forecast, by Country 2019 & 2032
- Table 62: Global Multi Touch Attribution Industry Volume K Unit Forecast, by Country 2019 & 2032
- Table 63: Brazil Multi Touch Attribution Industry Revenue (Million) Forecast, by Application 2019 & 2032
- Table 64: Brazil Multi Touch Attribution Industry Volume (K Unit) Forecast, by Application 2019 & 2032
- Table 65: Argentina Multi Touch Attribution Industry Revenue (Million) Forecast, by Application 2019 & 2032
- Table 66: Argentina Multi Touch Attribution Industry Volume (K Unit) Forecast, by Application 2019 & 2032
- Table 67: Peru Multi Touch Attribution Industry Revenue (Million) Forecast, by Application 2019 & 2032
- Table 68: Peru Multi Touch Attribution Industry Volume (K Unit) Forecast, by Application 2019 & 2032
- Table 69: Chile Multi Touch Attribution Industry Revenue (Million) Forecast, by Application 2019 & 2032
- Table 70: Chile Multi Touch Attribution Industry Volume (K Unit) Forecast, by Application 2019 & 2032
- Table 71: Colombia Multi Touch Attribution Industry Revenue (Million) Forecast, by Application 2019 & 2032
- Table 72: Colombia Multi Touch Attribution Industry Volume (K Unit) Forecast, by Application 2019 & 2032
- Table 73: Ecuador Multi Touch Attribution Industry Revenue (Million) Forecast, by Application 2019 & 2032
- Table 74: Ecuador Multi Touch Attribution Industry Volume (K Unit) Forecast, by Application 2019 & 2032
- Table 75: Venezuela Multi Touch Attribution Industry Revenue (Million) Forecast, by Application 2019 & 2032
- Table 76: Venezuela Multi Touch Attribution Industry Volume (K Unit) Forecast, by Application 2019 & 2032
- Table 77: Rest of South America Multi Touch Attribution Industry Revenue (Million) Forecast, by Application 2019 & 2032
- Table 78: Rest of South America Multi Touch Attribution Industry Volume (K Unit) Forecast, by Application 2019 & 2032
- Table 79: Global Multi Touch Attribution Industry Revenue Million Forecast, by Country 2019 & 2032
- Table 80: Global Multi Touch Attribution Industry Volume K Unit Forecast, by Country 2019 & 2032
- Table 81: United States Multi Touch Attribution Industry Revenue (Million) Forecast, by Application 2019 & 2032
- Table 82: United States Multi Touch Attribution Industry Volume (K Unit) Forecast, by Application 2019 & 2032
- Table 83: Canada Multi Touch Attribution Industry Revenue (Million) Forecast, by Application 2019 & 2032
- Table 84: Canada Multi Touch Attribution Industry Volume (K Unit) Forecast, by Application 2019 & 2032
- Table 85: Mexico Multi Touch Attribution Industry Revenue (Million) Forecast, by Application 2019 & 2032
- Table 86: Mexico Multi Touch Attribution Industry Volume (K Unit) Forecast, by Application 2019 & 2032
- Table 87: Global Multi Touch Attribution Industry Revenue Million Forecast, by Country 2019 & 2032
- Table 88: Global Multi Touch Attribution Industry Volume K Unit Forecast, by Country 2019 & 2032
- Table 89: United Arab Emirates Multi Touch Attribution Industry Revenue (Million) Forecast, by Application 2019 & 2032
- Table 90: United Arab Emirates Multi Touch Attribution Industry Volume (K Unit) Forecast, by Application 2019 & 2032
- Table 91: Saudi Arabia Multi Touch Attribution Industry Revenue (Million) Forecast, by Application 2019 & 2032
- Table 92: Saudi Arabia Multi Touch Attribution Industry Volume (K Unit) Forecast, by Application 2019 & 2032
- Table 93: South Africa Multi Touch Attribution Industry Revenue (Million) Forecast, by Application 2019 & 2032
- Table 94: South Africa Multi Touch Attribution Industry Volume (K Unit) Forecast, by Application 2019 & 2032
- Table 95: Rest of Middle East and Africa Multi Touch Attribution Industry Revenue (Million) Forecast, by Application 2019 & 2032
- Table 96: Rest of Middle East and Africa Multi Touch Attribution Industry Volume (K Unit) Forecast, by Application 2019 & 2032
- Table 97: Global Multi Touch Attribution Industry Revenue Million Forecast, by End-user Industry 2019 & 2032
- Table 98: Global Multi Touch Attribution Industry Volume K Unit Forecast, by End-user Industry 2019 & 2032
- Table 99: Global Multi Touch Attribution Industry Revenue Million Forecast, by Country 2019 & 2032
- Table 100: Global Multi Touch Attribution Industry Volume K Unit Forecast, by Country 2019 & 2032
- Table 101: Global Multi Touch Attribution Industry Revenue Million Forecast, by End-user Industry 2019 & 2032
- Table 102: Global Multi Touch Attribution Industry Volume K Unit Forecast, by End-user Industry 2019 & 2032
- Table 103: Global Multi Touch Attribution Industry Revenue Million Forecast, by Country 2019 & 2032
- Table 104: Global Multi Touch Attribution Industry Volume K Unit Forecast, by Country 2019 & 2032
- Table 105: Global Multi Touch Attribution Industry Revenue Million Forecast, by End-user Industry 2019 & 2032
- Table 106: Global Multi Touch Attribution Industry Volume K Unit Forecast, by End-user Industry 2019 & 2032
- Table 107: Global Multi Touch Attribution Industry Revenue Million Forecast, by Country 2019 & 2032
- Table 108: Global Multi Touch Attribution Industry Volume K Unit Forecast, by Country 2019 & 2032
- Table 109: Global Multi Touch Attribution Industry Revenue Million Forecast, by End-user Industry 2019 & 2032
- Table 110: Global Multi Touch Attribution Industry Volume K Unit Forecast, by End-user Industry 2019 & 2032
- Table 111: Global Multi Touch Attribution Industry Revenue Million Forecast, by Country 2019 & 2032
- Table 112: Global Multi Touch Attribution Industry Volume K Unit Forecast, by Country 2019 & 2032
- Table 113: Global Multi Touch Attribution Industry Revenue Million Forecast, by End-user Industry 2019 & 2032
- Table 114: Global Multi Touch Attribution Industry Volume K Unit Forecast, by End-user Industry 2019 & 2032
- Table 115: Global Multi Touch Attribution Industry Revenue Million Forecast, by Country 2019 & 2032
- Table 116: Global Multi Touch Attribution Industry Volume K Unit Forecast, by Country 2019 & 2032
Frequently Asked Questions
1. What is the projected Compound Annual Growth Rate (CAGR) of the Multi Touch Attribution Industry?
The projected CAGR is approximately 13.64%.
2. Which companies are prominent players in the Multi Touch Attribution Industry?
Key companies in the market include The Nielsen Company, Conversion Logic Inc, Adobe Inc, Merkle Inc, Neustar Inc, Engagio Inc, Ipsos Group SA, Equifax Inc, AppsFlyer, LeadsRx Inc, LeanData Inc, Manthan.
3. What are the main segments of the Multi Touch Attribution Industry?
The market segments include End-user Industry.
4. Can you provide details about the market size?
The market size is estimated to be USD 2.14 Million as of 2022.
5. What are some drivers contributing to market growth?
Increasing Focus of Marketers on Maximizing the ROI; Growing Number of Marketing Channels and Need for Optimization of Marketing Expenditure; Adoption of Technology and Solutions such as AI. Big Data. and Cloud Computing in Marketing.
6. What are the notable trends driving market growth?
Retail & E-commerce Industry Expected to Show Maximum Growth.
7. Are there any restraints impacting market growth?
Skepticism About Shifting from Existing Marketing Practices. Training and Change Management.
8. Can you provide examples of recent developments in the market?
May 2022: Clinch and Neustar collaborated to give marketers a more comprehensive picture of attribution throughout their full campaign footprint. Neustar's Marketing Attribution solution can now be engaged within the Clinch UI, providing advertisers with extensive real-time insights into the channels, tactics, creatives, and other aspects of campaign performance.
9. What pricing options are available for accessing the report?
Pricing options include single-user, multi-user, and enterprise licenses priced at USD 4750, USD 5250, and USD 8750 respectively.
10. Is the market size provided in terms of value or volume?
The market size is provided in terms of value, measured in Million and volume, measured in K Unit.
11. Are there any specific market keywords associated with the report?
Yes, the market keyword associated with the report is "Multi Touch Attribution Industry," which aids in identifying and referencing the specific market segment covered.
12. How do I determine which pricing option suits my needs best?
The pricing options vary based on user requirements and access needs. Individual users may opt for single-user licenses, while businesses requiring broader access may choose multi-user or enterprise licenses for cost-effective access to the report.
13. Are there any additional resources or data provided in the Multi Touch Attribution Industry report?
While the report offers comprehensive insights, it's advisable to review the specific contents or supplementary materials provided to ascertain if additional resources or data are available.
14. How can I stay updated on further developments or reports in the Multi Touch Attribution Industry?
To stay informed about further developments, trends, and reports in the Multi Touch Attribution Industry, consider subscribing to industry newsletters, following relevant companies and organizations, or regularly checking reputable industry news sources and publications.
Methodology
Step 1 - Identification of Relevant Samples Size from Population Database


Step 2 - Approaches for Defining Global Market Size (Value, Volume* & Price*)

Note*: In applicable scenarios
Step 3 - Data Sources
Primary Research
- Web Analytics
- Survey Reports
- Research Institute
- Latest Research Reports
- Opinion Leaders
Secondary Research
- Annual Reports
- White Paper
- Latest Press Release
- Industry Association
- Paid Database
- Investor Presentations

Step 4 - Data Triangulation
Involves using different sources of information in order to increase the validity of a study
These sources are likely to be stakeholders in a program - participants, other researchers, program staff, other community members, and so on.
Then we put all data in single framework & apply various statistical tools to find out the dynamic on the market.
During the analysis stage, feedback from the stakeholder groups would be compared to determine areas of agreement as well as areas of divergence
