

Key Insights
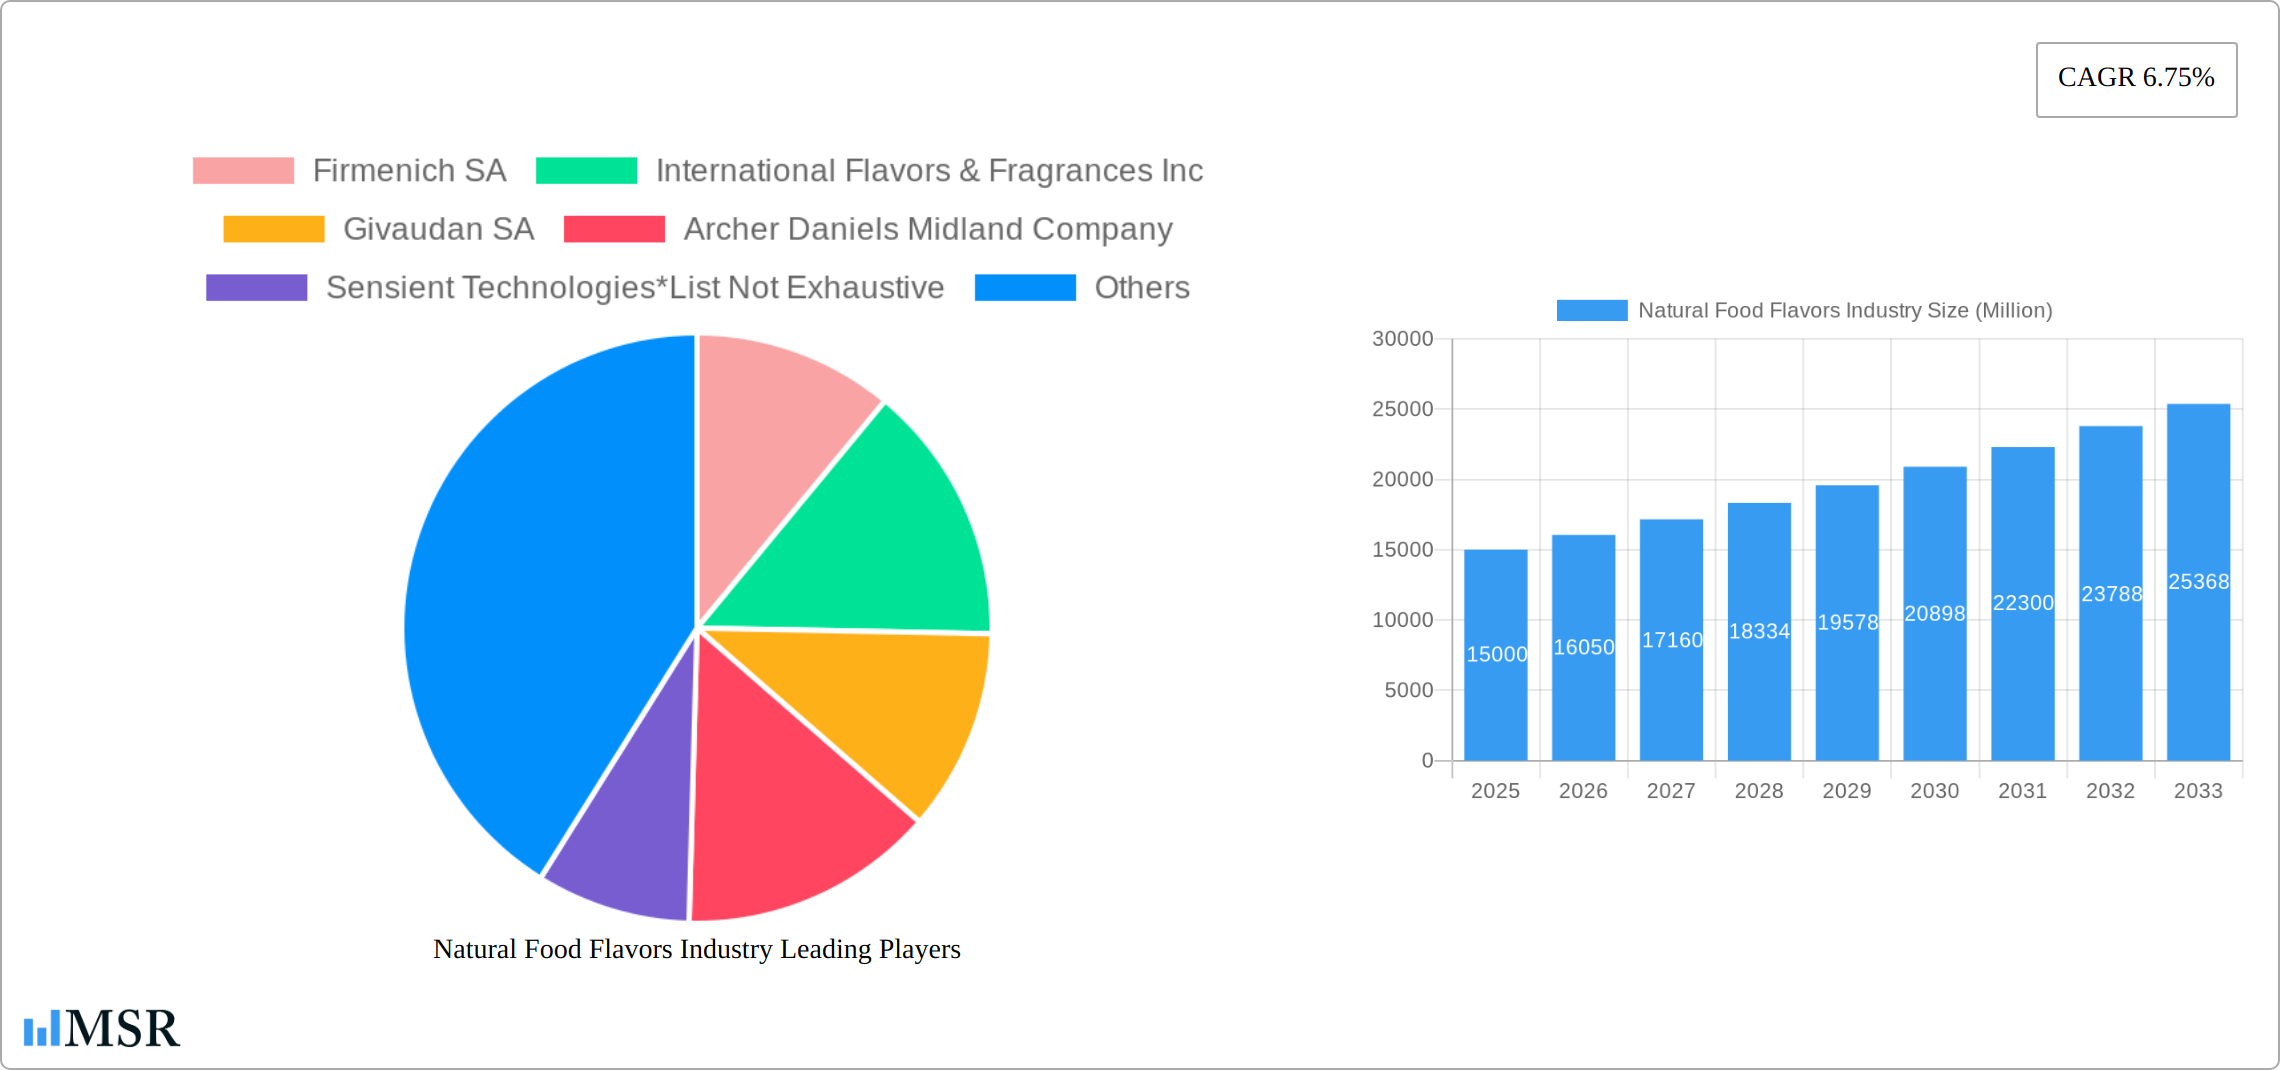
The natural food flavors market is experiencing robust growth, projected to reach a substantial size over the forecast period (2025-2033). A compound annual growth rate (CAGR) of 6.75% indicates a consistently expanding market driven by several key factors. The increasing consumer demand for clean-label products, free from artificial ingredients and preservatives, is a primary driver. This trend is particularly strong in the bakery, confectionery, and beverage sectors, where natural flavors enhance both taste and perceived health benefits. Growing health consciousness and a preference for natural and organic foods are further fueling market expansion. Furthermore, the burgeoning food processing industry, especially in developing economies, contributes to increased demand for natural food flavors to cater to a wider consumer base. Innovation in flavor profiles and the development of sustainable sourcing methods are also significant market trends. While potential restraints such as fluctuating raw material prices and stringent regulatory requirements exist, the overall market outlook remains positive.
The market segmentation reveals significant opportunities across various application types. Bakery and confectionery continue to be major consumers, leveraging natural flavors to create appealing and healthier products. The dairy and desserts segment is also experiencing strong growth due to the increasing demand for natural and organic dairy products. The beverages sector, encompassing both alcoholic and non-alcoholic drinks, presents a significant and growing market segment for natural food flavors. The savory and snacks category also shows strong potential, particularly with the rise of healthy snacking trends. Regionally, North America and Europe currently hold significant market shares, but the Asia-Pacific region is projected to witness substantial growth driven by rising disposable incomes and changing consumer preferences. Major players such as Firmenich SA, International Flavors & Fragrances Inc., and Givaudan SA are strategically positioned to benefit from these trends through product innovation and expansion into new markets. Competition is intense, driving innovation and efficiency throughout the industry. The forecast period, extending to 2033, provides a broad view of potential market expansion, highlighting the continuing relevance and growth prospects of natural food flavors.
Natural Food Flavors Market Report: 2019-2033 Forecast
This comprehensive report provides an in-depth analysis of the Natural Food Flavors industry, offering valuable insights for stakeholders, investors, and industry professionals. The study covers the period 2019-2033, with a focus on the forecast period 2025-2033 and a base year of 2025. The report projects a market valued at xx Million by 2033, exhibiting a CAGR of xx% during the forecast period.
Natural Food Flavors Industry Market Concentration & Dynamics
The natural food flavors market is moderately concentrated, with key players like Firmenich SA, International Flavors & Fragrances Inc., Givaudan SA, Archer Daniels Midland Company, and Sensient Technologies holding significant market share. However, the presence of several smaller, specialized companies fosters a dynamic competitive landscape. Market share estimations for 2025 are: Firmenich SA (xx%), IFF (xx%), Givaudan SA (xx%), ADM (xx%), Sensient (xx%). The remaining share is distributed amongst other players, including BASF SE, Kerry Group PLC, and Corbion NV. Innovation is driven by consumer demand for clean-label products and evolving flavor profiles. Stringent regulatory frameworks regarding labeling and ingredient sourcing present challenges and opportunities for innovation. Substitute products, like natural extracts and essential oils, exert competitive pressure. M&A activity is robust, with xx major deals recorded between 2019 and 2024, mainly driven by companies seeking to expand their product portfolios and geographic reach. The increasing demand for natural and organic food products fuels the market's growth, while consumer preference towards clean labels and specific flavor profiles continues to shape industry trends.
Natural Food Flavors Industry Industry Insights & Trends
The global natural food flavors market is experiencing robust growth, driven by several key factors. The rising consumer preference for natural and healthy food products is a primary catalyst, pushing manufacturers to adopt cleaner labels and more sustainable sourcing practices. Technological advancements in flavor extraction and modification techniques are contributing to the expansion of the product portfolio, particularly in the creation of novel and customized flavors tailored to specific consumer preferences. Changing lifestyles, a rising disposable income, especially in emerging markets, and increased urbanization are all contributing to the escalating demand for convenient, ready-to-eat meals and snacks, which, in turn, are fueling the need for natural food flavors. The market size in 2025 is estimated at xx Million, growing from xx Million in 2019. The industry's growth trajectory is poised to continue its upward trend, driven by both established and emerging markets.

Key Markets & Segments Leading Natural Food Flavors Industry
The dominant segment within the natural food flavors market is the Beverages sector, followed closely by Confectionery and Bakery. The North American and European regions currently hold the largest market share.
- Drivers for growth in Beverages: Growing popularity of functional beverages, increasing demand for natural flavor profiles in soft drinks and juices, health-conscious consumer base.
- Drivers for growth in Confectionery: The increasing consumption of chocolates, candies, and other confectionery products, innovative flavors, and premiumization of confectionery offerings.
- Drivers for growth in Bakery: Rising demand for bakery products with natural flavors, increasing consumption of artisanal breads and pastries.
Asia-Pacific region, particularly China and India, are demonstrating significant growth potential, driven by expanding middle classes, changing dietary habits, and increasing disposable incomes. The growth of these emerging economies is expected to create numerous opportunities for natural food flavor manufacturers in the years to come.
Natural Food Flavors Industry Product Developments
Recent product innovations focus on developing clean-label, sustainable, and allergen-free flavors. Advances in extraction and encapsulation technologies allow for better flavor stability and delivery systems. The industry is moving towards more customized and targeted flavor solutions, catering to specific dietary needs and regional preferences, thus offering a competitive edge.
Challenges in the Natural Food Flavors Industry Market
The industry faces challenges including stringent regulatory compliance, fluctuations in raw material prices, and intense competition, with the need for continuous innovation and cost-effective production crucial for staying ahead. Supply chain disruptions and the increasing cost of natural raw materials significantly impact profitability.
Forces Driving Natural Food Flavors Industry Growth
Technological advancements in flavor extraction, increasing consumer demand for natural and clean-label products, and expanding global markets are key drivers. The rise of health-conscious consumers and the growing demand for natural food products are also fueling market growth. Favorable government regulations supporting the use of natural ingredients also contribute significantly.
Long-Term Growth Catalysts in Natural Food Flavors Industry
Long-term growth relies on strategic partnerships, research and development in novel flavor creation and delivery systems, and expansion into new geographical markets, especially emerging economies with growing demand for convenience foods. Focus on sustainability and ethical sourcing will also be crucial.
Emerging Opportunities in Natural Food Flavors Industry
The growing demand for customized flavors, increasing interest in functional foods and beverages, and the expansion of plant-based alternatives present lucrative opportunities. Focus on creating innovative flavors for niche markets, like vegan and gluten-free products, holds significant potential.
Leading Players in the Natural Food Flavors Industry Sector
- Firmenich SA
- International Flavors & Fragrances Inc.
- Givaudan SA
- Archer Daniels Midland Company
- Sensient Technologies
- BASF SE
- Kerry Group PLC
- Corbion NV
Key Milestones in Natural Food Flavors Industry Industry
- 2020: Increased focus on sustainable sourcing practices by major players.
- 2021: Launch of several new clean-label flavor solutions by leading companies.
- 2022: Significant M&A activity, with several companies acquiring smaller, specialized flavor houses.
- 2023: Growing adoption of innovative extraction and encapsulation technologies.
Strategic Outlook for Natural Food Flavors Industry Market
The natural food flavors market is poised for robust growth, driven by ongoing consumer demand, technological innovation, and expanding market opportunities. Strategic alliances, expansion into new product segments and geographical markets, and focus on sustainability will be crucial for long-term success.
Natural Food Flavors Industry Segmentation
-
1. Application Type
- 1.1. Bakery
- 1.2. Confectionery
- 1.3. Dairy and Desserts
-
1.4. Beverages
- 1.4.1. Alcoholic
- 1.4.2. Non-alcoholic
- 1.5. Savory and Snacks
- 1.6. Meat and Meat Products
- 1.7. Sauces, Soups, and Seasonings
- 1.8. Other Applications
Natural Food Flavors Industry Segmentation By Geography
-
1. North America
- 1.1. United States
- 1.2. Canada
- 1.3. Mexico
- 1.4. Rest of North America
-
2. Europe
- 2.1. Germany
- 2.2. United Kingdom
- 2.3. France
- 2.4. Spain
- 2.5. Italy
- 2.6. Rest of Europe
-
3. Asia Pacific
- 3.1. China
- 3.2. Japan
- 3.3. India
- 3.4. Australia
- 3.5. Rest of Asia Pacific
-
4. Rest of the World
- 4.1. South America
- 4.2. Middle East

Natural Food Flavors Industry REPORT HIGHLIGHTS
| Aspects | Details |
|---|---|
| Study Period | 2019-2033 |
| Base Year | 2024 |
| Estimated Year | 2025 |
| Forecast Period | 2025-2033 |
| Historical Period | 2019-2024 |
| Growth Rate | CAGR of 6.75% from 2019-2033 |
| Segmentation |
|
Table of Contents
- 1. Introduction
- 1.1. Research Scope
- 1.2. Market Segmentation
- 1.3. Research Methodology
- 1.4. Definitions and Assumptions
- 2. Executive Summary
- 2.1. Introduction
- 3. Market Dynamics
- 3.1. Introduction
- 3.2. Market Drivers
- 3.2.1. Demand for Convenient Ready-to-Eat Food Products; Growing Affinity Toward Ethnic and Organic Frozen Ready Meals
- 3.3. Market Restrains
- 3.3.1. Rising Concerns Over Food Safety and Quality
- 3.4. Market Trends
- 3.4.1. Resurgance of Natural Food Products Among Consumers
- 4. Market Factor Analysis
- 4.1. Porters Five Forces
- 4.2. Supply/Value Chain
- 4.3. PESTEL analysis
- 4.4. Market Entropy
- 4.5. Patent/Trademark Analysis
- 5. Global Natural Food Flavors Industry Analysis, Insights and Forecast, 2019-2031
- 5.1. Market Analysis, Insights and Forecast - by Application Type
- 5.1.1. Bakery
- 5.1.2. Confectionery
- 5.1.3. Dairy and Desserts
- 5.1.4. Beverages
- 5.1.4.1. Alcoholic
- 5.1.4.2. Non-alcoholic
- 5.1.5. Savory and Snacks
- 5.1.6. Meat and Meat Products
- 5.1.7. Sauces, Soups, and Seasonings
- 5.1.8. Other Applications
- 5.2. Market Analysis, Insights and Forecast - by Region
- 5.2.1. North America
- 5.2.2. Europe
- 5.2.3. Asia Pacific
- 5.2.4. Rest of the World
- 5.1. Market Analysis, Insights and Forecast - by Application Type
- 6. North America Natural Food Flavors Industry Analysis, Insights and Forecast, 2019-2031
- 6.1. Market Analysis, Insights and Forecast - by Application Type
- 6.1.1. Bakery
- 6.1.2. Confectionery
- 6.1.3. Dairy and Desserts
- 6.1.4. Beverages
- 6.1.4.1. Alcoholic
- 6.1.4.2. Non-alcoholic
- 6.1.5. Savory and Snacks
- 6.1.6. Meat and Meat Products
- 6.1.7. Sauces, Soups, and Seasonings
- 6.1.8. Other Applications
- 6.1. Market Analysis, Insights and Forecast - by Application Type
- 7. Europe Natural Food Flavors Industry Analysis, Insights and Forecast, 2019-2031
- 7.1. Market Analysis, Insights and Forecast - by Application Type
- 7.1.1. Bakery
- 7.1.2. Confectionery
- 7.1.3. Dairy and Desserts
- 7.1.4. Beverages
- 7.1.4.1. Alcoholic
- 7.1.4.2. Non-alcoholic
- 7.1.5. Savory and Snacks
- 7.1.6. Meat and Meat Products
- 7.1.7. Sauces, Soups, and Seasonings
- 7.1.8. Other Applications
- 7.1. Market Analysis, Insights and Forecast - by Application Type
- 8. Asia Pacific Natural Food Flavors Industry Analysis, Insights and Forecast, 2019-2031
- 8.1. Market Analysis, Insights and Forecast - by Application Type
- 8.1.1. Bakery
- 8.1.2. Confectionery
- 8.1.3. Dairy and Desserts
- 8.1.4. Beverages
- 8.1.4.1. Alcoholic
- 8.1.4.2. Non-alcoholic
- 8.1.5. Savory and Snacks
- 8.1.6. Meat and Meat Products
- 8.1.7. Sauces, Soups, and Seasonings
- 8.1.8. Other Applications
- 8.1. Market Analysis, Insights and Forecast - by Application Type
- 9. Rest of the World Natural Food Flavors Industry Analysis, Insights and Forecast, 2019-2031
- 9.1. Market Analysis, Insights and Forecast - by Application Type
- 9.1.1. Bakery
- 9.1.2. Confectionery
- 9.1.3. Dairy and Desserts
- 9.1.4. Beverages
- 9.1.4.1. Alcoholic
- 9.1.4.2. Non-alcoholic
- 9.1.5. Savory and Snacks
- 9.1.6. Meat and Meat Products
- 9.1.7. Sauces, Soups, and Seasonings
- 9.1.8. Other Applications
- 9.1. Market Analysis, Insights and Forecast - by Application Type
- 10. North America Natural Food Flavors Industry Analysis, Insights and Forecast, 2019-2031
- 10.1. Market Analysis, Insights and Forecast - By Country/Sub-region
- 10.1.1 United States
- 10.1.2 Canada
- 10.1.3 Mexico
- 11. Europe Natural Food Flavors Industry Analysis, Insights and Forecast, 2019-2031
- 11.1. Market Analysis, Insights and Forecast - By Country/Sub-region
- 11.1.1 Germany
- 11.1.2 United Kingdom
- 11.1.3 France
- 11.1.4 Spain
- 11.1.5 Italy
- 11.1.6 Spain
- 11.1.7 Belgium
- 11.1.8 Netherland
- 11.1.9 Nordics
- 11.1.10 Rest of Europe
- 12. Asia Pacific Natural Food Flavors Industry Analysis, Insights and Forecast, 2019-2031
- 12.1. Market Analysis, Insights and Forecast - By Country/Sub-region
- 12.1.1 China
- 12.1.2 Japan
- 12.1.3 India
- 12.1.4 South Korea
- 12.1.5 Southeast Asia
- 12.1.6 Australia
- 12.1.7 Indonesia
- 12.1.8 Phillipes
- 12.1.9 Singapore
- 12.1.10 Thailandc
- 12.1.11 Rest of Asia Pacific
- 13. South America Natural Food Flavors Industry Analysis, Insights and Forecast, 2019-2031
- 13.1. Market Analysis, Insights and Forecast - By Country/Sub-region
- 13.1.1 Brazil
- 13.1.2 Argentina
- 13.1.3 Peru
- 13.1.4 Chile
- 13.1.5 Colombia
- 13.1.6 Ecuador
- 13.1.7 Venezuela
- 13.1.8 Rest of South America
- 14. Middle East & Africa Natural Food Flavors Industry Analysis, Insights and Forecast, 2019-2031
- 14.1. Market Analysis, Insights and Forecast - By Country/Sub-region
- 14.1.1 UAE
- 14.1.2 South Africa
- 14.1.3 Saudi Arabia
- 14.1.4 Rest of MEA
- 15. Competitive Analysis
- 15.1. Global Market Share Analysis 2024
- 15.2. Company Profiles
- 15.2.1 Firmenich SA
- 15.2.1.1. Overview
- 15.2.1.2. Products
- 15.2.1.3. SWOT Analysis
- 15.2.1.4. Recent Developments
- 15.2.1.5. Financials (Based on Availability)
- 15.2.2 International Flavors & Fragrances Inc
- 15.2.2.1. Overview
- 15.2.2.2. Products
- 15.2.2.3. SWOT Analysis
- 15.2.2.4. Recent Developments
- 15.2.2.5. Financials (Based on Availability)
- 15.2.3 Givaudan SA
- 15.2.3.1. Overview
- 15.2.3.2. Products
- 15.2.3.3. SWOT Analysis
- 15.2.3.4. Recent Developments
- 15.2.3.5. Financials (Based on Availability)
- 15.2.4 Archer Daniels Midland Company
- 15.2.4.1. Overview
- 15.2.4.2. Products
- 15.2.4.3. SWOT Analysis
- 15.2.4.4. Recent Developments
- 15.2.4.5. Financials (Based on Availability)
- 15.2.5 Sensient Technologies*List Not Exhaustive
- 15.2.5.1. Overview
- 15.2.5.2. Products
- 15.2.5.3. SWOT Analysis
- 15.2.5.4. Recent Developments
- 15.2.5.5. Financials (Based on Availability)
- 15.2.6 BASF SE
- 15.2.6.1. Overview
- 15.2.6.2. Products
- 15.2.6.3. SWOT Analysis
- 15.2.6.4. Recent Developments
- 15.2.6.5. Financials (Based on Availability)
- 15.2.7 Kerry Group PLC
- 15.2.7.1. Overview
- 15.2.7.2. Products
- 15.2.7.3. SWOT Analysis
- 15.2.7.4. Recent Developments
- 15.2.7.5. Financials (Based on Availability)
- 15.2.8 Corbion NV
- 15.2.8.1. Overview
- 15.2.8.2. Products
- 15.2.8.3. SWOT Analysis
- 15.2.8.4. Recent Developments
- 15.2.8.5. Financials (Based on Availability)
- 15.2.1 Firmenich SA
List of Figures
- Figure 1: Global Natural Food Flavors Industry Revenue Breakdown (Million, %) by Region 2024 & 2032
- Figure 2: North America Natural Food Flavors Industry Revenue (Million), by Country 2024 & 2032
- Figure 3: North America Natural Food Flavors Industry Revenue Share (%), by Country 2024 & 2032
- Figure 4: Europe Natural Food Flavors Industry Revenue (Million), by Country 2024 & 2032
- Figure 5: Europe Natural Food Flavors Industry Revenue Share (%), by Country 2024 & 2032
- Figure 6: Asia Pacific Natural Food Flavors Industry Revenue (Million), by Country 2024 & 2032
- Figure 7: Asia Pacific Natural Food Flavors Industry Revenue Share (%), by Country 2024 & 2032
- Figure 8: South America Natural Food Flavors Industry Revenue (Million), by Country 2024 & 2032
- Figure 9: South America Natural Food Flavors Industry Revenue Share (%), by Country 2024 & 2032
- Figure 10: Middle East & Africa Natural Food Flavors Industry Revenue (Million), by Country 2024 & 2032
- Figure 11: Middle East & Africa Natural Food Flavors Industry Revenue Share (%), by Country 2024 & 2032
- Figure 12: North America Natural Food Flavors Industry Revenue (Million), by Application Type 2024 & 2032
- Figure 13: North America Natural Food Flavors Industry Revenue Share (%), by Application Type 2024 & 2032
- Figure 14: North America Natural Food Flavors Industry Revenue (Million), by Country 2024 & 2032
- Figure 15: North America Natural Food Flavors Industry Revenue Share (%), by Country 2024 & 2032
- Figure 16: Europe Natural Food Flavors Industry Revenue (Million), by Application Type 2024 & 2032
- Figure 17: Europe Natural Food Flavors Industry Revenue Share (%), by Application Type 2024 & 2032
- Figure 18: Europe Natural Food Flavors Industry Revenue (Million), by Country 2024 & 2032
- Figure 19: Europe Natural Food Flavors Industry Revenue Share (%), by Country 2024 & 2032
- Figure 20: Asia Pacific Natural Food Flavors Industry Revenue (Million), by Application Type 2024 & 2032
- Figure 21: Asia Pacific Natural Food Flavors Industry Revenue Share (%), by Application Type 2024 & 2032
- Figure 22: Asia Pacific Natural Food Flavors Industry Revenue (Million), by Country 2024 & 2032
- Figure 23: Asia Pacific Natural Food Flavors Industry Revenue Share (%), by Country 2024 & 2032
- Figure 24: Rest of the World Natural Food Flavors Industry Revenue (Million), by Application Type 2024 & 2032
- Figure 25: Rest of the World Natural Food Flavors Industry Revenue Share (%), by Application Type 2024 & 2032
- Figure 26: Rest of the World Natural Food Flavors Industry Revenue (Million), by Country 2024 & 2032
- Figure 27: Rest of the World Natural Food Flavors Industry Revenue Share (%), by Country 2024 & 2032
List of Tables
- Table 1: Global Natural Food Flavors Industry Revenue Million Forecast, by Region 2019 & 2032
- Table 2: Global Natural Food Flavors Industry Revenue Million Forecast, by Application Type 2019 & 2032
- Table 3: Global Natural Food Flavors Industry Revenue Million Forecast, by Region 2019 & 2032
- Table 4: Global Natural Food Flavors Industry Revenue Million Forecast, by Country 2019 & 2032
- Table 5: United States Natural Food Flavors Industry Revenue (Million) Forecast, by Application 2019 & 2032
- Table 6: Canada Natural Food Flavors Industry Revenue (Million) Forecast, by Application 2019 & 2032
- Table 7: Mexico Natural Food Flavors Industry Revenue (Million) Forecast, by Application 2019 & 2032
- Table 8: Global Natural Food Flavors Industry Revenue Million Forecast, by Country 2019 & 2032
- Table 9: Germany Natural Food Flavors Industry Revenue (Million) Forecast, by Application 2019 & 2032
- Table 10: United Kingdom Natural Food Flavors Industry Revenue (Million) Forecast, by Application 2019 & 2032
- Table 11: France Natural Food Flavors Industry Revenue (Million) Forecast, by Application 2019 & 2032
- Table 12: Spain Natural Food Flavors Industry Revenue (Million) Forecast, by Application 2019 & 2032
- Table 13: Italy Natural Food Flavors Industry Revenue (Million) Forecast, by Application 2019 & 2032
- Table 14: Spain Natural Food Flavors Industry Revenue (Million) Forecast, by Application 2019 & 2032
- Table 15: Belgium Natural Food Flavors Industry Revenue (Million) Forecast, by Application 2019 & 2032
- Table 16: Netherland Natural Food Flavors Industry Revenue (Million) Forecast, by Application 2019 & 2032
- Table 17: Nordics Natural Food Flavors Industry Revenue (Million) Forecast, by Application 2019 & 2032
- Table 18: Rest of Europe Natural Food Flavors Industry Revenue (Million) Forecast, by Application 2019 & 2032
- Table 19: Global Natural Food Flavors Industry Revenue Million Forecast, by Country 2019 & 2032
- Table 20: China Natural Food Flavors Industry Revenue (Million) Forecast, by Application 2019 & 2032
- Table 21: Japan Natural Food Flavors Industry Revenue (Million) Forecast, by Application 2019 & 2032
- Table 22: India Natural Food Flavors Industry Revenue (Million) Forecast, by Application 2019 & 2032
- Table 23: South Korea Natural Food Flavors Industry Revenue (Million) Forecast, by Application 2019 & 2032
- Table 24: Southeast Asia Natural Food Flavors Industry Revenue (Million) Forecast, by Application 2019 & 2032
- Table 25: Australia Natural Food Flavors Industry Revenue (Million) Forecast, by Application 2019 & 2032
- Table 26: Indonesia Natural Food Flavors Industry Revenue (Million) Forecast, by Application 2019 & 2032
- Table 27: Phillipes Natural Food Flavors Industry Revenue (Million) Forecast, by Application 2019 & 2032
- Table 28: Singapore Natural Food Flavors Industry Revenue (Million) Forecast, by Application 2019 & 2032
- Table 29: Thailandc Natural Food Flavors Industry Revenue (Million) Forecast, by Application 2019 & 2032
- Table 30: Rest of Asia Pacific Natural Food Flavors Industry Revenue (Million) Forecast, by Application 2019 & 2032
- Table 31: Global Natural Food Flavors Industry Revenue Million Forecast, by Country 2019 & 2032
- Table 32: Brazil Natural Food Flavors Industry Revenue (Million) Forecast, by Application 2019 & 2032
- Table 33: Argentina Natural Food Flavors Industry Revenue (Million) Forecast, by Application 2019 & 2032
- Table 34: Peru Natural Food Flavors Industry Revenue (Million) Forecast, by Application 2019 & 2032
- Table 35: Chile Natural Food Flavors Industry Revenue (Million) Forecast, by Application 2019 & 2032
- Table 36: Colombia Natural Food Flavors Industry Revenue (Million) Forecast, by Application 2019 & 2032
- Table 37: Ecuador Natural Food Flavors Industry Revenue (Million) Forecast, by Application 2019 & 2032
- Table 38: Venezuela Natural Food Flavors Industry Revenue (Million) Forecast, by Application 2019 & 2032
- Table 39: Rest of South America Natural Food Flavors Industry Revenue (Million) Forecast, by Application 2019 & 2032
- Table 40: Global Natural Food Flavors Industry Revenue Million Forecast, by Country 2019 & 2032
- Table 41: UAE Natural Food Flavors Industry Revenue (Million) Forecast, by Application 2019 & 2032
- Table 42: South Africa Natural Food Flavors Industry Revenue (Million) Forecast, by Application 2019 & 2032
- Table 43: Saudi Arabia Natural Food Flavors Industry Revenue (Million) Forecast, by Application 2019 & 2032
- Table 44: Rest of MEA Natural Food Flavors Industry Revenue (Million) Forecast, by Application 2019 & 2032
- Table 45: Global Natural Food Flavors Industry Revenue Million Forecast, by Application Type 2019 & 2032
- Table 46: Global Natural Food Flavors Industry Revenue Million Forecast, by Country 2019 & 2032
- Table 47: United States Natural Food Flavors Industry Revenue (Million) Forecast, by Application 2019 & 2032
- Table 48: Canada Natural Food Flavors Industry Revenue (Million) Forecast, by Application 2019 & 2032
- Table 49: Mexico Natural Food Flavors Industry Revenue (Million) Forecast, by Application 2019 & 2032
- Table 50: Rest of North America Natural Food Flavors Industry Revenue (Million) Forecast, by Application 2019 & 2032
- Table 51: Global Natural Food Flavors Industry Revenue Million Forecast, by Application Type 2019 & 2032
- Table 52: Global Natural Food Flavors Industry Revenue Million Forecast, by Country 2019 & 2032
- Table 53: Germany Natural Food Flavors Industry Revenue (Million) Forecast, by Application 2019 & 2032
- Table 54: United Kingdom Natural Food Flavors Industry Revenue (Million) Forecast, by Application 2019 & 2032
- Table 55: France Natural Food Flavors Industry Revenue (Million) Forecast, by Application 2019 & 2032
- Table 56: Spain Natural Food Flavors Industry Revenue (Million) Forecast, by Application 2019 & 2032
- Table 57: Italy Natural Food Flavors Industry Revenue (Million) Forecast, by Application 2019 & 2032
- Table 58: Rest of Europe Natural Food Flavors Industry Revenue (Million) Forecast, by Application 2019 & 2032
- Table 59: Global Natural Food Flavors Industry Revenue Million Forecast, by Application Type 2019 & 2032
- Table 60: Global Natural Food Flavors Industry Revenue Million Forecast, by Country 2019 & 2032
- Table 61: China Natural Food Flavors Industry Revenue (Million) Forecast, by Application 2019 & 2032
- Table 62: Japan Natural Food Flavors Industry Revenue (Million) Forecast, by Application 2019 & 2032
- Table 63: India Natural Food Flavors Industry Revenue (Million) Forecast, by Application 2019 & 2032
- Table 64: Australia Natural Food Flavors Industry Revenue (Million) Forecast, by Application 2019 & 2032
- Table 65: Rest of Asia Pacific Natural Food Flavors Industry Revenue (Million) Forecast, by Application 2019 & 2032
- Table 66: Global Natural Food Flavors Industry Revenue Million Forecast, by Application Type 2019 & 2032
- Table 67: Global Natural Food Flavors Industry Revenue Million Forecast, by Country 2019 & 2032
- Table 68: South America Natural Food Flavors Industry Revenue (Million) Forecast, by Application 2019 & 2032
- Table 69: Middle East Natural Food Flavors Industry Revenue (Million) Forecast, by Application 2019 & 2032
Frequently Asked Questions
1. What is the projected Compound Annual Growth Rate (CAGR) of the Natural Food Flavors Industry?
The projected CAGR is approximately 6.75%.
2. Which companies are prominent players in the Natural Food Flavors Industry?
Key companies in the market include Firmenich SA, International Flavors & Fragrances Inc, Givaudan SA, Archer Daniels Midland Company, Sensient Technologies*List Not Exhaustive, BASF SE, Kerry Group PLC, Corbion NV.
3. What are the main segments of the Natural Food Flavors Industry?
The market segments include Application Type.
4. Can you provide details about the market size?
The market size is estimated to be USD XX Million as of 2022.
5. What are some drivers contributing to market growth?
Demand for Convenient Ready-to-Eat Food Products; Growing Affinity Toward Ethnic and Organic Frozen Ready Meals.
6. What are the notable trends driving market growth?
Resurgance of Natural Food Products Among Consumers.
7. Are there any restraints impacting market growth?
Rising Concerns Over Food Safety and Quality.
8. Can you provide examples of recent developments in the market?
N/A
9. What pricing options are available for accessing the report?
Pricing options include single-user, multi-user, and enterprise licenses priced at USD 4750, USD 5250, and USD 8750 respectively.
10. Is the market size provided in terms of value or volume?
The market size is provided in terms of value, measured in Million.
11. Are there any specific market keywords associated with the report?
Yes, the market keyword associated with the report is "Natural Food Flavors Industry," which aids in identifying and referencing the specific market segment covered.
12. How do I determine which pricing option suits my needs best?
The pricing options vary based on user requirements and access needs. Individual users may opt for single-user licenses, while businesses requiring broader access may choose multi-user or enterprise licenses for cost-effective access to the report.
13. Are there any additional resources or data provided in the Natural Food Flavors Industry report?
While the report offers comprehensive insights, it's advisable to review the specific contents or supplementary materials provided to ascertain if additional resources or data are available.
14. How can I stay updated on further developments or reports in the Natural Food Flavors Industry?
To stay informed about further developments, trends, and reports in the Natural Food Flavors Industry, consider subscribing to industry newsletters, following relevant companies and organizations, or regularly checking reputable industry news sources and publications.
Methodology
Step 1 - Identification of Relevant Samples Size from Population Database


Step 2 - Approaches for Defining Global Market Size (Value, Volume* & Price*)

Note*: In applicable scenarios
Step 3 - Data Sources
Primary Research
- Web Analytics
- Survey Reports
- Research Institute
- Latest Research Reports
- Opinion Leaders
Secondary Research
- Annual Reports
- White Paper
- Latest Press Release
- Industry Association
- Paid Database
- Investor Presentations

Step 4 - Data Triangulation
Involves using different sources of information in order to increase the validity of a study
These sources are likely to be stakeholders in a program - participants, other researchers, program staff, other community members, and so on.
Then we put all data in single framework & apply various statistical tools to find out the dynamic on the market.
During the analysis stage, feedback from the stakeholder groups would be compared to determine areas of agreement as well as areas of divergence
