

Key Insights
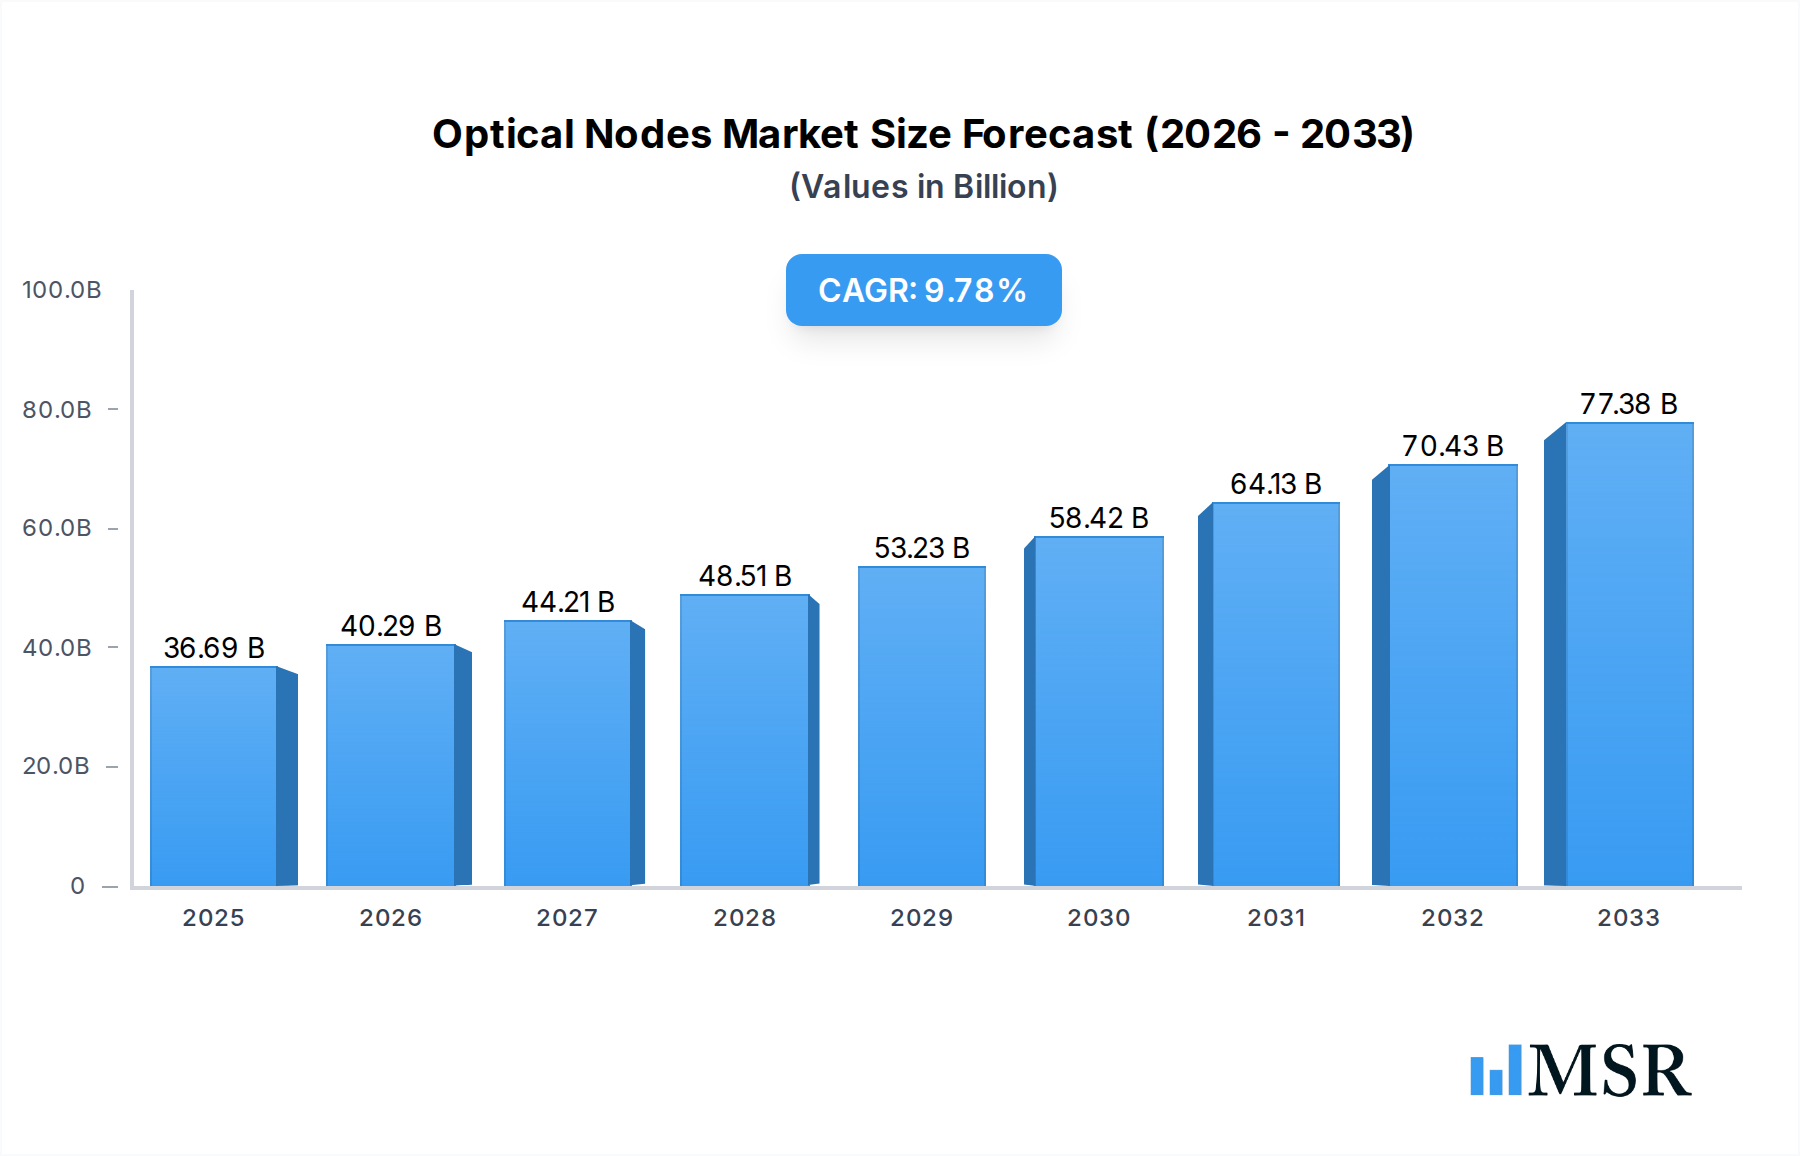
The global Optical Nodes market is poised for significant expansion, projected to reach a substantial $36.69 billion valuation in 2025. This robust growth is fueled by the escalating demand for high-speed internet connectivity and the continuous deployment of fiber optic networks across residential, enterprise, and industrial sectors. The market's upward trajectory is further bolstered by the ongoing digital transformation initiatives worldwide, which necessitate advanced networking infrastructure capable of supporting data-intensive applications and services. Key drivers include the increasing penetration of Fiber-to-the-Home (FTTH) and Fiber-to-the-Business (FTTB) services, driven by consumer demand for enhanced entertainment, remote work capabilities, and seamless cloud access. Technological advancements in optical node design, leading to improved efficiency, scalability, and integration capabilities, are also playing a crucial role. The market is witnessing a consistent CAGR of 9.8%, indicating a strong and sustained expansion over the forecast period. This growth signifies substantial opportunities for market players to innovate and capitalize on the evolving networking landscape.

Optical Nodes Market Size (In Billion)
The competitive landscape of the Optical Nodes market is characterized by a diverse range of established players and emerging innovators, all vying to capture market share through product differentiation, strategic partnerships, and geographical expansion. The market segments, broadly categorized by application into FTTH, FTTB, FTTC, and Other, highlight the widespread adoption of optical node technology. In terms of type, Single Output Node and Multiple Output Node offerings cater to varied deployment needs, from individual premises to larger complexes. Geographically, North America and Europe are currently leading the market, driven by advanced infrastructure and high broadband penetration. However, the Asia Pacific region, particularly China and India, is expected to exhibit the fastest growth due to massive investments in 5G rollout and the expansion of digital infrastructure to underserved areas. While market growth is strong, potential challenges such as high initial deployment costs and the need for skilled labor for installation and maintenance could moderate the pace in certain regions. Nevertheless, the overarching trend points towards continued, strong market expansion.
Optical Nodes Company Market Share
Optical Nodes Market Report: Unlocking Next-Generation Connectivity (2019-2033)
This comprehensive report delves into the dynamic optical nodes market, a critical component in the evolution of broadband infrastructure. Analyzing the period from 2019 to 2033, with a base year of 2025, this study offers unparalleled insights into market concentration, industry trends, key market segments, product developments, challenges, growth drivers, emerging opportunities, leading players, and strategic outlook. With an estimated optical nodes market size projected to reach billions, this report is an indispensable resource for telecommunications operators, equipment manufacturers, investors, and industry stakeholders seeking to navigate the rapidly expanding landscape of high-speed internet access.
Optical Nodes Market Concentration & Dynamics
The optical nodes market exhibits a moderate level of concentration, characterized by a blend of established global players and emerging regional specialists. Innovation ecosystems are thriving, driven by continuous advancements in fiber optics and PON technology. Regulatory frameworks, particularly those promoting broadband deployment and competition, significantly influence market entry and growth. Substitute products, such as coaxial cable networks, are gradually being eclipsed by the superior performance and scalability of fiber-based solutions. End-user trends are overwhelmingly favoring higher bandwidth demands, fueled by the proliferation of streaming services, cloud computing, and the Internet of Things (IoT). Mergers and acquisitions (M&A) activities, while not a daily occurrence, have played a pivotal role in consolidating market share and expanding technological portfolios. For instance, several billion-dollar M&A deals have reshaped the competitive landscape, with companies strategically acquiring smaller players to gain access to niche technologies or expand their geographic reach. The market share distribution indicates a strong presence of key players like Commscope and ARRIS, each holding significant billions in revenue share.
- Key Dynamics:
- Innovation in Optical Nodes for FTTH driving market expansion.
- Regulatory support for Broadband Infrastructure Development.
- Increasing demand for high-speed internet access and lower latency.
- Strategic M&A to enhance competitive positioning and product offerings.
Optical Nodes Industry Insights & Trends
The optical nodes industry is poised for substantial growth, projected to witness a Compound Annual Growth Rate (CAGR) in the billions over the forecast period. This expansion is primarily propelled by the insatiable global demand for faster and more reliable internet connectivity. Technological disruptions, including advancements in optical transceiver technology and the development of more efficient passive optical network (PON) nodes, are reshaping the market. The increasing adoption of cloud-based services, the rise of 5G networks, and the burgeoning IoT ecosystem are all contributing to higher bandwidth requirements, necessitating the widespread deployment of advanced optical infrastructure. Evolving consumer behaviors, marked by an increased reliance on digital platforms for entertainment, work, and education, further solidify the need for robust optical node solutions. The market size is expected to surpass billions by 2033, with significant investments in fiber to the home (FTTH) deployments across developed and emerging economies. The transition from legacy copper networks to advanced fiber optic networks remains a dominant trend, unlocking new revenue streams for market participants.
Key Markets & Segments Leading Optical Nodes
The FTTH (Fiber to the Home) application segment is unequivocally leading the optical nodes market, driven by its ability to deliver symmetrical, high-bandwidth internet speeds directly to residential premises. This dominance is further amplified by government initiatives aimed at bridging the digital divide and promoting widespread broadband access. Economic growth in key regions like North America and Asia-Pacific, coupled with substantial infrastructure investments, provides a fertile ground for FTTH optical node adoption.
- Dominant Application: FTTH
- Drivers:
- Governmental broadband deployment programs exceeding billions in funding.
- Growing consumer demand for high-definition streaming, online gaming, and remote work capabilities.
- Scalability and future-proofing capabilities of fiber optics.
- Decreasing costs of fiber optic cable and associated optical node components.
- Detailed Dominance Analysis: The unparalleled performance of FTTH in terms of speed, latency, and capacity makes it the preferred choice for new network deployments and upgrades. Countries like South Korea, Japan, and the United States have invested billions in expanding their FTTH networks, creating a significant demand for single output nodes and multiple output nodes that can efficiently distribute optical signals. The increasing average revenue per user (ARPU) from high-speed internet services further incentivizes operators to invest heavily in FTTH infrastructure.
- Drivers:
The Single Output Node type segment also holds a significant position, particularly in scenarios requiring dedicated optical distribution to individual buildings or smaller clusters of homes. While Multiple Output Nodes cater to larger subscriber bases and trunk distribution, the targeted deployment of single output nodes remains crucial for granular network architecture.
Optical Nodes Product Developments
Product innovation in the optical nodes market is characterized by a relentless pursuit of higher bandwidth, improved energy efficiency, and enhanced integration capabilities. Manufacturers are actively developing next-generation optical nodes that support advanced modulation schemes and higher data rates, catering to the ever-increasing demand for faster internet speeds. Key advancements include miniaturized node designs, improved optical amplifier technologies, and integrated network management features. These innovations are crucial for enabling seamless FTTH deployments, supporting FTTB (Fiber to the Building) and FTTC (Fiber to the Curb) architectures, and ensuring efficient data delivery in diverse broadband network environments. The market relevance of these developments is directly tied to their ability to reduce operational costs for service providers and enhance the end-user experience through superior connectivity.
Challenges in the Optical Nodes Market
Despite robust growth, the optical nodes market faces several challenges that could impede its trajectory. High initial investment costs for fiber optic infrastructure deployment remain a significant barrier, particularly in rural and underserved areas, requiring billions in capital expenditure. Supply chain disruptions, exacerbated by global events, can lead to increased lead times and component shortages, impacting production schedules. Intense competition among established and emerging players also exerts downward pressure on pricing, potentially affecting profit margins. Regulatory hurdles and complex permitting processes for network construction can also cause delays and increase project costs.
- Key Barriers:
- Substantial upfront capital investment for widespread fiber deployment.
- Global supply chain vulnerabilities impacting component availability and cost.
- Intensifying price competition among vendors.
- Navigating diverse and sometimes restrictive local permitting and right-of-way regulations.
Forces Driving Optical Nodes Growth
The growth of the optical nodes market is propelled by a confluence of powerful forces. The relentless demand for higher bandwidth, driven by data-intensive applications like 8K video streaming, virtual reality (VR), and augmented reality (AR), is a primary catalyst. The ongoing expansion of 5G networks and the burgeoning IoT ecosystem necessitate the high-capacity and low-latency capabilities offered by optical fiber. Government initiatives worldwide focused on promoting digital inclusion and bridging the digital divide, often backed by billions in public funding, are significantly accelerating fiber optic deployments. Furthermore, the decreasing cost of fiber optic components, combined with advancements in installation techniques, is making optical node solutions more economically viable for a wider range of deployments.
Challenges in the Optical Nodes Market
Long-term growth catalysts in the optical nodes market are firmly rooted in continuous technological innovation and strategic market expansion. The development of next-generation optical node technology, including coherent optics and advanced wavelength division multiplexing (WDM) solutions, will unlock unprecedented capacity. Strategic partnerships between network operators and equipment manufacturers will drive the co-creation of tailored solutions for specific deployment scenarios. Expanding into emerging markets with unmet connectivity needs and leveraging the increasing adoption of data centers and enterprise networks will further fuel demand. The evolving landscape of smart cities and connected infrastructure will also create new avenues for advanced optical node deployment.
Emerging Opportunities in Optical Nodes
Emerging opportunities in the optical nodes market are ripe for exploration, offering significant growth potential. The expansion of edge computing infrastructure, requiring low-latency connectivity closer to the end-user, presents a strong demand for specialized optical nodes. The increasing adoption of smart grid technologies and the deployment of sensors for industrial IoT applications will necessitate robust and high-capacity optical backhaul solutions. The development of new fiber optic materials and manufacturing processes could lead to further cost reductions and performance improvements. Furthermore, the growing trend towards network convergence, where voice, data, and video services are delivered over a single fiber infrastructure, creates opportunities for highly integrated and versatile optical node designs.
Leading Players in the Optical Nodes Sector
- Commscope
- TVC Communications (Wesco)
- Teleste
- ARRIS
- PBN
- ACI
- Astro
- Televes Corporation
- ATX Networks
- Antronix
- Triax
- Lindsay
- WISI GROUP
- Comtech
- Hirschmann
- Softel
- Extreme Broadband Engineering
- SAT-TRAKT
- Electroline Equipment Inc.
- MHz (Mega Hertz)
- Kennine
- UNIWAY INFOCOM
- Bestcom
- Guangdong Dongyan
Key Milestones in Optical Nodes Industry
- 2019: Increased investment in DOCSIS 3.1 upgrades, indirectly impacting the demand for optical nodes in hybrid fiber-coaxial (HFC) networks.
- 2020: Global surge in demand for reliable home broadband due to remote work and online education initiatives, accelerating FTTH deployments.
- 2021: Significant advancements in 25G PON and 50G PON technology, promising higher speeds and capacity for future optical networks.
- 2022: Supply chain challenges intensified, leading to increased lead times and price fluctuations for optical node components.
- 2023: Growing focus on energy-efficient optical node designs to reduce operational costs for service providers.
- 2024 (Estimated): Continued strong growth in FTTH deployments across North America and Europe, with increasing adoption in emerging markets.
Strategic Outlook for Optical Nodes Market
The strategic outlook for the optical nodes market is exceptionally positive, driven by sustained demand for high-speed connectivity and ongoing technological advancements. Key growth accelerators include the continued global rollout of FTTH networks, the integration of optical nodes with 5G infrastructure for enhanced mobile broadband, and the expanding adoption of edge computing. Investments in R&D focused on next-generation optical node technology will be crucial for maintaining competitive edges. Furthermore, strategic partnerships and acquisitions will likely continue to shape the market landscape, fostering innovation and consolidating market share. The increasing emphasis on sustainability and energy efficiency in network infrastructure will also present significant opportunities for manufacturers offering eco-friendly optical node solutions. The market is set to witness multi-billion dollar opportunities as global connectivity demands continue to escalate.
Optical Nodes Segmentation
-
1. Application
- 1.1. FTTH
- 1.2. FTTB
- 1.3. FTTC
- 1.4. Other
-
2. Type
- 2.1. Single Output Node
- 2.2. Multiple Output Node
Optical Nodes Segmentation By Geography
-
1. North America
- 1.1. United States
- 1.2. Canada
- 1.3. Mexico
-
2. South America
- 2.1. Brazil
- 2.2. Argentina
- 2.3. Rest of South America
-
3. Europe
- 3.1. United Kingdom
- 3.2. Germany
- 3.3. France
- 3.4. Italy
- 3.5. Spain
- 3.6. Russia
- 3.7. Benelux
- 3.8. Nordics
- 3.9. Rest of Europe
-
4. Middle East & Africa
- 4.1. Turkey
- 4.2. Israel
- 4.3. GCC
- 4.4. North Africa
- 4.5. South Africa
- 4.6. Rest of Middle East & Africa
-
5. Asia Pacific
- 5.1. China
- 5.2. India
- 5.3. Japan
- 5.4. South Korea
- 5.5. ASEAN
- 5.6. Oceania
- 5.7. Rest of Asia Pacific
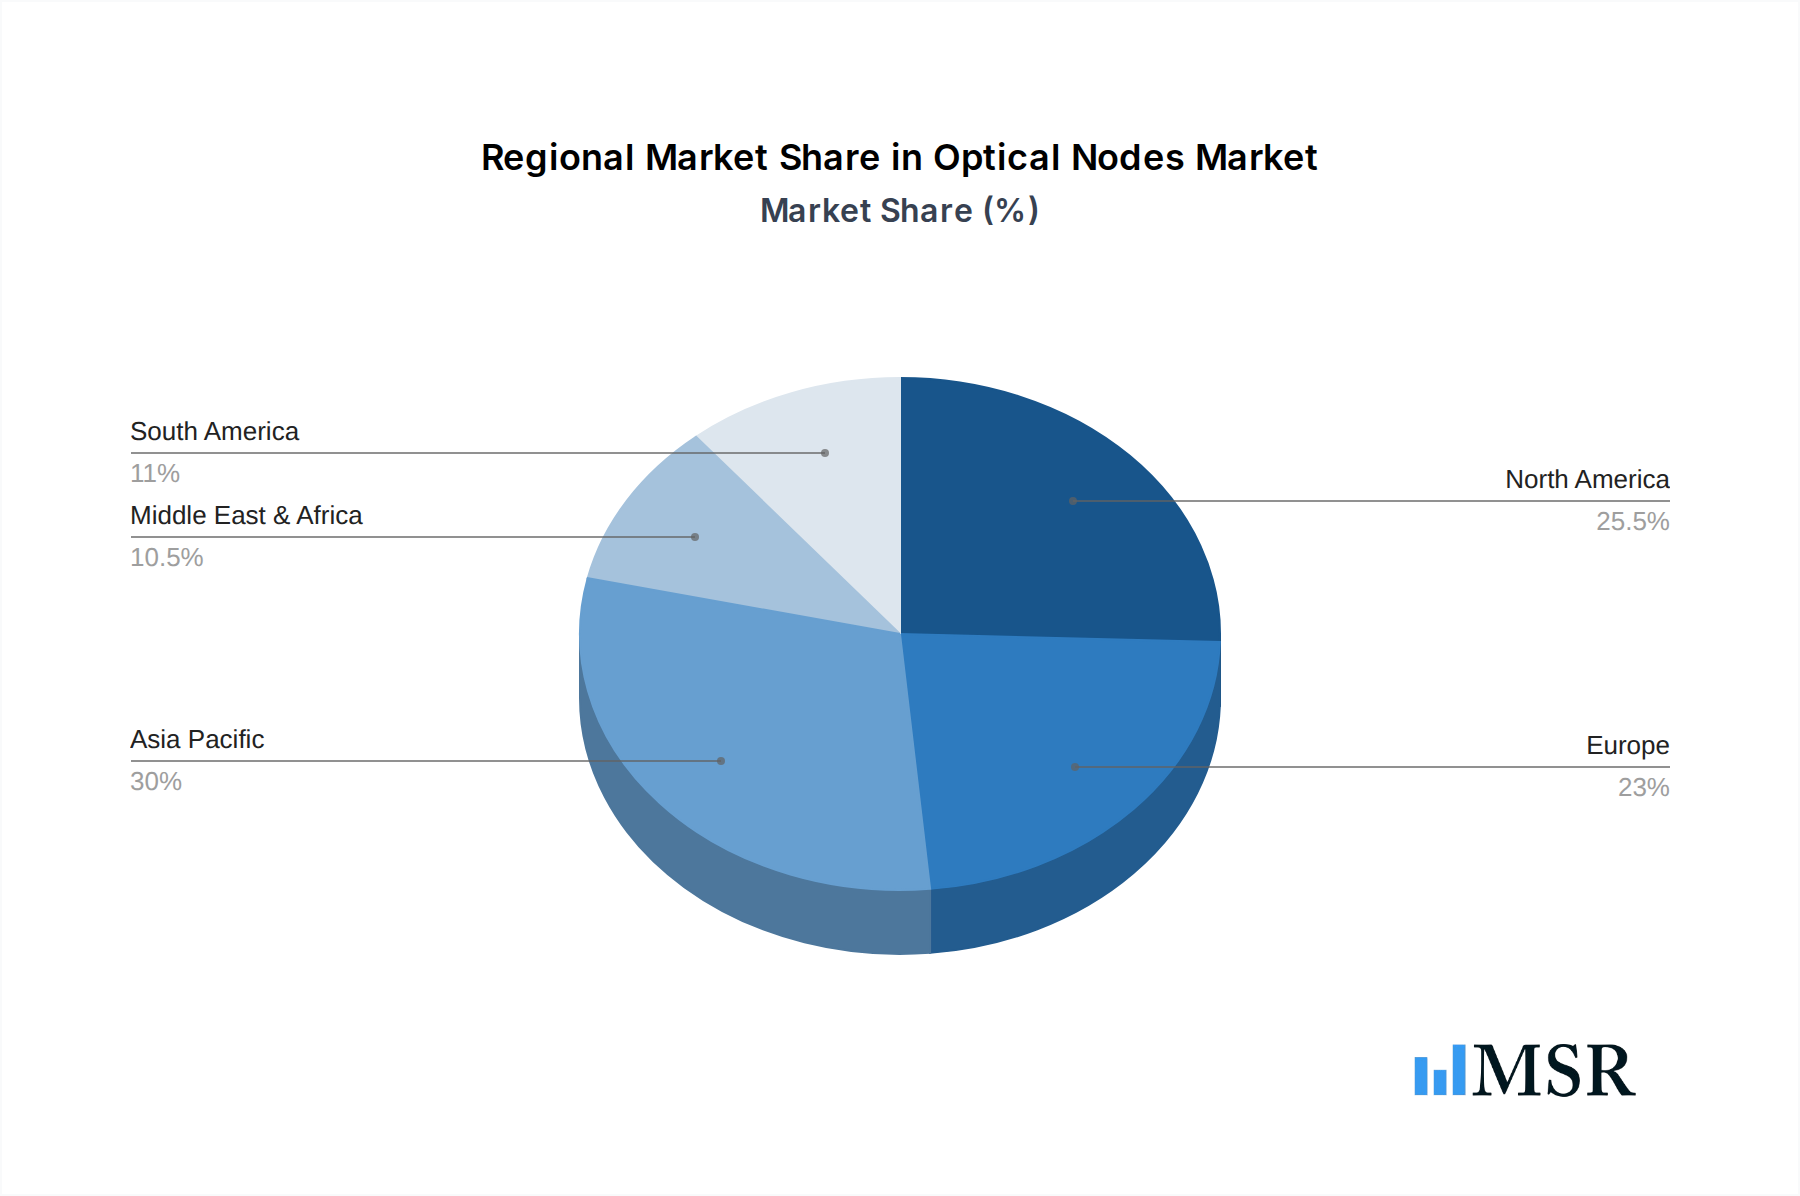
Optical Nodes Regional Market Share
Geographic Coverage of Optical Nodes
Optical Nodes REPORT HIGHLIGHTS
| Aspects | Details |
|---|---|
| Study Period | 2020-2034 |
| Base Year | 2025 |
| Estimated Year | 2026 |
| Forecast Period | 2026-2034 |
| Historical Period | 2020-2025 |
| Growth Rate | CAGR of 9.3% from 2020-2034 |
| Segmentation |
|
Table of Contents
- 1. Introduction
- 1.1. Research Scope
- 1.2. Market Segmentation
- 1.3. Research Methodology
- 1.4. Definitions and Assumptions
- 2. Executive Summary
- 2.1. Introduction
- 3. Market Dynamics
- 3.1. Introduction
- 3.2. Market Drivers
- 3.3. Market Restrains
- 3.4. Market Trends
- 4. Market Factor Analysis
- 4.1. Porters Five Forces
- 4.2. Supply/Value Chain
- 4.3. PESTEL analysis
- 4.4. Market Entropy
- 4.5. Patent/Trademark Analysis
- 5. Global Optical Nodes Analysis, Insights and Forecast, 2020-2032
- 5.1. Market Analysis, Insights and Forecast - by Application
- 5.1.1. FTTH
- 5.1.2. FTTB
- 5.1.3. FTTC
- 5.1.4. Other
- 5.2. Market Analysis, Insights and Forecast - by Type
- 5.2.1. Single Output Node
- 5.2.2. Multiple Output Node
- 5.3. Market Analysis, Insights and Forecast - by Region
- 5.3.1. North America
- 5.3.2. South America
- 5.3.3. Europe
- 5.3.4. Middle East & Africa
- 5.3.5. Asia Pacific
- 5.1. Market Analysis, Insights and Forecast - by Application
- 6. North America Optical Nodes Analysis, Insights and Forecast, 2020-2032
- 6.1. Market Analysis, Insights and Forecast - by Application
- 6.1.1. FTTH
- 6.1.2. FTTB
- 6.1.3. FTTC
- 6.1.4. Other
- 6.2. Market Analysis, Insights and Forecast - by Type
- 6.2.1. Single Output Node
- 6.2.2. Multiple Output Node
- 6.1. Market Analysis, Insights and Forecast - by Application
- 7. South America Optical Nodes Analysis, Insights and Forecast, 2020-2032
- 7.1. Market Analysis, Insights and Forecast - by Application
- 7.1.1. FTTH
- 7.1.2. FTTB
- 7.1.3. FTTC
- 7.1.4. Other
- 7.2. Market Analysis, Insights and Forecast - by Type
- 7.2.1. Single Output Node
- 7.2.2. Multiple Output Node
- 7.1. Market Analysis, Insights and Forecast - by Application
- 8. Europe Optical Nodes Analysis, Insights and Forecast, 2020-2032
- 8.1. Market Analysis, Insights and Forecast - by Application
- 8.1.1. FTTH
- 8.1.2. FTTB
- 8.1.3. FTTC
- 8.1.4. Other
- 8.2. Market Analysis, Insights and Forecast - by Type
- 8.2.1. Single Output Node
- 8.2.2. Multiple Output Node
- 8.1. Market Analysis, Insights and Forecast - by Application
- 9. Middle East & Africa Optical Nodes Analysis, Insights and Forecast, 2020-2032
- 9.1. Market Analysis, Insights and Forecast - by Application
- 9.1.1. FTTH
- 9.1.2. FTTB
- 9.1.3. FTTC
- 9.1.4. Other
- 9.2. Market Analysis, Insights and Forecast - by Type
- 9.2.1. Single Output Node
- 9.2.2. Multiple Output Node
- 9.1. Market Analysis, Insights and Forecast - by Application
- 10. Asia Pacific Optical Nodes Analysis, Insights and Forecast, 2020-2032
- 10.1. Market Analysis, Insights and Forecast - by Application
- 10.1.1. FTTH
- 10.1.2. FTTB
- 10.1.3. FTTC
- 10.1.4. Other
- 10.2. Market Analysis, Insights and Forecast - by Type
- 10.2.1. Single Output Node
- 10.2.2. Multiple Output Node
- 10.1. Market Analysis, Insights and Forecast - by Application
- 11. Competitive Analysis
- 11.1. Global Market Share Analysis 2025
- 11.2. Company Profiles
- 11.2.1 Commscope
- 11.2.1.1. Overview
- 11.2.1.2. Products
- 11.2.1.3. SWOT Analysis
- 11.2.1.4. Recent Developments
- 11.2.1.5. Financials (Based on Availability)
- 11.2.2 TVC Communications (Wesco)
- 11.2.2.1. Overview
- 11.2.2.2. Products
- 11.2.2.3. SWOT Analysis
- 11.2.2.4. Recent Developments
- 11.2.2.5. Financials (Based on Availability)
- 11.2.3 Teleste
- 11.2.3.1. Overview
- 11.2.3.2. Products
- 11.2.3.3. SWOT Analysis
- 11.2.3.4. Recent Developments
- 11.2.3.5. Financials (Based on Availability)
- 11.2.4 ARRIS
- 11.2.4.1. Overview
- 11.2.4.2. Products
- 11.2.4.3. SWOT Analysis
- 11.2.4.4. Recent Developments
- 11.2.4.5. Financials (Based on Availability)
- 11.2.5 PBN
- 11.2.5.1. Overview
- 11.2.5.2. Products
- 11.2.5.3. SWOT Analysis
- 11.2.5.4. Recent Developments
- 11.2.5.5. Financials (Based on Availability)
- 11.2.6 ACI
- 11.2.6.1. Overview
- 11.2.6.2. Products
- 11.2.6.3. SWOT Analysis
- 11.2.6.4. Recent Developments
- 11.2.6.5. Financials (Based on Availability)
- 11.2.7 Astro
- 11.2.7.1. Overview
- 11.2.7.2. Products
- 11.2.7.3. SWOT Analysis
- 11.2.7.4. Recent Developments
- 11.2.7.5. Financials (Based on Availability)
- 11.2.8 Televes Corporation
- 11.2.8.1. Overview
- 11.2.8.2. Products
- 11.2.8.3. SWOT Analysis
- 11.2.8.4. Recent Developments
- 11.2.8.5. Financials (Based on Availability)
- 11.2.9 ATX Networks
- 11.2.9.1. Overview
- 11.2.9.2. Products
- 11.2.9.3. SWOT Analysis
- 11.2.9.4. Recent Developments
- 11.2.9.5. Financials (Based on Availability)
- 11.2.10 Antronix
- 11.2.10.1. Overview
- 11.2.10.2. Products
- 11.2.10.3. SWOT Analysis
- 11.2.10.4. Recent Developments
- 11.2.10.5. Financials (Based on Availability)
- 11.2.11 Triax
- 11.2.11.1. Overview
- 11.2.11.2. Products
- 11.2.11.3. SWOT Analysis
- 11.2.11.4. Recent Developments
- 11.2.11.5. Financials (Based on Availability)
- 11.2.12 Lindsay
- 11.2.12.1. Overview
- 11.2.12.2. Products
- 11.2.12.3. SWOT Analysis
- 11.2.12.4. Recent Developments
- 11.2.12.5. Financials (Based on Availability)
- 11.2.13 WISI GROUP
- 11.2.13.1. Overview
- 11.2.13.2. Products
- 11.2.13.3. SWOT Analysis
- 11.2.13.4. Recent Developments
- 11.2.13.5. Financials (Based on Availability)
- 11.2.14 Comtech
- 11.2.14.1. Overview
- 11.2.14.2. Products
- 11.2.14.3. SWOT Analysis
- 11.2.14.4. Recent Developments
- 11.2.14.5. Financials (Based on Availability)
- 11.2.15 Hirschmann
- 11.2.15.1. Overview
- 11.2.15.2. Products
- 11.2.15.3. SWOT Analysis
- 11.2.15.4. Recent Developments
- 11.2.15.5. Financials (Based on Availability)
- 11.2.16 Softel
- 11.2.16.1. Overview
- 11.2.16.2. Products
- 11.2.16.3. SWOT Analysis
- 11.2.16.4. Recent Developments
- 11.2.16.5. Financials (Based on Availability)
- 11.2.17 Extreme Broadband Engineering
- 11.2.17.1. Overview
- 11.2.17.2. Products
- 11.2.17.3. SWOT Analysis
- 11.2.17.4. Recent Developments
- 11.2.17.5. Financials (Based on Availability)
- 11.2.18 SAT-TRAKT
- 11.2.18.1. Overview
- 11.2.18.2. Products
- 11.2.18.3. SWOT Analysis
- 11.2.18.4. Recent Developments
- 11.2.18.5. Financials (Based on Availability)
- 11.2.19 Electroline Equipment Inc.
- 11.2.19.1. Overview
- 11.2.19.2. Products
- 11.2.19.3. SWOT Analysis
- 11.2.19.4. Recent Developments
- 11.2.19.5. Financials (Based on Availability)
- 11.2.20 MHz (Mega Hertz)
- 11.2.20.1. Overview
- 11.2.20.2. Products
- 11.2.20.3. SWOT Analysis
- 11.2.20.4. Recent Developments
- 11.2.20.5. Financials (Based on Availability)
- 11.2.21 Kennine
- 11.2.21.1. Overview
- 11.2.21.2. Products
- 11.2.21.3. SWOT Analysis
- 11.2.21.4. Recent Developments
- 11.2.21.5. Financials (Based on Availability)
- 11.2.22 UNIWAY INFOCOM
- 11.2.22.1. Overview
- 11.2.22.2. Products
- 11.2.22.3. SWOT Analysis
- 11.2.22.4. Recent Developments
- 11.2.22.5. Financials (Based on Availability)
- 11.2.23 Bestcom
- 11.2.23.1. Overview
- 11.2.23.2. Products
- 11.2.23.3. SWOT Analysis
- 11.2.23.4. Recent Developments
- 11.2.23.5. Financials (Based on Availability)
- 11.2.24 Guangdong Dongyan
- 11.2.24.1. Overview
- 11.2.24.2. Products
- 11.2.24.3. SWOT Analysis
- 11.2.24.4. Recent Developments
- 11.2.24.5. Financials (Based on Availability)
- 11.2.1 Commscope
List of Figures
- Figure 1: Global Optical Nodes Revenue Breakdown (undefined, %) by Region 2025 & 2033
- Figure 2: Global Optical Nodes Volume Breakdown (K, %) by Region 2025 & 2033
- Figure 3: North America Optical Nodes Revenue (undefined), by Application 2025 & 2033
- Figure 4: North America Optical Nodes Volume (K), by Application 2025 & 2033
- Figure 5: North America Optical Nodes Revenue Share (%), by Application 2025 & 2033
- Figure 6: North America Optical Nodes Volume Share (%), by Application 2025 & 2033
- Figure 7: North America Optical Nodes Revenue (undefined), by Type 2025 & 2033
- Figure 8: North America Optical Nodes Volume (K), by Type 2025 & 2033
- Figure 9: North America Optical Nodes Revenue Share (%), by Type 2025 & 2033
- Figure 10: North America Optical Nodes Volume Share (%), by Type 2025 & 2033
- Figure 11: North America Optical Nodes Revenue (undefined), by Country 2025 & 2033
- Figure 12: North America Optical Nodes Volume (K), by Country 2025 & 2033
- Figure 13: North America Optical Nodes Revenue Share (%), by Country 2025 & 2033
- Figure 14: North America Optical Nodes Volume Share (%), by Country 2025 & 2033
- Figure 15: South America Optical Nodes Revenue (undefined), by Application 2025 & 2033
- Figure 16: South America Optical Nodes Volume (K), by Application 2025 & 2033
- Figure 17: South America Optical Nodes Revenue Share (%), by Application 2025 & 2033
- Figure 18: South America Optical Nodes Volume Share (%), by Application 2025 & 2033
- Figure 19: South America Optical Nodes Revenue (undefined), by Type 2025 & 2033
- Figure 20: South America Optical Nodes Volume (K), by Type 2025 & 2033
- Figure 21: South America Optical Nodes Revenue Share (%), by Type 2025 & 2033
- Figure 22: South America Optical Nodes Volume Share (%), by Type 2025 & 2033
- Figure 23: South America Optical Nodes Revenue (undefined), by Country 2025 & 2033
- Figure 24: South America Optical Nodes Volume (K), by Country 2025 & 2033
- Figure 25: South America Optical Nodes Revenue Share (%), by Country 2025 & 2033
- Figure 26: South America Optical Nodes Volume Share (%), by Country 2025 & 2033
- Figure 27: Europe Optical Nodes Revenue (undefined), by Application 2025 & 2033
- Figure 28: Europe Optical Nodes Volume (K), by Application 2025 & 2033
- Figure 29: Europe Optical Nodes Revenue Share (%), by Application 2025 & 2033
- Figure 30: Europe Optical Nodes Volume Share (%), by Application 2025 & 2033
- Figure 31: Europe Optical Nodes Revenue (undefined), by Type 2025 & 2033
- Figure 32: Europe Optical Nodes Volume (K), by Type 2025 & 2033
- Figure 33: Europe Optical Nodes Revenue Share (%), by Type 2025 & 2033
- Figure 34: Europe Optical Nodes Volume Share (%), by Type 2025 & 2033
- Figure 35: Europe Optical Nodes Revenue (undefined), by Country 2025 & 2033
- Figure 36: Europe Optical Nodes Volume (K), by Country 2025 & 2033
- Figure 37: Europe Optical Nodes Revenue Share (%), by Country 2025 & 2033
- Figure 38: Europe Optical Nodes Volume Share (%), by Country 2025 & 2033
- Figure 39: Middle East & Africa Optical Nodes Revenue (undefined), by Application 2025 & 2033
- Figure 40: Middle East & Africa Optical Nodes Volume (K), by Application 2025 & 2033
- Figure 41: Middle East & Africa Optical Nodes Revenue Share (%), by Application 2025 & 2033
- Figure 42: Middle East & Africa Optical Nodes Volume Share (%), by Application 2025 & 2033
- Figure 43: Middle East & Africa Optical Nodes Revenue (undefined), by Type 2025 & 2033
- Figure 44: Middle East & Africa Optical Nodes Volume (K), by Type 2025 & 2033
- Figure 45: Middle East & Africa Optical Nodes Revenue Share (%), by Type 2025 & 2033
- Figure 46: Middle East & Africa Optical Nodes Volume Share (%), by Type 2025 & 2033
- Figure 47: Middle East & Africa Optical Nodes Revenue (undefined), by Country 2025 & 2033
- Figure 48: Middle East & Africa Optical Nodes Volume (K), by Country 2025 & 2033
- Figure 49: Middle East & Africa Optical Nodes Revenue Share (%), by Country 2025 & 2033
- Figure 50: Middle East & Africa Optical Nodes Volume Share (%), by Country 2025 & 2033
- Figure 51: Asia Pacific Optical Nodes Revenue (undefined), by Application 2025 & 2033
- Figure 52: Asia Pacific Optical Nodes Volume (K), by Application 2025 & 2033
- Figure 53: Asia Pacific Optical Nodes Revenue Share (%), by Application 2025 & 2033
- Figure 54: Asia Pacific Optical Nodes Volume Share (%), by Application 2025 & 2033
- Figure 55: Asia Pacific Optical Nodes Revenue (undefined), by Type 2025 & 2033
- Figure 56: Asia Pacific Optical Nodes Volume (K), by Type 2025 & 2033
- Figure 57: Asia Pacific Optical Nodes Revenue Share (%), by Type 2025 & 2033
- Figure 58: Asia Pacific Optical Nodes Volume Share (%), by Type 2025 & 2033
- Figure 59: Asia Pacific Optical Nodes Revenue (undefined), by Country 2025 & 2033
- Figure 60: Asia Pacific Optical Nodes Volume (K), by Country 2025 & 2033
- Figure 61: Asia Pacific Optical Nodes Revenue Share (%), by Country 2025 & 2033
- Figure 62: Asia Pacific Optical Nodes Volume Share (%), by Country 2025 & 2033
List of Tables
- Table 1: Global Optical Nodes Revenue undefined Forecast, by Application 2020 & 2033
- Table 2: Global Optical Nodes Volume K Forecast, by Application 2020 & 2033
- Table 3: Global Optical Nodes Revenue undefined Forecast, by Type 2020 & 2033
- Table 4: Global Optical Nodes Volume K Forecast, by Type 2020 & 2033
- Table 5: Global Optical Nodes Revenue undefined Forecast, by Region 2020 & 2033
- Table 6: Global Optical Nodes Volume K Forecast, by Region 2020 & 2033
- Table 7: Global Optical Nodes Revenue undefined Forecast, by Application 2020 & 2033
- Table 8: Global Optical Nodes Volume K Forecast, by Application 2020 & 2033
- Table 9: Global Optical Nodes Revenue undefined Forecast, by Type 2020 & 2033
- Table 10: Global Optical Nodes Volume K Forecast, by Type 2020 & 2033
- Table 11: Global Optical Nodes Revenue undefined Forecast, by Country 2020 & 2033
- Table 12: Global Optical Nodes Volume K Forecast, by Country 2020 & 2033
- Table 13: United States Optical Nodes Revenue (undefined) Forecast, by Application 2020 & 2033
- Table 14: United States Optical Nodes Volume (K) Forecast, by Application 2020 & 2033
- Table 15: Canada Optical Nodes Revenue (undefined) Forecast, by Application 2020 & 2033
- Table 16: Canada Optical Nodes Volume (K) Forecast, by Application 2020 & 2033
- Table 17: Mexico Optical Nodes Revenue (undefined) Forecast, by Application 2020 & 2033
- Table 18: Mexico Optical Nodes Volume (K) Forecast, by Application 2020 & 2033
- Table 19: Global Optical Nodes Revenue undefined Forecast, by Application 2020 & 2033
- Table 20: Global Optical Nodes Volume K Forecast, by Application 2020 & 2033
- Table 21: Global Optical Nodes Revenue undefined Forecast, by Type 2020 & 2033
- Table 22: Global Optical Nodes Volume K Forecast, by Type 2020 & 2033
- Table 23: Global Optical Nodes Revenue undefined Forecast, by Country 2020 & 2033
- Table 24: Global Optical Nodes Volume K Forecast, by Country 2020 & 2033
- Table 25: Brazil Optical Nodes Revenue (undefined) Forecast, by Application 2020 & 2033
- Table 26: Brazil Optical Nodes Volume (K) Forecast, by Application 2020 & 2033
- Table 27: Argentina Optical Nodes Revenue (undefined) Forecast, by Application 2020 & 2033
- Table 28: Argentina Optical Nodes Volume (K) Forecast, by Application 2020 & 2033
- Table 29: Rest of South America Optical Nodes Revenue (undefined) Forecast, by Application 2020 & 2033
- Table 30: Rest of South America Optical Nodes Volume (K) Forecast, by Application 2020 & 2033
- Table 31: Global Optical Nodes Revenue undefined Forecast, by Application 2020 & 2033
- Table 32: Global Optical Nodes Volume K Forecast, by Application 2020 & 2033
- Table 33: Global Optical Nodes Revenue undefined Forecast, by Type 2020 & 2033
- Table 34: Global Optical Nodes Volume K Forecast, by Type 2020 & 2033
- Table 35: Global Optical Nodes Revenue undefined Forecast, by Country 2020 & 2033
- Table 36: Global Optical Nodes Volume K Forecast, by Country 2020 & 2033
- Table 37: United Kingdom Optical Nodes Revenue (undefined) Forecast, by Application 2020 & 2033
- Table 38: United Kingdom Optical Nodes Volume (K) Forecast, by Application 2020 & 2033
- Table 39: Germany Optical Nodes Revenue (undefined) Forecast, by Application 2020 & 2033
- Table 40: Germany Optical Nodes Volume (K) Forecast, by Application 2020 & 2033
- Table 41: France Optical Nodes Revenue (undefined) Forecast, by Application 2020 & 2033
- Table 42: France Optical Nodes Volume (K) Forecast, by Application 2020 & 2033
- Table 43: Italy Optical Nodes Revenue (undefined) Forecast, by Application 2020 & 2033
- Table 44: Italy Optical Nodes Volume (K) Forecast, by Application 2020 & 2033
- Table 45: Spain Optical Nodes Revenue (undefined) Forecast, by Application 2020 & 2033
- Table 46: Spain Optical Nodes Volume (K) Forecast, by Application 2020 & 2033
- Table 47: Russia Optical Nodes Revenue (undefined) Forecast, by Application 2020 & 2033
- Table 48: Russia Optical Nodes Volume (K) Forecast, by Application 2020 & 2033
- Table 49: Benelux Optical Nodes Revenue (undefined) Forecast, by Application 2020 & 2033
- Table 50: Benelux Optical Nodes Volume (K) Forecast, by Application 2020 & 2033
- Table 51: Nordics Optical Nodes Revenue (undefined) Forecast, by Application 2020 & 2033
- Table 52: Nordics Optical Nodes Volume (K) Forecast, by Application 2020 & 2033
- Table 53: Rest of Europe Optical Nodes Revenue (undefined) Forecast, by Application 2020 & 2033
- Table 54: Rest of Europe Optical Nodes Volume (K) Forecast, by Application 2020 & 2033
- Table 55: Global Optical Nodes Revenue undefined Forecast, by Application 2020 & 2033
- Table 56: Global Optical Nodes Volume K Forecast, by Application 2020 & 2033
- Table 57: Global Optical Nodes Revenue undefined Forecast, by Type 2020 & 2033
- Table 58: Global Optical Nodes Volume K Forecast, by Type 2020 & 2033
- Table 59: Global Optical Nodes Revenue undefined Forecast, by Country 2020 & 2033
- Table 60: Global Optical Nodes Volume K Forecast, by Country 2020 & 2033
- Table 61: Turkey Optical Nodes Revenue (undefined) Forecast, by Application 2020 & 2033
- Table 62: Turkey Optical Nodes Volume (K) Forecast, by Application 2020 & 2033
- Table 63: Israel Optical Nodes Revenue (undefined) Forecast, by Application 2020 & 2033
- Table 64: Israel Optical Nodes Volume (K) Forecast, by Application 2020 & 2033
- Table 65: GCC Optical Nodes Revenue (undefined) Forecast, by Application 2020 & 2033
- Table 66: GCC Optical Nodes Volume (K) Forecast, by Application 2020 & 2033
- Table 67: North Africa Optical Nodes Revenue (undefined) Forecast, by Application 2020 & 2033
- Table 68: North Africa Optical Nodes Volume (K) Forecast, by Application 2020 & 2033
- Table 69: South Africa Optical Nodes Revenue (undefined) Forecast, by Application 2020 & 2033
- Table 70: South Africa Optical Nodes Volume (K) Forecast, by Application 2020 & 2033
- Table 71: Rest of Middle East & Africa Optical Nodes Revenue (undefined) Forecast, by Application 2020 & 2033
- Table 72: Rest of Middle East & Africa Optical Nodes Volume (K) Forecast, by Application 2020 & 2033
- Table 73: Global Optical Nodes Revenue undefined Forecast, by Application 2020 & 2033
- Table 74: Global Optical Nodes Volume K Forecast, by Application 2020 & 2033
- Table 75: Global Optical Nodes Revenue undefined Forecast, by Type 2020 & 2033
- Table 76: Global Optical Nodes Volume K Forecast, by Type 2020 & 2033
- Table 77: Global Optical Nodes Revenue undefined Forecast, by Country 2020 & 2033
- Table 78: Global Optical Nodes Volume K Forecast, by Country 2020 & 2033
- Table 79: China Optical Nodes Revenue (undefined) Forecast, by Application 2020 & 2033
- Table 80: China Optical Nodes Volume (K) Forecast, by Application 2020 & 2033
- Table 81: India Optical Nodes Revenue (undefined) Forecast, by Application 2020 & 2033
- Table 82: India Optical Nodes Volume (K) Forecast, by Application 2020 & 2033
- Table 83: Japan Optical Nodes Revenue (undefined) Forecast, by Application 2020 & 2033
- Table 84: Japan Optical Nodes Volume (K) Forecast, by Application 2020 & 2033
- Table 85: South Korea Optical Nodes Revenue (undefined) Forecast, by Application 2020 & 2033
- Table 86: South Korea Optical Nodes Volume (K) Forecast, by Application 2020 & 2033
- Table 87: ASEAN Optical Nodes Revenue (undefined) Forecast, by Application 2020 & 2033
- Table 88: ASEAN Optical Nodes Volume (K) Forecast, by Application 2020 & 2033
- Table 89: Oceania Optical Nodes Revenue (undefined) Forecast, by Application 2020 & 2033
- Table 90: Oceania Optical Nodes Volume (K) Forecast, by Application 2020 & 2033
- Table 91: Rest of Asia Pacific Optical Nodes Revenue (undefined) Forecast, by Application 2020 & 2033
- Table 92: Rest of Asia Pacific Optical Nodes Volume (K) Forecast, by Application 2020 & 2033
Frequently Asked Questions
1. What is the projected Compound Annual Growth Rate (CAGR) of the Optical Nodes?
The projected CAGR is approximately 9.3%.
2. Which companies are prominent players in the Optical Nodes?
Key companies in the market include Commscope, TVC Communications (Wesco), Teleste, ARRIS, PBN, ACI, Astro, Televes Corporation, ATX Networks, Antronix, Triax, Lindsay, WISI GROUP, Comtech, Hirschmann, Softel, Extreme Broadband Engineering, SAT-TRAKT, Electroline Equipment Inc., MHz (Mega Hertz), Kennine, UNIWAY INFOCOM, Bestcom, Guangdong Dongyan.
3. What are the main segments of the Optical Nodes?
The market segments include Application, Type.
4. Can you provide details about the market size?
The market size is estimated to be USD XXX N/A as of 2022.
5. What are some drivers contributing to market growth?
N/A
6. What are the notable trends driving market growth?
N/A
7. Are there any restraints impacting market growth?
N/A
8. Can you provide examples of recent developments in the market?
N/A
9. What pricing options are available for accessing the report?
Pricing options include single-user, multi-user, and enterprise licenses priced at USD 3950.00, USD 5925.00, and USD 7900.00 respectively.
10. Is the market size provided in terms of value or volume?
The market size is provided in terms of value, measured in N/A and volume, measured in K.
11. Are there any specific market keywords associated with the report?
Yes, the market keyword associated with the report is "Optical Nodes," which aids in identifying and referencing the specific market segment covered.
12. How do I determine which pricing option suits my needs best?
The pricing options vary based on user requirements and access needs. Individual users may opt for single-user licenses, while businesses requiring broader access may choose multi-user or enterprise licenses for cost-effective access to the report.
13. Are there any additional resources or data provided in the Optical Nodes report?
While the report offers comprehensive insights, it's advisable to review the specific contents or supplementary materials provided to ascertain if additional resources or data are available.
14. How can I stay updated on further developments or reports in the Optical Nodes?
To stay informed about further developments, trends, and reports in the Optical Nodes, consider subscribing to industry newsletters, following relevant companies and organizations, or regularly checking reputable industry news sources and publications.
Methodology
Step 1 - Identification of Relevant Samples Size from Population Database


Step 2 - Approaches for Defining Global Market Size (Value, Volume* & Price*)

Note*: In applicable scenarios
Step 3 - Data Sources
Primary Research
- Web Analytics
- Survey Reports
- Research Institute
- Latest Research Reports
- Opinion Leaders
Secondary Research
- Annual Reports
- White Paper
- Latest Press Release
- Industry Association
- Paid Database
- Investor Presentations

Step 4 - Data Triangulation
Involves using different sources of information in order to increase the validity of a study
These sources are likely to be stakeholders in a program - participants, other researchers, program staff, other community members, and so on.
Then we put all data in single framework & apply various statistical tools to find out the dynamic on the market.
During the analysis stage, feedback from the stakeholder groups would be compared to determine areas of agreement as well as areas of divergence