

Key Insights
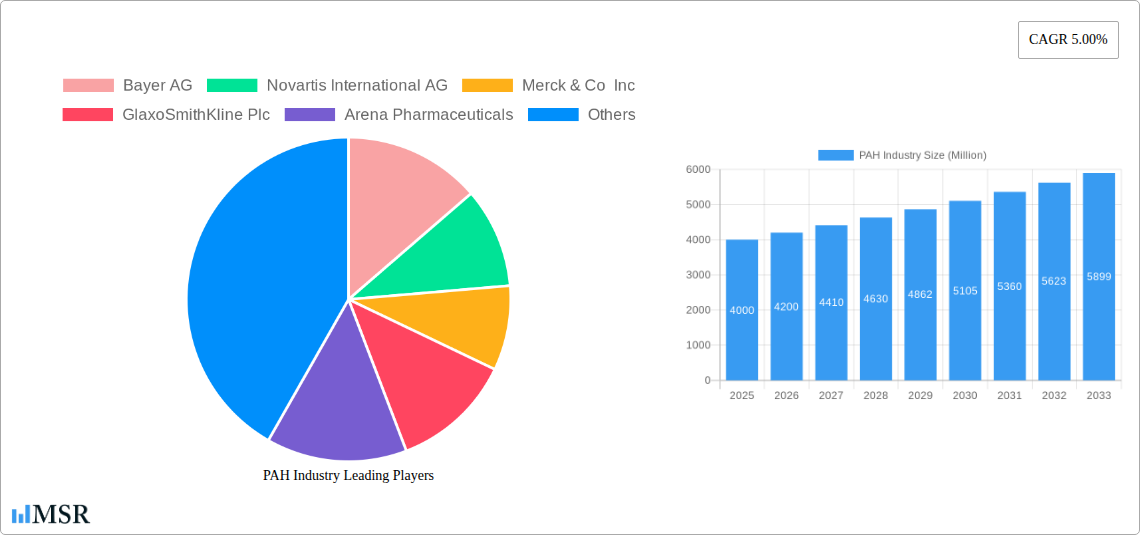
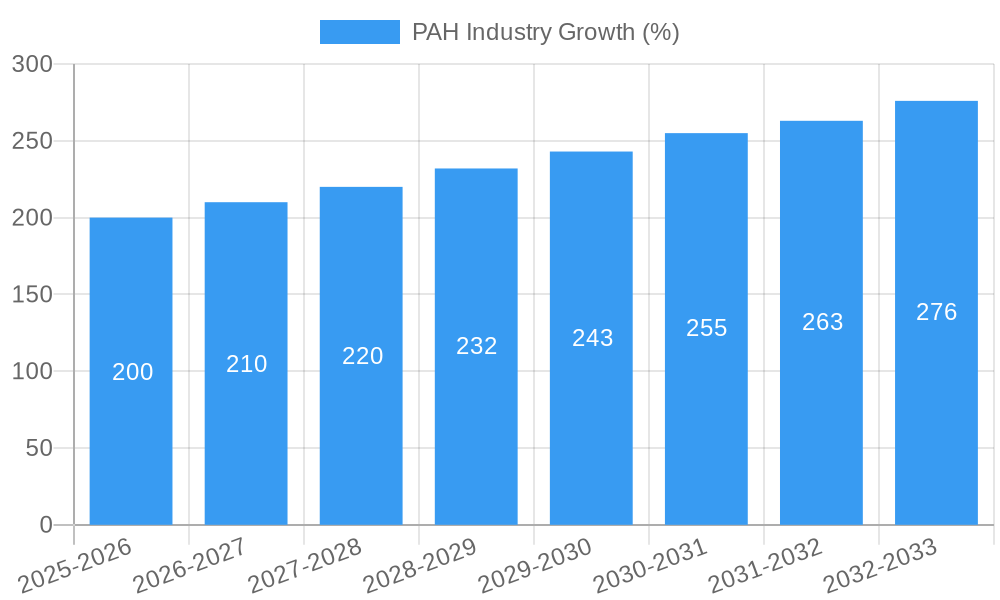
The Pulmonary Arterial Hypertension (PAH) market, valued at approximately $4 billion in 2025, is projected to experience steady growth, driven by increasing prevalence of PAH, advancements in treatment modalities, and rising healthcare expenditure globally. The market's Compound Annual Growth Rate (CAGR) of 5% from 2025 to 2033 indicates a significant expansion over the forecast period. Key drivers include the growing geriatric population (increasing susceptibility to PAH), improved diagnostic capabilities leading to earlier detection and treatment, and the continued development and approval of novel therapies targeting various disease pathways. This growth is further fueled by the increasing awareness among healthcare professionals and patients about PAH management and available treatment options. However, the market faces certain restraints, such as the high cost of medications, limited access to specialized healthcare in certain regions, and the potential for adverse effects associated with some PAH therapies.
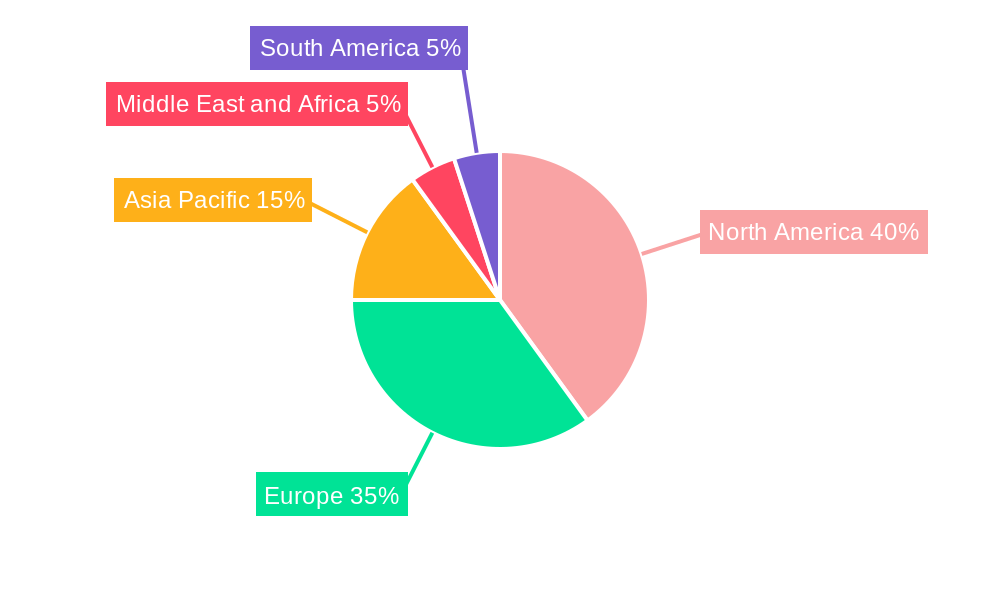
Segment-wise, Prostacyclin and Prostacyclin Analogs currently hold a significant market share due to their established efficacy and widespread use. However, Calcium Channel Blockers, Phosphodiesterase 5 (PDE-5) inhibitors, and Endothelin Receptor Antagonists (ERAs) also contribute significantly, reflecting the diverse treatment approaches employed in PAH management. The "Others" segment, encompassing emerging therapies and combination treatments, is expected to witness substantial growth driven by ongoing research and development efforts. Geographically, North America and Europe currently dominate the market due to higher healthcare spending and advanced healthcare infrastructure. However, the Asia-Pacific region is anticipated to show considerable growth potential driven by increasing healthcare awareness and rising disposable incomes. Companies like Bayer AG, Novartis, Merck, and others are major players actively involved in research and development of innovative PAH therapies, driving the competitive landscape. Strategic partnerships, mergers, and acquisitions are expected to further shape the market dynamics during the forecast period.
Pulmonary Arterial Hypertension (PAH) Industry Report: 2019-2033
This comprehensive report provides an in-depth analysis of the Pulmonary Arterial Hypertension (PAH) industry, covering market dynamics, key players, technological advancements, and future growth prospects. The study period spans from 2019 to 2033, with 2025 serving as both the base and estimated year. The forecast period extends from 2025 to 2033, and the historical period encompasses 2019-2024. The report reveals a market valued at $XX Million in 2025, projected to reach $XX Million by 2033, exhibiting a Compound Annual Growth Rate (CAGR) of XX%.
PAH Industry Market Concentration & Dynamics
The PAH market exhibits a moderately concentrated landscape, with a handful of multinational pharmaceutical giants dominating the market share. Key players such as Bayer AG, Novartis International AG, Merck & Co Inc, GlaxoSmithKline Plc, Arena Pharmaceuticals, Johnson & Johnson (Actelion Pharmaceuticals Ltd), Gilead Sciences Inc, Bristol-Myers Squibb Company, United Therapeutics Corporation, and Pfizer Inc collectively control a significant portion (approximately XX%) of the global market.
- Market Share: Bayer AG holds an estimated XX% market share, followed by Novartis International AG with XX%, and Merck & Co Inc with XX%. The remaining share is distributed among other key players and smaller niche companies.
- Innovation Ecosystems: The industry thrives on robust R&D activities, fostering collaborations and partnerships to expedite drug development. Numerous clinical trials are underway, focusing on novel therapeutic approaches and improved drug delivery systems.
- Regulatory Frameworks: Stringent regulatory approvals and post-market surveillance pose significant challenges, particularly for smaller companies attempting to gain market entry. Varying regulatory landscapes across different regions further complicate the process.
- Substitute Products: Limited substitute products currently exist, enhancing the market’s overall stability and growth potential. However, the ongoing R&D efforts for alternative therapies might impact the market landscape in the future.
- End-User Trends: Increasing awareness of PAH and improved diagnostic capabilities have fueled market demand. Growing healthcare expenditure, particularly in developed economies, further contributes to market expansion.
- M&A Activities: The industry has witnessed a moderate level of M&A activity in recent years, with larger companies acquiring smaller biotech firms to bolster their PAH portfolios and pipeline. The number of M&A deals has averaged approximately XX per year over the past five years.
PAH Industry Industry Insights & Trends
The PAH market is experiencing robust growth, driven by factors such as increasing prevalence of the disease, advancements in diagnostics and treatment options, and expanding awareness among healthcare professionals and patients. The market size was valued at $XX Million in 2025 and is expected to reach $XX Million by 2033, exhibiting a CAGR of XX%. This growth is influenced by several key factors:
- Market Growth Drivers: Rising prevalence of PAH, particularly in aging populations, is a significant driver. Technological advancements leading to the development of novel therapies contribute significantly to market growth. Increased healthcare expenditure and improved reimbursement policies further fuel market expansion.
- Technological Disruptions: The introduction of innovative treatment modalities like targeted therapies and gene therapies is revolutionizing the PAH treatment landscape, creating new opportunities for growth. Advancements in diagnostic tools also contribute to early diagnosis and improved patient outcomes.
- Evolving Consumer Behaviors: Patients are increasingly demanding personalized medicine approaches and improved treatment efficacy, driving the development of customized treatment strategies.
Key Markets & Segments Leading PAH Industry
North America currently dominates the global PAH market, followed by Europe. The high prevalence of PAH, well-established healthcare infrastructure, and increased healthcare spending in these regions contribute to their market leadership. Within the drug classes:
- Prostacyclin and Prostacyclin Analogs: This segment continues to dominate the market, owing to the established efficacy and availability of these drugs. Growth is driven by the continuous development of novel formulations with improved delivery systems and reduced side effects.
- Calcium Channel Blockers: This segment shows steady growth, with ongoing research focused on improving their efficacy and safety profiles.
- Phosphodiesterase 5 (PDE-5) Inhibitors: This segment holds a substantial market share and is expected to exhibit growth due to its established efficacy and increasing patient accessibility.
- Endothelin Receptor Antagonists (ERA): This segment represents a significant portion of the market, with ongoing research exploring combination therapies with other drug classes.
- Others: This segment encompasses emerging therapies like soluble guanylate cyclase stimulators and other novel drug candidates that hold significant growth potential.
Drivers for Market Dominance:
- North America: High prevalence of PAH, robust healthcare infrastructure, high healthcare expenditure, and early adoption of novel therapies.
- Europe: Similar to North America, high prevalence, good healthcare infrastructure, and substantial research and development activities.
PAH Industry Product Developments
Recent years have witnessed significant advancements in PAH therapeutics, with the introduction of novel drug classes and improved formulations. This includes the development of targeted therapies with improved efficacy and safety profiles, along with innovative drug delivery systems aimed at enhancing patient compliance and reducing side effects. These innovations provide competitive advantages by offering better treatment outcomes and increased patient convenience.
Challenges in the PAH Industry Market
The PAH market faces several significant challenges:
- High Drug Costs: The high cost of PAH medications poses a barrier to accessibility, particularly in low- and middle-income countries.
- Limited Treatment Options: Despite advancements, there remains a need for more effective and safe treatment options for PAH patients.
- Regulatory Hurdles: Navigating the complex regulatory approval processes for new PAH drugs can be lengthy and costly, hindering market entry for smaller companies.
- Competitive Pressures: The competitive landscape is intensifying, with major pharmaceutical companies investing heavily in PAH R&D.
Forces Driving PAH Industry Growth
Several factors contribute to the PAH industry's sustained growth:
- Technological Advancements: Continuous innovation in drug discovery and development is driving the emergence of new therapies with improved efficacy and safety.
- Rising Prevalence: The increasing prevalence of PAH globally fuels demand for effective treatments.
- Favorable Regulatory Environment: Regulatory agencies' support for the development and approval of novel PAH therapies accelerates market growth.
Long-Term Growth Catalysts in the PAH Industry
Long-term growth in the PAH market is propelled by continuous innovation in treatment strategies, strategic partnerships and collaborations, and expansion into emerging markets. The development of personalized medicine approaches and the exploration of combination therapies hold significant promise for future market expansion.
Emerging Opportunities in PAH Industry
The PAH market presents exciting opportunities:
- Personalized Medicine: Tailoring treatments to individual patient needs based on genetic and clinical factors is emerging as a key growth area.
- Combination Therapies: Combining existing and new PAH medications could result in synergistic effects and improved treatment outcomes.
- Expansion into Emerging Markets: Growing awareness and healthcare investments in emerging economies present a significant opportunity for market expansion.
Leading Players in the PAH Industry Sector
- Bayer AG
- Novartis International AG
- Merck & Co Inc
- GlaxoSmithKline Plc
- Arena Pharmaceuticals
- Johnson & Johnson (Actelion Pharmaceuticals Ltd)
- Gilead Sciences Inc
- Bristol-Myers Squibb Company
- United Therapeutics Corporation
- Pfizer Inc
Key Milestones in PAH Industry Industry
- July 2022: Cereno Scientific initiated a Phase II clinical trial for its PAH drug candidate, CS1.
- June 2022: Gossamer Bio, Inc. published preclinical data supporting the potential of seralutinib for PAH treatment.
Strategic Outlook for PAH Industry Market
The PAH market is poised for continued growth, driven by technological advancements, rising prevalence, and increased healthcare expenditure. Strategic partnerships and collaborations will play a crucial role in driving innovation and accelerating the development of novel therapies. The focus on personalized medicine and expansion into emerging markets will further shape the industry's future trajectory.
PAH Industry Segmentation
-
1. Drug Class
- 1.1. Prostacyclin and Prostacyclin Analogs
- 1.2. Calcium Channel Blockers
- 1.3. Phosphodiesterase 5 (PDE-5)
- 1.4. Endothelin Receptor Antagonists (ERA)
- 1.5. Others
PAH Industry Segmentation By Geography
-
1. North America
- 1.1. United States
- 1.2. Canada
- 1.3. Mexico
-
2. Europe
- 2.1. Germany
- 2.2. United Kingdom
- 2.3. France
- 2.4. Italy
- 2.5. Spain
- 2.6. Rest of Europe
-
3. Asia Pacific
- 3.1. China
- 3.2. Japan
- 3.3. India
- 3.4. Australia
- 3.5. South Korea
- 3.6. Rest of Asia Pacific
-
4. Middle East and Africa
- 4.1. GCC
- 4.2. South Africa
- 4.3. Rest of Middle East and Africa
-
5. South America
- 5.1. Brazil
- 5.2. Argentina
- 5.3. Rest of South America
PAH Industry REPORT HIGHLIGHTS
| Aspects | Details |
|---|---|
| Study Period | 2019-2033 |
| Base Year | 2024 |
| Estimated Year | 2025 |
| Forecast Period | 2025-2033 |
| Historical Period | 2019-2024 |
| Growth Rate | CAGR of 5.00% from 2019-2033 |
| Segmentation |
|
Table of Contents
- 1. Introduction
- 1.1. Research Scope
- 1.2. Market Segmentation
- 1.3. Research Methodology
- 1.4. Definitions and Assumptions
- 2. Executive Summary
- 2.1. Introduction
- 3. Market Dynamics
- 3.1. Introduction
- 3.2. Market Drivers
- 3.2.1. Growing Burden of Pulmonary Arterial Hypertension; Government and Private Support for the Development of Orphan Drugs
- 3.3. Market Restrains
- 3.3.1. Patent Expiration of Drug Molecule; Side Effects Associated with the Drugs
- 3.4. Market Trends
- 3.4.1. Prostacyclin and Prostacyclin Analogs Segment is Expected to Observe Better Growth Over the Forecast Period
- 4. Market Factor Analysis
- 4.1. Porters Five Forces
- 4.2. Supply/Value Chain
- 4.3. PESTEL analysis
- 4.4. Market Entropy
- 4.5. Patent/Trademark Analysis
- 5. Global PAH Industry Analysis, Insights and Forecast, 2019-2031
- 5.1. Market Analysis, Insights and Forecast - by Drug Class
- 5.1.1. Prostacyclin and Prostacyclin Analogs
- 5.1.2. Calcium Channel Blockers
- 5.1.3. Phosphodiesterase 5 (PDE-5)
- 5.1.4. Endothelin Receptor Antagonists (ERA)
- 5.1.5. Others
- 5.2. Market Analysis, Insights and Forecast - by Region
- 5.2.1. North America
- 5.2.2. Europe
- 5.2.3. Asia Pacific
- 5.2.4. Middle East and Africa
- 5.2.5. South America
- 5.1. Market Analysis, Insights and Forecast - by Drug Class
- 6. North America PAH Industry Analysis, Insights and Forecast, 2019-2031
- 6.1. Market Analysis, Insights and Forecast - by Drug Class
- 6.1.1. Prostacyclin and Prostacyclin Analogs
- 6.1.2. Calcium Channel Blockers
- 6.1.3. Phosphodiesterase 5 (PDE-5)
- 6.1.4. Endothelin Receptor Antagonists (ERA)
- 6.1.5. Others
- 6.1. Market Analysis, Insights and Forecast - by Drug Class
- 7. Europe PAH Industry Analysis, Insights and Forecast, 2019-2031
- 7.1. Market Analysis, Insights and Forecast - by Drug Class
- 7.1.1. Prostacyclin and Prostacyclin Analogs
- 7.1.2. Calcium Channel Blockers
- 7.1.3. Phosphodiesterase 5 (PDE-5)
- 7.1.4. Endothelin Receptor Antagonists (ERA)
- 7.1.5. Others
- 7.1. Market Analysis, Insights and Forecast - by Drug Class
- 8. Asia Pacific PAH Industry Analysis, Insights and Forecast, 2019-2031
- 8.1. Market Analysis, Insights and Forecast - by Drug Class
- 8.1.1. Prostacyclin and Prostacyclin Analogs
- 8.1.2. Calcium Channel Blockers
- 8.1.3. Phosphodiesterase 5 (PDE-5)
- 8.1.4. Endothelin Receptor Antagonists (ERA)
- 8.1.5. Others
- 8.1. Market Analysis, Insights and Forecast - by Drug Class
- 9. Middle East and Africa PAH Industry Analysis, Insights and Forecast, 2019-2031
- 9.1. Market Analysis, Insights and Forecast - by Drug Class
- 9.1.1. Prostacyclin and Prostacyclin Analogs
- 9.1.2. Calcium Channel Blockers
- 9.1.3. Phosphodiesterase 5 (PDE-5)
- 9.1.4. Endothelin Receptor Antagonists (ERA)
- 9.1.5. Others
- 9.1. Market Analysis, Insights and Forecast - by Drug Class
- 10. South America PAH Industry Analysis, Insights and Forecast, 2019-2031
- 10.1. Market Analysis, Insights and Forecast - by Drug Class
- 10.1.1. Prostacyclin and Prostacyclin Analogs
- 10.1.2. Calcium Channel Blockers
- 10.1.3. Phosphodiesterase 5 (PDE-5)
- 10.1.4. Endothelin Receptor Antagonists (ERA)
- 10.1.5. Others
- 10.1. Market Analysis, Insights and Forecast - by Drug Class
- 11. North America PAH Industry Analysis, Insights and Forecast, 2019-2031
- 11.1. Market Analysis, Insights and Forecast - By Country/Sub-region
- 11.1.1. undefined
- 12. Europe PAH Industry Analysis, Insights and Forecast, 2019-2031
- 12.1. Market Analysis, Insights and Forecast - By Country/Sub-region
- 12.1.1. undefined
- 13. Asia Pacific PAH Industry Analysis, Insights and Forecast, 2019-2031
- 13.1. Market Analysis, Insights and Forecast - By Country/Sub-region
- 13.1.1. undefined
- 14. Middle East and Africa PAH Industry Analysis, Insights and Forecast, 2019-2031
- 14.1. Market Analysis, Insights and Forecast - By Country/Sub-region
- 14.1.1. undefined
- 15. South America PAH Industry Analysis, Insights and Forecast, 2019-2031
- 15.1. Market Analysis, Insights and Forecast - By Country/Sub-region
- 15.1.1. undefined
- 16. Competitive Analysis
- 16.1. Global Market Share Analysis 2024
- 16.2. Company Profiles
- 16.2.1 Bayer AG
- 16.2.1.1. Overview
- 16.2.1.2. Products
- 16.2.1.3. SWOT Analysis
- 16.2.1.4. Recent Developments
- 16.2.1.5. Financials (Based on Availability)
- 16.2.2 Novartis International AG
- 16.2.2.1. Overview
- 16.2.2.2. Products
- 16.2.2.3. SWOT Analysis
- 16.2.2.4. Recent Developments
- 16.2.2.5. Financials (Based on Availability)
- 16.2.3 Merck & Co Inc
- 16.2.3.1. Overview
- 16.2.3.2. Products
- 16.2.3.3. SWOT Analysis
- 16.2.3.4. Recent Developments
- 16.2.3.5. Financials (Based on Availability)
- 16.2.4 GlaxoSmithKline Plc
- 16.2.4.1. Overview
- 16.2.4.2. Products
- 16.2.4.3. SWOT Analysis
- 16.2.4.4. Recent Developments
- 16.2.4.5. Financials (Based on Availability)
- 16.2.5 Arena Pharmaceuticals
- 16.2.5.1. Overview
- 16.2.5.2. Products
- 16.2.5.3. SWOT Analysis
- 16.2.5.4. Recent Developments
- 16.2.5.5. Financials (Based on Availability)
- 16.2.6 Johnson & Johnson (Actelion Pharmaceuticals Ltd )
- 16.2.6.1. Overview
- 16.2.6.2. Products
- 16.2.6.3. SWOT Analysis
- 16.2.6.4. Recent Developments
- 16.2.6.5. Financials (Based on Availability)
- 16.2.7 Gilead Sciences Inc
- 16.2.7.1. Overview
- 16.2.7.2. Products
- 16.2.7.3. SWOT Analysis
- 16.2.7.4. Recent Developments
- 16.2.7.5. Financials (Based on Availability)
- 16.2.8 Bristol-Myers Squibb Company
- 16.2.8.1. Overview
- 16.2.8.2. Products
- 16.2.8.3. SWOT Analysis
- 16.2.8.4. Recent Developments
- 16.2.8.5. Financials (Based on Availability)
- 16.2.9 United Therapeutics Corporation
- 16.2.9.1. Overview
- 16.2.9.2. Products
- 16.2.9.3. SWOT Analysis
- 16.2.9.4. Recent Developments
- 16.2.9.5. Financials (Based on Availability)
- 16.2.10 Pfizer Inc
- 16.2.10.1. Overview
- 16.2.10.2. Products
- 16.2.10.3. SWOT Analysis
- 16.2.10.4. Recent Developments
- 16.2.10.5. Financials (Based on Availability)
- 16.2.1 Bayer AG
List of Figures
- Figure 1: Global PAH Industry Revenue Breakdown (Million, %) by Region 2024 & 2032
- Figure 2: Global PAH Industry Volume Breakdown (K Unit, %) by Region 2024 & 2032
- Figure 3: North America PAH Industry Revenue (Million), by Country 2024 & 2032
- Figure 4: North America PAH Industry Volume (K Unit), by Country 2024 & 2032
- Figure 5: North America PAH Industry Revenue Share (%), by Country 2024 & 2032
- Figure 6: North America PAH Industry Volume Share (%), by Country 2024 & 2032
- Figure 7: Europe PAH Industry Revenue (Million), by Country 2024 & 2032
- Figure 8: Europe PAH Industry Volume (K Unit), by Country 2024 & 2032
- Figure 9: Europe PAH Industry Revenue Share (%), by Country 2024 & 2032
- Figure 10: Europe PAH Industry Volume Share (%), by Country 2024 & 2032
- Figure 11: Asia Pacific PAH Industry Revenue (Million), by Country 2024 & 2032
- Figure 12: Asia Pacific PAH Industry Volume (K Unit), by Country 2024 & 2032
- Figure 13: Asia Pacific PAH Industry Revenue Share (%), by Country 2024 & 2032
- Figure 14: Asia Pacific PAH Industry Volume Share (%), by Country 2024 & 2032
- Figure 15: Middle East and Africa PAH Industry Revenue (Million), by Country 2024 & 2032
- Figure 16: Middle East and Africa PAH Industry Volume (K Unit), by Country 2024 & 2032
- Figure 17: Middle East and Africa PAH Industry Revenue Share (%), by Country 2024 & 2032
- Figure 18: Middle East and Africa PAH Industry Volume Share (%), by Country 2024 & 2032
- Figure 19: South America PAH Industry Revenue (Million), by Country 2024 & 2032
- Figure 20: South America PAH Industry Volume (K Unit), by Country 2024 & 2032
- Figure 21: South America PAH Industry Revenue Share (%), by Country 2024 & 2032
- Figure 22: South America PAH Industry Volume Share (%), by Country 2024 & 2032
- Figure 23: North America PAH Industry Revenue (Million), by Drug Class 2024 & 2032
- Figure 24: North America PAH Industry Volume (K Unit), by Drug Class 2024 & 2032
- Figure 25: North America PAH Industry Revenue Share (%), by Drug Class 2024 & 2032
- Figure 26: North America PAH Industry Volume Share (%), by Drug Class 2024 & 2032
- Figure 27: North America PAH Industry Revenue (Million), by Country 2024 & 2032
- Figure 28: North America PAH Industry Volume (K Unit), by Country 2024 & 2032
- Figure 29: North America PAH Industry Revenue Share (%), by Country 2024 & 2032
- Figure 30: North America PAH Industry Volume Share (%), by Country 2024 & 2032
- Figure 31: Europe PAH Industry Revenue (Million), by Drug Class 2024 & 2032
- Figure 32: Europe PAH Industry Volume (K Unit), by Drug Class 2024 & 2032
- Figure 33: Europe PAH Industry Revenue Share (%), by Drug Class 2024 & 2032
- Figure 34: Europe PAH Industry Volume Share (%), by Drug Class 2024 & 2032
- Figure 35: Europe PAH Industry Revenue (Million), by Country 2024 & 2032
- Figure 36: Europe PAH Industry Volume (K Unit), by Country 2024 & 2032
- Figure 37: Europe PAH Industry Revenue Share (%), by Country 2024 & 2032
- Figure 38: Europe PAH Industry Volume Share (%), by Country 2024 & 2032
- Figure 39: Asia Pacific PAH Industry Revenue (Million), by Drug Class 2024 & 2032
- Figure 40: Asia Pacific PAH Industry Volume (K Unit), by Drug Class 2024 & 2032
- Figure 41: Asia Pacific PAH Industry Revenue Share (%), by Drug Class 2024 & 2032
- Figure 42: Asia Pacific PAH Industry Volume Share (%), by Drug Class 2024 & 2032
- Figure 43: Asia Pacific PAH Industry Revenue (Million), by Country 2024 & 2032
- Figure 44: Asia Pacific PAH Industry Volume (K Unit), by Country 2024 & 2032
- Figure 45: Asia Pacific PAH Industry Revenue Share (%), by Country 2024 & 2032
- Figure 46: Asia Pacific PAH Industry Volume Share (%), by Country 2024 & 2032
- Figure 47: Middle East and Africa PAH Industry Revenue (Million), by Drug Class 2024 & 2032
- Figure 48: Middle East and Africa PAH Industry Volume (K Unit), by Drug Class 2024 & 2032
- Figure 49: Middle East and Africa PAH Industry Revenue Share (%), by Drug Class 2024 & 2032
- Figure 50: Middle East and Africa PAH Industry Volume Share (%), by Drug Class 2024 & 2032
- Figure 51: Middle East and Africa PAH Industry Revenue (Million), by Country 2024 & 2032
- Figure 52: Middle East and Africa PAH Industry Volume (K Unit), by Country 2024 & 2032
- Figure 53: Middle East and Africa PAH Industry Revenue Share (%), by Country 2024 & 2032
- Figure 54: Middle East and Africa PAH Industry Volume Share (%), by Country 2024 & 2032
- Figure 55: South America PAH Industry Revenue (Million), by Drug Class 2024 & 2032
- Figure 56: South America PAH Industry Volume (K Unit), by Drug Class 2024 & 2032
- Figure 57: South America PAH Industry Revenue Share (%), by Drug Class 2024 & 2032
- Figure 58: South America PAH Industry Volume Share (%), by Drug Class 2024 & 2032
- Figure 59: South America PAH Industry Revenue (Million), by Country 2024 & 2032
- Figure 60: South America PAH Industry Volume (K Unit), by Country 2024 & 2032
- Figure 61: South America PAH Industry Revenue Share (%), by Country 2024 & 2032
- Figure 62: South America PAH Industry Volume Share (%), by Country 2024 & 2032
List of Tables
- Table 1: Global PAH Industry Revenue Million Forecast, by Region 2019 & 2032
- Table 2: Global PAH Industry Volume K Unit Forecast, by Region 2019 & 2032
- Table 3: Global PAH Industry Revenue Million Forecast, by Drug Class 2019 & 2032
- Table 4: Global PAH Industry Volume K Unit Forecast, by Drug Class 2019 & 2032
- Table 5: Global PAH Industry Revenue Million Forecast, by Region 2019 & 2032
- Table 6: Global PAH Industry Volume K Unit Forecast, by Region 2019 & 2032
- Table 7: Global PAH Industry Revenue Million Forecast, by Country 2019 & 2032
- Table 8: Global PAH Industry Volume K Unit Forecast, by Country 2019 & 2032
- Table 9: Global PAH Industry Revenue Million Forecast, by Country 2019 & 2032
- Table 10: Global PAH Industry Volume K Unit Forecast, by Country 2019 & 2032
- Table 11: Global PAH Industry Revenue Million Forecast, by Country 2019 & 2032
- Table 12: Global PAH Industry Volume K Unit Forecast, by Country 2019 & 2032
- Table 13: Global PAH Industry Revenue Million Forecast, by Country 2019 & 2032
- Table 14: Global PAH Industry Volume K Unit Forecast, by Country 2019 & 2032
- Table 15: Global PAH Industry Revenue Million Forecast, by Country 2019 & 2032
- Table 16: Global PAH Industry Volume K Unit Forecast, by Country 2019 & 2032
- Table 17: Global PAH Industry Revenue Million Forecast, by Drug Class 2019 & 2032
- Table 18: Global PAH Industry Volume K Unit Forecast, by Drug Class 2019 & 2032
- Table 19: Global PAH Industry Revenue Million Forecast, by Country 2019 & 2032
- Table 20: Global PAH Industry Volume K Unit Forecast, by Country 2019 & 2032
- Table 21: United States PAH Industry Revenue (Million) Forecast, by Application 2019 & 2032
- Table 22: United States PAH Industry Volume (K Unit) Forecast, by Application 2019 & 2032
- Table 23: Canada PAH Industry Revenue (Million) Forecast, by Application 2019 & 2032
- Table 24: Canada PAH Industry Volume (K Unit) Forecast, by Application 2019 & 2032
- Table 25: Mexico PAH Industry Revenue (Million) Forecast, by Application 2019 & 2032
- Table 26: Mexico PAH Industry Volume (K Unit) Forecast, by Application 2019 & 2032
- Table 27: Global PAH Industry Revenue Million Forecast, by Drug Class 2019 & 2032
- Table 28: Global PAH Industry Volume K Unit Forecast, by Drug Class 2019 & 2032
- Table 29: Global PAH Industry Revenue Million Forecast, by Country 2019 & 2032
- Table 30: Global PAH Industry Volume K Unit Forecast, by Country 2019 & 2032
- Table 31: Germany PAH Industry Revenue (Million) Forecast, by Application 2019 & 2032
- Table 32: Germany PAH Industry Volume (K Unit) Forecast, by Application 2019 & 2032
- Table 33: United Kingdom PAH Industry Revenue (Million) Forecast, by Application 2019 & 2032
- Table 34: United Kingdom PAH Industry Volume (K Unit) Forecast, by Application 2019 & 2032
- Table 35: France PAH Industry Revenue (Million) Forecast, by Application 2019 & 2032
- Table 36: France PAH Industry Volume (K Unit) Forecast, by Application 2019 & 2032
- Table 37: Italy PAH Industry Revenue (Million) Forecast, by Application 2019 & 2032
- Table 38: Italy PAH Industry Volume (K Unit) Forecast, by Application 2019 & 2032
- Table 39: Spain PAH Industry Revenue (Million) Forecast, by Application 2019 & 2032
- Table 40: Spain PAH Industry Volume (K Unit) Forecast, by Application 2019 & 2032
- Table 41: Rest of Europe PAH Industry Revenue (Million) Forecast, by Application 2019 & 2032
- Table 42: Rest of Europe PAH Industry Volume (K Unit) Forecast, by Application 2019 & 2032
- Table 43: Global PAH Industry Revenue Million Forecast, by Drug Class 2019 & 2032
- Table 44: Global PAH Industry Volume K Unit Forecast, by Drug Class 2019 & 2032
- Table 45: Global PAH Industry Revenue Million Forecast, by Country 2019 & 2032
- Table 46: Global PAH Industry Volume K Unit Forecast, by Country 2019 & 2032
- Table 47: China PAH Industry Revenue (Million) Forecast, by Application 2019 & 2032
- Table 48: China PAH Industry Volume (K Unit) Forecast, by Application 2019 & 2032
- Table 49: Japan PAH Industry Revenue (Million) Forecast, by Application 2019 & 2032
- Table 50: Japan PAH Industry Volume (K Unit) Forecast, by Application 2019 & 2032
- Table 51: India PAH Industry Revenue (Million) Forecast, by Application 2019 & 2032
- Table 52: India PAH Industry Volume (K Unit) Forecast, by Application 2019 & 2032
- Table 53: Australia PAH Industry Revenue (Million) Forecast, by Application 2019 & 2032
- Table 54: Australia PAH Industry Volume (K Unit) Forecast, by Application 2019 & 2032
- Table 55: South Korea PAH Industry Revenue (Million) Forecast, by Application 2019 & 2032
- Table 56: South Korea PAH Industry Volume (K Unit) Forecast, by Application 2019 & 2032
- Table 57: Rest of Asia Pacific PAH Industry Revenue (Million) Forecast, by Application 2019 & 2032
- Table 58: Rest of Asia Pacific PAH Industry Volume (K Unit) Forecast, by Application 2019 & 2032
- Table 59: Global PAH Industry Revenue Million Forecast, by Drug Class 2019 & 2032
- Table 60: Global PAH Industry Volume K Unit Forecast, by Drug Class 2019 & 2032
- Table 61: Global PAH Industry Revenue Million Forecast, by Country 2019 & 2032
- Table 62: Global PAH Industry Volume K Unit Forecast, by Country 2019 & 2032
- Table 63: GCC PAH Industry Revenue (Million) Forecast, by Application 2019 & 2032
- Table 64: GCC PAH Industry Volume (K Unit) Forecast, by Application 2019 & 2032
- Table 65: South Africa PAH Industry Revenue (Million) Forecast, by Application 2019 & 2032
- Table 66: South Africa PAH Industry Volume (K Unit) Forecast, by Application 2019 & 2032
- Table 67: Rest of Middle East and Africa PAH Industry Revenue (Million) Forecast, by Application 2019 & 2032
- Table 68: Rest of Middle East and Africa PAH Industry Volume (K Unit) Forecast, by Application 2019 & 2032
- Table 69: Global PAH Industry Revenue Million Forecast, by Drug Class 2019 & 2032
- Table 70: Global PAH Industry Volume K Unit Forecast, by Drug Class 2019 & 2032
- Table 71: Global PAH Industry Revenue Million Forecast, by Country 2019 & 2032
- Table 72: Global PAH Industry Volume K Unit Forecast, by Country 2019 & 2032
- Table 73: Brazil PAH Industry Revenue (Million) Forecast, by Application 2019 & 2032
- Table 74: Brazil PAH Industry Volume (K Unit) Forecast, by Application 2019 & 2032
- Table 75: Argentina PAH Industry Revenue (Million) Forecast, by Application 2019 & 2032
- Table 76: Argentina PAH Industry Volume (K Unit) Forecast, by Application 2019 & 2032
- Table 77: Rest of South America PAH Industry Revenue (Million) Forecast, by Application 2019 & 2032
- Table 78: Rest of South America PAH Industry Volume (K Unit) Forecast, by Application 2019 & 2032
Frequently Asked Questions
1. What is the projected Compound Annual Growth Rate (CAGR) of the PAH Industry?
The projected CAGR is approximately 5.00%.
2. Which companies are prominent players in the PAH Industry?
Key companies in the market include Bayer AG, Novartis International AG, Merck & Co Inc, GlaxoSmithKline Plc, Arena Pharmaceuticals, Johnson & Johnson (Actelion Pharmaceuticals Ltd ), Gilead Sciences Inc, Bristol-Myers Squibb Company, United Therapeutics Corporation, Pfizer Inc.
3. What are the main segments of the PAH Industry?
The market segments include Drug Class.
4. Can you provide details about the market size?
The market size is estimated to be USD XX Million as of 2022.
5. What are some drivers contributing to market growth?
Growing Burden of Pulmonary Arterial Hypertension; Government and Private Support for the Development of Orphan Drugs.
6. What are the notable trends driving market growth?
Prostacyclin and Prostacyclin Analogs Segment is Expected to Observe Better Growth Over the Forecast Period.
7. Are there any restraints impacting market growth?
Patent Expiration of Drug Molecule; Side Effects Associated with the Drugs.
8. Can you provide examples of recent developments in the market?
In July 2022, Cereno Scientific announced that the first patient had been enrolled in the Phase II study in pulmonary arterial hypertension (PAH) with drug candidate CS1.
9. What pricing options are available for accessing the report?
Pricing options include single-user, multi-user, and enterprise licenses priced at USD 4750, USD 5250, and USD 8750 respectively.
10. Is the market size provided in terms of value or volume?
The market size is provided in terms of value, measured in Million and volume, measured in K Unit.
11. Are there any specific market keywords associated with the report?
Yes, the market keyword associated with the report is "PAH Industry," which aids in identifying and referencing the specific market segment covered.
12. How do I determine which pricing option suits my needs best?
The pricing options vary based on user requirements and access needs. Individual users may opt for single-user licenses, while businesses requiring broader access may choose multi-user or enterprise licenses for cost-effective access to the report.
13. Are there any additional resources or data provided in the PAH Industry report?
While the report offers comprehensive insights, it's advisable to review the specific contents or supplementary materials provided to ascertain if additional resources or data are available.
14. How can I stay updated on further developments or reports in the PAH Industry?
To stay informed about further developments, trends, and reports in the PAH Industry, consider subscribing to industry newsletters, following relevant companies and organizations, or regularly checking reputable industry news sources and publications.
Methodology
Step 1 - Identification of Relevant Samples Size from Population Database


Step 2 - Approaches for Defining Global Market Size (Value, Volume* & Price*)

Note*: In applicable scenarios
Step 3 - Data Sources
Primary Research
- Web Analytics
- Survey Reports
- Research Institute
- Latest Research Reports
- Opinion Leaders
Secondary Research
- Annual Reports
- White Paper
- Latest Press Release
- Industry Association
- Paid Database
- Investor Presentations

Step 4 - Data Triangulation
Involves using different sources of information in order to increase the validity of a study
These sources are likely to be stakeholders in a program - participants, other researchers, program staff, other community members, and so on.
Then we put all data in single framework & apply various statistical tools to find out the dynamic on the market.
During the analysis stage, feedback from the stakeholder groups would be compared to determine areas of agreement as well as areas of divergence
