

Key Insights
The global photoinitiator market is experiencing robust growth, driven by the expanding demand for UV-curable adhesives, inks, and coatings across various industries. The market's Compound Annual Growth Rate (CAGR) exceeding 10% from 2019-2033 signifies significant potential. This growth is fueled by several key factors: the increasing adoption of UV curing technology due to its speed, efficiency, and environmental benefits; the rise of 3D printing and related additive manufacturing processes; and the growing demand for high-performance coatings in diverse sectors like electronics, packaging, and construction. The free radical photoinitiator segment currently dominates the market due to its versatility and cost-effectiveness, although cationic photoinitiators are gaining traction owing to their superior performance in specific applications. Geographically, the Asia-Pacific region, particularly China and India, are major contributors to market growth, propelled by rapid industrialization and expanding manufacturing sectors. However, stringent environmental regulations regarding volatile organic compounds (VOCs) present a challenge, stimulating innovation in the development of more eco-friendly photoinitiator formulations.
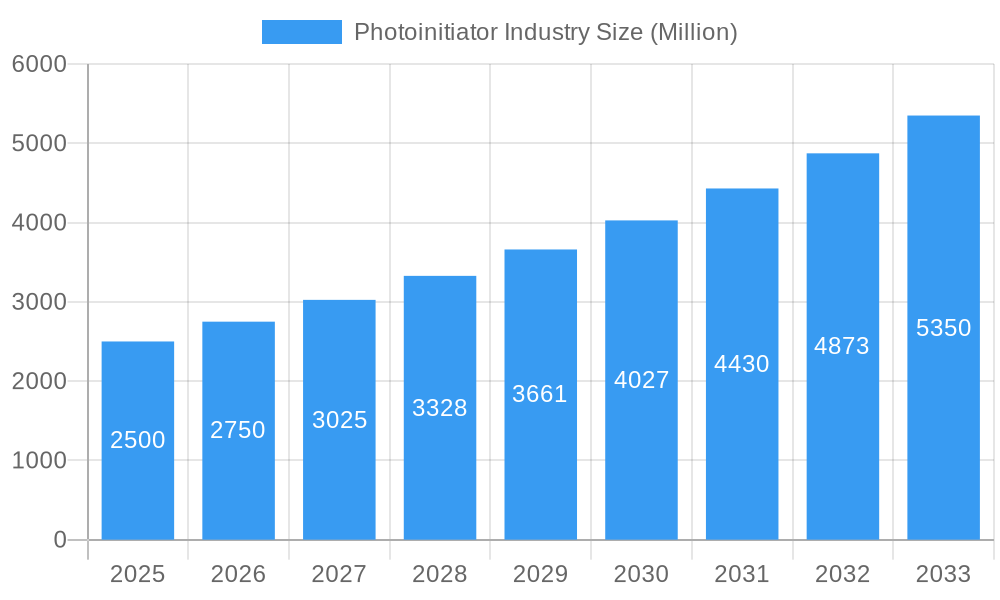
Photoinitiator Industry Market Size (In Billion)
Despite the positive market outlook, certain factors could potentially restrain growth. Fluctuations in raw material prices, particularly for monomers and other chemical precursors, can impact profitability. Furthermore, the competitive landscape is characterized by both established players and emerging companies, leading to intense price competition and requiring continuous innovation to maintain a market edge. Market segmentation by application reveals strong growth in the adhesives segment, followed by inks and coatings. The "other applications" segment encompasses diverse and emerging uses, indicating the potential for future expansion. Looking ahead, the market will likely witness increased mergers and acquisitions, as larger players seek to consolidate their market share and expand their product portfolios. The focus will continue to be on developing sustainable and high-performance photoinitiators to meet the evolving needs of various industries.
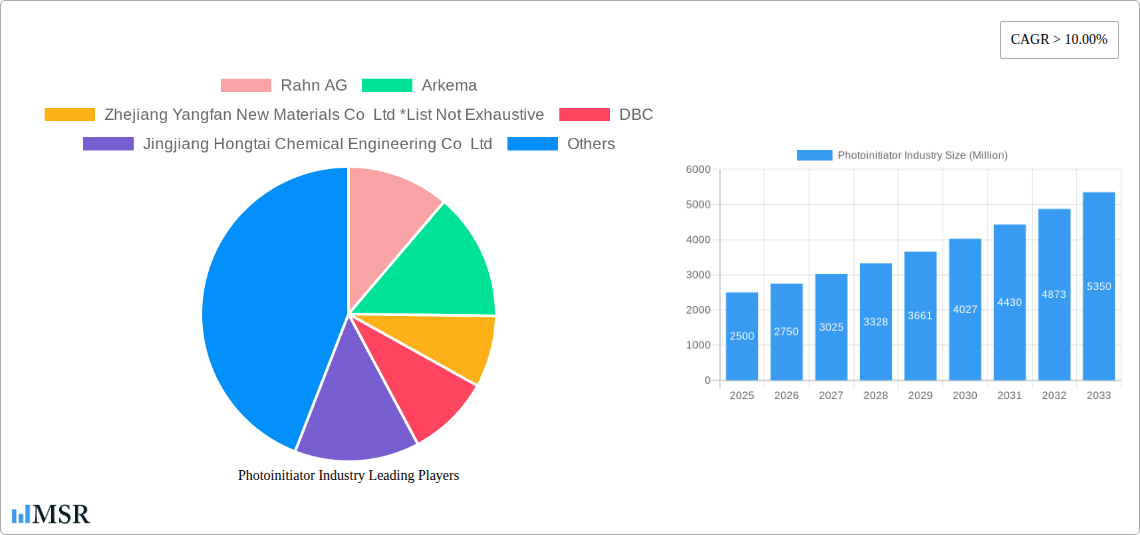
Photoinitiator Industry Company Market Share
Photoinitiator Industry Market Report: 2019-2033
This comprehensive report provides an in-depth analysis of the global photoinitiator industry, offering valuable insights for stakeholders across the value chain. Covering the period from 2019 to 2033, with a focus on 2025, this report projects a market valued at xx Million by the estimated year and forecasts robust growth to xx Million by 2033. The report meticulously examines market dynamics, key segments, leading players, and emerging trends, equipping readers with actionable intelligence to navigate this dynamic sector.
Photoinitiator Industry Market Concentration & Dynamics
The global photoinitiator market exhibits a moderately concentrated landscape, with key players such as Rahn AG, Arkema, and Zhejiang Yangfan New Materials Co Ltd holding significant market share. However, the presence of numerous smaller players, including DBC, Jingjiang Hongtai Chemical Engineering Co Ltd, Eutec, and others, creates a competitive environment.
Market Concentration: The top 5 players account for approximately xx% of the global market share in 2025 (estimated), indicating a moderately consolidated market. Smaller players compete primarily on niche applications and specialized product offerings.
Innovation Ecosystems: Significant R&D investments are driving innovation in photoinitiator chemistry, particularly in areas like sustainability and enhanced performance. This includes the development of novel photoinitiators with improved efficiency, reduced toxicity, and expanded application versatility.
Regulatory Frameworks: Stringent environmental regulations and safety standards governing the use of chemicals are influencing market dynamics. Compliance costs and the adoption of sustainable practices are key considerations for manufacturers.
Substitute Products: While photoinitiators hold a dominant position in their respective applications, some substitutes exist, such as electron beam curing and thermal curing. However, photoinitiators' advantages in terms of precision, speed, and energy efficiency often outweigh these alternatives.
End-User Trends: The growth of various end-use industries, including adhesives, inks, coatings, and 3D printing, fuels demand for photoinitiators. Specific trends in these sectors (e.g., demand for high-performance, environmentally friendly materials) shape photoinitiator market requirements.
M&A Activities: The industry has witnessed a moderate level of M&A activity in recent years. A notable example is IGM Resins' acquisition of Litian in July 2022, which significantly expanded IGM's product portfolio and market reach. The number of M&A deals averaged approximately xx per year during the historical period (2019-2024), with an anticipated increase to xx per year during the forecast period.
Photoinitiator Industry Insights & Trends
The global photoinitiator market is experiencing robust growth, driven by several factors. The market size reached xx Million in 2024 and is projected to grow at a CAGR of xx% from 2025 to 2033, reaching xx Million by 2033. This growth is propelled by increasing demand from various end-use sectors, particularly the coatings and adhesives industries. Technological advancements leading to improved photoinitiator efficiency and versatility are also contributing to market expansion. Consumers increasingly favor sustainable and high-performance materials, further stimulating demand for advanced photoinitiators.
Key Markets & Segments Leading Photoinitiator Industry
Dominant Regions/Segments: The Asia-Pacific region is projected to dominate the photoinitiator market throughout the forecast period, driven by rapid economic growth and industrial expansion in countries like China and India. Within applications, coatings and adhesives account for the largest market share, fueled by the construction, automotive, and packaging industries. Free radical photoinitiators hold a greater market share compared to cationic photoinitiators due to their wider applicability and cost-effectiveness.
Drivers:
- Economic Growth: Rapid economic expansion in developing economies fuels demand for various products that utilize photoinitiators.
- Infrastructure Development: Massive infrastructure projects in numerous regions drive demand for construction materials and coatings.
- Technological Advancements: Continuous advancements in photoinitiator technology lead to improved efficiency and application versatility.
- Growing Automotive Industry: The automotive sector's increasing use of coatings and adhesives is fueling demand.
- Packaging Industry Growth: The packaging industry's growth drives demand for high-performance inks and coatings.
Photoinitiator Industry Product Developments
Recent years have witnessed notable advancements in photoinitiator technology, including the development of more efficient and environmentally friendly formulations. These advancements encompass the introduction of novel chemical structures, improved photochemical properties, and enhanced compatibility with various substrates. Companies are actively developing specialized photoinitiators targeting niche applications, enhancing their competitive edge. The focus on sustainability is driving the creation of bio-based and less toxic photoinitiators.
Challenges in the Photoinitiator Industry Market
The photoinitiator industry faces several challenges, including stringent environmental regulations that necessitate costly compliance measures. Supply chain disruptions and the price volatility of raw materials pose significant hurdles. Furthermore, intense competition from established and emerging players necessitates continuous innovation and cost optimization to maintain market share. These factors can collectively reduce profit margins by an estimated xx% by 2033.
Forces Driving Photoinitiator Industry Growth
The photoinitiator industry's growth is primarily driven by technological advancements leading to more efficient and sustainable products. Economic expansion, particularly in developing countries, fuels demand. Favorable government policies supporting the use of advanced materials in various sectors also play a role. For instance, initiatives promoting sustainable manufacturing practices are boosting the adoption of eco-friendly photoinitiators.
Long-Term Growth Catalysts in the Photoinitiator Industry
Long-term growth in the photoinitiator market will be propelled by continuous innovation, focusing on developing specialized photoinitiators for emerging applications like 3D printing and biomedical devices. Strategic partnerships and collaborations among manufacturers, material suppliers, and end-users will drive the adoption of advanced technologies. Market expansion into new geographic regions, particularly in developing economies, will also contribute to long-term growth.
Emerging Opportunities in Photoinitiator Industry
Significant opportunities exist in developing specialized photoinitiators for high-growth sectors such as 3D printing and bioprinting. The growing demand for sustainable and bio-based materials opens avenues for environmentally friendly photoinitiator formulations. Moreover, exploring new applications in areas like electronics and medical devices offers substantial potential for market expansion.
Leading Players in the Photoinitiator Industry Sector
- Rahn AG
- Arkema
- Zhejiang Yangfan New Materials Co Ltd
- DBC
- Jingjiang Hongtai Chemical Engineering Co Ltd
- Eutec
- Changzhou Tronly New Electronic Materials Co Ltd
- TCI Chemicals
- ADEKA Corporation
- Lambson
- Jiuri Chemical
- Environ Speciality Chemicals Ltd
- New Sun Poly Tec Co Ltd
- Tianjin Jiuri New Materials Co Ltd
- Polynaisse
- IGM Resins
Key Milestones in Photoinitiator Industry Industry
- July 2022: IGM Resins acquired Litian, expanding its product portfolio and market presence.
- May 2022: Arkema showcased its latest advancements in sustainable photoinitiators and energy-cured materials at RadTech UV+EB 2022.
Strategic Outlook for Photoinitiator Industry Market
The photoinitiator market presents considerable growth potential in the coming years, driven by technological advancements, expanding applications, and increasing demand from various end-use industries. Companies focusing on innovation, sustainability, and strategic partnerships will be well-positioned to capitalize on the market's growth trajectory. Investing in R&D to develop specialized and eco-friendly photoinitiators will be crucial for achieving a competitive edge and long-term success.
Photoinitiator Industry Segmentation
-
1. Type
- 1.1. Free Radical
- 1.2. Cationic
-
2. Application
- 2.1. Adhesives
- 2.2. Ink
- 2.3. Coating
- 2.4. Other Applications
Photoinitiator Industry Segmentation By Geography
-
1. Asia Pacific
- 1.1. China
- 1.2. India
- 1.3. Japan
- 1.4. South Korea
- 1.5. Rest of Asia Pacific
-
2. North America
- 2.1. United States
- 2.2. Canada
- 2.3. Mexico
-
3. Europe
- 3.1. Germany
- 3.2. United Kingdom
- 3.3. France
- 3.4. Italy
- 3.5. Spain
- 3.6. Rest of Europe
-
4. South America
- 4.1. Brazil
- 4.2. Argentina
- 4.3. Rest of South America
-
5. Middle East and Africa
- 5.1. South Africa
- 5.2. Saudi Arabia
- 5.3. Rest of Middle East and Africa
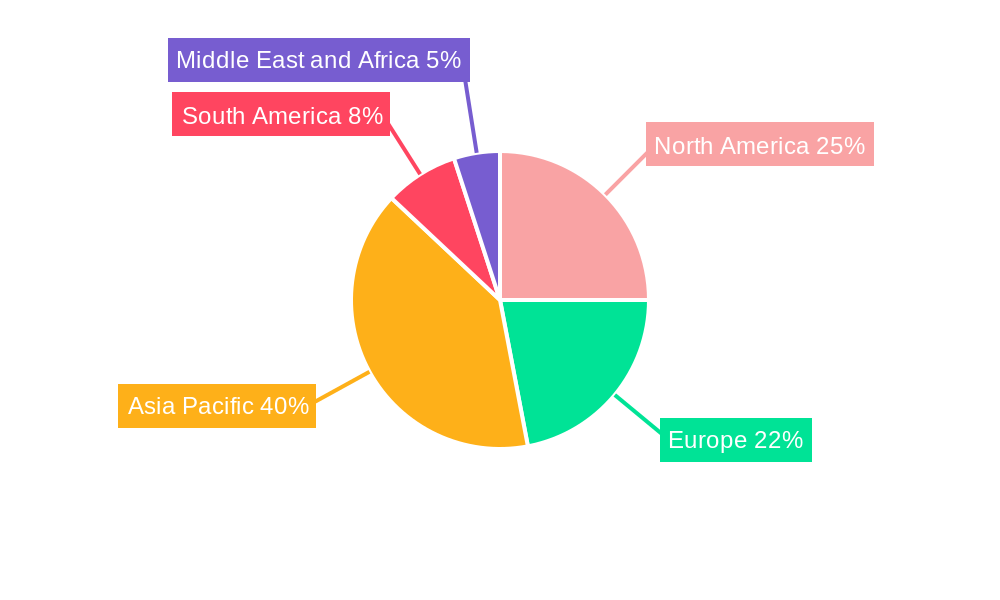
Photoinitiator Industry Regional Market Share
Geographic Coverage of Photoinitiator Industry
Photoinitiator Industry REPORT HIGHLIGHTS
| Aspects | Details |
|---|---|
| Study Period | 2020-2034 |
| Base Year | 2025 |
| Estimated Year | 2026 |
| Forecast Period | 2026-2034 |
| Historical Period | 2020-2025 |
| Growth Rate | CAGR of > 10.00% from 2020-2034 |
| Segmentation |
|
Table of Contents
- 1. Introduction
- 1.1. Research Scope
- 1.2. Market Segmentation
- 1.3. Research Objective
- 1.4. Definitions and Assumptions
- 2. Executive Summary
- 2.1. Market Snapshot
- 3. Market Dynamics
- 3.1. Market Drivers
- 3.2. Market Restrains
- 3.3. Market Trends
- 3.4. Market Opportunities
- 4. Market Factor Analysis
- 4.1. Porters Five Forces
- 4.1.1. Bargaining Power of Suppliers
- 4.1.2. Bargaining Power of Buyers
- 4.1.3. Threat of New Entrants
- 4.1.4. Threat of Substitutes
- 4.1.5. Competitive Rivalry
- 4.2. PESTEL analysis
- 4.3. BCG Analysis
- 4.3.1. Stars (High Growth, High Market Share)
- 4.3.2. Cash Cows (Low Growth, High Market Share)
- 4.3.3. Question Mark (High Growth, Low Market Share)
- 4.3.4. Dogs (Low Growth, Low Market Share)
- 4.4. Ansoff Matrix Analysis
- 4.5. Supply Chain Analysis
- 4.6. Regulatory Landscape
- 4.7. Current Market Potential and Opportunity Assessment (TAM–SAM–SOM Framework)
- 4.8. MSR Analyst Note
- 4.1. Porters Five Forces
- 5. Market Analysis, Insights and Forecast 2021-2033
- 5.1. Market Analysis, Insights and Forecast - by Type
- 5.1.1. Free Radical
- 5.1.2. Cationic
- 5.2. Market Analysis, Insights and Forecast - by Application
- 5.2.1. Adhesives
- 5.2.2. Ink
- 5.2.3. Coating
- 5.2.4. Other Applications
- 5.3. Market Analysis, Insights and Forecast - by Region
- 5.3.1. Asia Pacific
- 5.3.2. North America
- 5.3.3. Europe
- 5.3.4. South America
- 5.3.5. Middle East and Africa
- 5.1. Market Analysis, Insights and Forecast - by Type
- 6. Global Photoinitiator Industry Analysis, Insights and Forecast, 2021-2033
- 6.1. Market Analysis, Insights and Forecast - by Type
- 6.1.1. Free Radical
- 6.1.2. Cationic
- 6.2. Market Analysis, Insights and Forecast - by Application
- 6.2.1. Adhesives
- 6.2.2. Ink
- 6.2.3. Coating
- 6.2.4. Other Applications
- 6.1. Market Analysis, Insights and Forecast - by Type
- 7. Asia Pacific Photoinitiator Industry Analysis, Insights and Forecast, 2020-2032
- 7.1. Market Analysis, Insights and Forecast - by Type
- 7.1.1. Free Radical
- 7.1.2. Cationic
- 7.2. Market Analysis, Insights and Forecast - by Application
- 7.2.1. Adhesives
- 7.2.2. Ink
- 7.2.3. Coating
- 7.2.4. Other Applications
- 7.1. Market Analysis, Insights and Forecast - by Type
- 8. North America Photoinitiator Industry Analysis, Insights and Forecast, 2020-2032
- 8.1. Market Analysis, Insights and Forecast - by Type
- 8.1.1. Free Radical
- 8.1.2. Cationic
- 8.2. Market Analysis, Insights and Forecast - by Application
- 8.2.1. Adhesives
- 8.2.2. Ink
- 8.2.3. Coating
- 8.2.4. Other Applications
- 8.1. Market Analysis, Insights and Forecast - by Type
- 9. Europe Photoinitiator Industry Analysis, Insights and Forecast, 2020-2032
- 9.1. Market Analysis, Insights and Forecast - by Type
- 9.1.1. Free Radical
- 9.1.2. Cationic
- 9.2. Market Analysis, Insights and Forecast - by Application
- 9.2.1. Adhesives
- 9.2.2. Ink
- 9.2.3. Coating
- 9.2.4. Other Applications
- 9.1. Market Analysis, Insights and Forecast - by Type
- 10. South America Photoinitiator Industry Analysis, Insights and Forecast, 2020-2032
- 10.1. Market Analysis, Insights and Forecast - by Type
- 10.1.1. Free Radical
- 10.1.2. Cationic
- 10.2. Market Analysis, Insights and Forecast - by Application
- 10.2.1. Adhesives
- 10.2.2. Ink
- 10.2.3. Coating
- 10.2.4. Other Applications
- 10.1. Market Analysis, Insights and Forecast - by Type
- 11. Middle East and Africa Photoinitiator Industry Analysis, Insights and Forecast, 2020-2032
- 11.1. Market Analysis, Insights and Forecast - by Type
- 11.1.1. Free Radical
- 11.1.2. Cationic
- 11.2. Market Analysis, Insights and Forecast - by Application
- 11.2.1. Adhesives
- 11.2.2. Ink
- 11.2.3. Coating
- 11.2.4. Other Applications
- 11.1. Market Analysis, Insights and Forecast - by Type
- 12. Competitive Analysis
- 12.1. Company Profiles
- 12.1.1 Rahn AG
- 12.1.1.1. Company Overview
- 12.1.1.2. Products
- 12.1.1.3. Company Financials
- 12.1.1.4. SWOT Analysis
- 12.1.2 Arkema
- 12.1.2.1. Company Overview
- 12.1.2.2. Products
- 12.1.2.3. Company Financials
- 12.1.2.4. SWOT Analysis
- 12.1.3 Zhejiang Yangfan New Materials Co Ltd *List Not Exhaustive
- 12.1.3.1. Company Overview
- 12.1.3.2. Products
- 12.1.3.3. Company Financials
- 12.1.3.4. SWOT Analysis
- 12.1.4 DBC
- 12.1.4.1. Company Overview
- 12.1.4.2. Products
- 12.1.4.3. Company Financials
- 12.1.4.4. SWOT Analysis
- 12.1.5 Jingjiang Hongtai Chemical Engineering Co Ltd
- 12.1.5.1. Company Overview
- 12.1.5.2. Products
- 12.1.5.3. Company Financials
- 12.1.5.4. SWOT Analysis
- 12.1.6 Eutec
- 12.1.6.1. Company Overview
- 12.1.6.2. Products
- 12.1.6.3. Company Financials
- 12.1.6.4. SWOT Analysis
- 12.1.7 Changzhou Tronly New Electronic Materials Co Ltd
- 12.1.7.1. Company Overview
- 12.1.7.2. Products
- 12.1.7.3. Company Financials
- 12.1.7.4. SWOT Analysis
- 12.1.8 TCI Chemicals
- 12.1.8.1. Company Overview
- 12.1.8.2. Products
- 12.1.8.3. Company Financials
- 12.1.8.4. SWOT Analysis
- 12.1.9 ADEKA Corporation
- 12.1.9.1. Company Overview
- 12.1.9.2. Products
- 12.1.9.3. Company Financials
- 12.1.9.4. SWOT Analysis
- 12.1.10 Lambson
- 12.1.10.1. Company Overview
- 12.1.10.2. Products
- 12.1.10.3. Company Financials
- 12.1.10.4. SWOT Analysis
- 12.1.11 Jiuri Chemical
- 12.1.11.1. Company Overview
- 12.1.11.2. Products
- 12.1.11.3. Company Financials
- 12.1.11.4. SWOT Analysis
- 12.1.12 Environ Speciality Chemicals Ltd
- 12.1.12.1. Company Overview
- 12.1.12.2. Products
- 12.1.12.3. Company Financials
- 12.1.12.4. SWOT Analysis
- 12.1.13 New Sun Poly Tec Co Ltd
- 12.1.13.1. Company Overview
- 12.1.13.2. Products
- 12.1.13.3. Company Financials
- 12.1.13.4. SWOT Analysis
- 12.1.14 Tianjin Jiuri New Materials Co Ltd
- 12.1.14.1. Company Overview
- 12.1.14.2. Products
- 12.1.14.3. Company Financials
- 12.1.14.4. SWOT Analysis
- 12.1.15 Polynaisse
- 12.1.15.1. Company Overview
- 12.1.15.2. Products
- 12.1.15.3. Company Financials
- 12.1.15.4. SWOT Analysis
- 12.1.16 IGM Resins
- 12.1.16.1. Company Overview
- 12.1.16.2. Products
- 12.1.16.3. Company Financials
- 12.1.16.4. SWOT Analysis
- 12.1.1 Rahn AG
- 12.2. Market Entropy
- 12.2.1 Company's Key Areas Served
- 12.2.2 Recent Developments
- 12.3. Company Market Share Analysis 2025
- 12.3.1 Top 5 Companies Market Share Analysis
- 12.3.2 Top 3 Companies Market Share Analysis
- 12.4. List of Potential Customers
- 13. Research Methodology
List of Figures
- Figure 1: Global Photoinitiator Industry Revenue Breakdown (Million, %) by Region 2025 & 2033
- Figure 2: Asia Pacific Photoinitiator Industry Revenue (Million), by Type 2025 & 2033
- Figure 3: Asia Pacific Photoinitiator Industry Revenue Share (%), by Type 2025 & 2033
- Figure 4: Asia Pacific Photoinitiator Industry Revenue (Million), by Application 2025 & 2033
- Figure 5: Asia Pacific Photoinitiator Industry Revenue Share (%), by Application 2025 & 2033
- Figure 6: Asia Pacific Photoinitiator Industry Revenue (Million), by Country 2025 & 2033
- Figure 7: Asia Pacific Photoinitiator Industry Revenue Share (%), by Country 2025 & 2033
- Figure 8: North America Photoinitiator Industry Revenue (Million), by Type 2025 & 2033
- Figure 9: North America Photoinitiator Industry Revenue Share (%), by Type 2025 & 2033
- Figure 10: North America Photoinitiator Industry Revenue (Million), by Application 2025 & 2033
- Figure 11: North America Photoinitiator Industry Revenue Share (%), by Application 2025 & 2033
- Figure 12: North America Photoinitiator Industry Revenue (Million), by Country 2025 & 2033
- Figure 13: North America Photoinitiator Industry Revenue Share (%), by Country 2025 & 2033
- Figure 14: Europe Photoinitiator Industry Revenue (Million), by Type 2025 & 2033
- Figure 15: Europe Photoinitiator Industry Revenue Share (%), by Type 2025 & 2033
- Figure 16: Europe Photoinitiator Industry Revenue (Million), by Application 2025 & 2033
- Figure 17: Europe Photoinitiator Industry Revenue Share (%), by Application 2025 & 2033
- Figure 18: Europe Photoinitiator Industry Revenue (Million), by Country 2025 & 2033
- Figure 19: Europe Photoinitiator Industry Revenue Share (%), by Country 2025 & 2033
- Figure 20: South America Photoinitiator Industry Revenue (Million), by Type 2025 & 2033
- Figure 21: South America Photoinitiator Industry Revenue Share (%), by Type 2025 & 2033
- Figure 22: South America Photoinitiator Industry Revenue (Million), by Application 2025 & 2033
- Figure 23: South America Photoinitiator Industry Revenue Share (%), by Application 2025 & 2033
- Figure 24: South America Photoinitiator Industry Revenue (Million), by Country 2025 & 2033
- Figure 25: South America Photoinitiator Industry Revenue Share (%), by Country 2025 & 2033
- Figure 26: Middle East and Africa Photoinitiator Industry Revenue (Million), by Type 2025 & 2033
- Figure 27: Middle East and Africa Photoinitiator Industry Revenue Share (%), by Type 2025 & 2033
- Figure 28: Middle East and Africa Photoinitiator Industry Revenue (Million), by Application 2025 & 2033
- Figure 29: Middle East and Africa Photoinitiator Industry Revenue Share (%), by Application 2025 & 2033
- Figure 30: Middle East and Africa Photoinitiator Industry Revenue (Million), by Country 2025 & 2033
- Figure 31: Middle East and Africa Photoinitiator Industry Revenue Share (%), by Country 2025 & 2033
List of Tables
- Table 1: Global Photoinitiator Industry Revenue Million Forecast, by Type 2020 & 2033
- Table 2: Global Photoinitiator Industry Revenue Million Forecast, by Application 2020 & 2033
- Table 3: Global Photoinitiator Industry Revenue Million Forecast, by Region 2020 & 2033
- Table 4: Global Photoinitiator Industry Revenue Million Forecast, by Type 2020 & 2033
- Table 5: Global Photoinitiator Industry Revenue Million Forecast, by Application 2020 & 2033
- Table 6: Global Photoinitiator Industry Revenue Million Forecast, by Country 2020 & 2033
- Table 7: China Photoinitiator Industry Revenue (Million) Forecast, by Application 2020 & 2033
- Table 8: India Photoinitiator Industry Revenue (Million) Forecast, by Application 2020 & 2033
- Table 9: Japan Photoinitiator Industry Revenue (Million) Forecast, by Application 2020 & 2033
- Table 10: South Korea Photoinitiator Industry Revenue (Million) Forecast, by Application 2020 & 2033
- Table 11: Rest of Asia Pacific Photoinitiator Industry Revenue (Million) Forecast, by Application 2020 & 2033
- Table 12: Global Photoinitiator Industry Revenue Million Forecast, by Type 2020 & 2033
- Table 13: Global Photoinitiator Industry Revenue Million Forecast, by Application 2020 & 2033
- Table 14: Global Photoinitiator Industry Revenue Million Forecast, by Country 2020 & 2033
- Table 15: United States Photoinitiator Industry Revenue (Million) Forecast, by Application 2020 & 2033
- Table 16: Canada Photoinitiator Industry Revenue (Million) Forecast, by Application 2020 & 2033
- Table 17: Mexico Photoinitiator Industry Revenue (Million) Forecast, by Application 2020 & 2033
- Table 18: Global Photoinitiator Industry Revenue Million Forecast, by Type 2020 & 2033
- Table 19: Global Photoinitiator Industry Revenue Million Forecast, by Application 2020 & 2033
- Table 20: Global Photoinitiator Industry Revenue Million Forecast, by Country 2020 & 2033
- Table 21: Germany Photoinitiator Industry Revenue (Million) Forecast, by Application 2020 & 2033
- Table 22: United Kingdom Photoinitiator Industry Revenue (Million) Forecast, by Application 2020 & 2033
- Table 23: France Photoinitiator Industry Revenue (Million) Forecast, by Application 2020 & 2033
- Table 24: Italy Photoinitiator Industry Revenue (Million) Forecast, by Application 2020 & 2033
- Table 25: Spain Photoinitiator Industry Revenue (Million) Forecast, by Application 2020 & 2033
- Table 26: Rest of Europe Photoinitiator Industry Revenue (Million) Forecast, by Application 2020 & 2033
- Table 27: Global Photoinitiator Industry Revenue Million Forecast, by Type 2020 & 2033
- Table 28: Global Photoinitiator Industry Revenue Million Forecast, by Application 2020 & 2033
- Table 29: Global Photoinitiator Industry Revenue Million Forecast, by Country 2020 & 2033
- Table 30: Brazil Photoinitiator Industry Revenue (Million) Forecast, by Application 2020 & 2033
- Table 31: Argentina Photoinitiator Industry Revenue (Million) Forecast, by Application 2020 & 2033
- Table 32: Rest of South America Photoinitiator Industry Revenue (Million) Forecast, by Application 2020 & 2033
- Table 33: Global Photoinitiator Industry Revenue Million Forecast, by Type 2020 & 2033
- Table 34: Global Photoinitiator Industry Revenue Million Forecast, by Application 2020 & 2033
- Table 35: Global Photoinitiator Industry Revenue Million Forecast, by Country 2020 & 2033
- Table 36: South Africa Photoinitiator Industry Revenue (Million) Forecast, by Application 2020 & 2033
- Table 37: Saudi Arabia Photoinitiator Industry Revenue (Million) Forecast, by Application 2020 & 2033
- Table 38: Rest of Middle East and Africa Photoinitiator Industry Revenue (Million) Forecast, by Application 2020 & 2033
Frequently Asked Questions
1. What is the projected Compound Annual Growth Rate (CAGR) of the Photoinitiator Industry?
The projected CAGR is approximately > 10.00%.
2. Which companies are prominent players in the Photoinitiator Industry?
Key companies in the market include Rahn AG, Arkema, Zhejiang Yangfan New Materials Co Ltd *List Not Exhaustive, DBC, Jingjiang Hongtai Chemical Engineering Co Ltd, Eutec, Changzhou Tronly New Electronic Materials Co Ltd, TCI Chemicals, ADEKA Corporation, Lambson, Jiuri Chemical, Environ Speciality Chemicals Ltd, New Sun Poly Tec Co Ltd, Tianjin Jiuri New Materials Co Ltd, Polynaisse, IGM Resins.
3. What are the main segments of the Photoinitiator Industry?
The market segments include Type, Application.
4. Can you provide details about the market size?
The market size is estimated to be USD XX Million as of 2022.
5. What are some drivers contributing to market growth?
Promising Growth in End-use Industries such as Adhesive. Coating. Ink. and Paint; Eco-friendly Alternatives for Volatile Organic Compounds (VOCs).
6. What are the notable trends driving market growth?
Coatings Segment to Dominate the Market.
7. Are there any restraints impacting market growth?
Safety Concerns and Highest Costs; Other Restriants.
8. Can you provide examples of recent developments in the market?
July 2022: IGM Resins acquired Litian, a Chinese manufacturer of energy-curing resins. After the acquisition, IGM now includes three distinct product lines, a wide range of photoinitiators, a strong offering of energy-curing resins, and a good selection of additives.
9. What pricing options are available for accessing the report?
Pricing options include single-user, multi-user, and enterprise licenses priced at USD 4750, USD 5250, and USD 8750 respectively.
10. Is the market size provided in terms of value or volume?
The market size is provided in terms of value, measured in Million.
11. Are there any specific market keywords associated with the report?
Yes, the market keyword associated with the report is "Photoinitiator Industry," which aids in identifying and referencing the specific market segment covered.
12. How do I determine which pricing option suits my needs best?
The pricing options vary based on user requirements and access needs. Individual users may opt for single-user licenses, while businesses requiring broader access may choose multi-user or enterprise licenses for cost-effective access to the report.
13. Are there any additional resources or data provided in the Photoinitiator Industry report?
While the report offers comprehensive insights, it's advisable to review the specific contents or supplementary materials provided to ascertain if additional resources or data are available.
14. How can I stay updated on further developments or reports in the Photoinitiator Industry?
To stay informed about further developments, trends, and reports in the Photoinitiator Industry, consider subscribing to industry newsletters, following relevant companies and organizations, or regularly checking reputable industry news sources and publications.
Methodology
Step 1 - Identification of Relevant Samples Size from Population Database


Step 2 - Approaches for Defining Global Market Size (Value, Volume* & Price*)

Note*: In applicable scenarios
Step 3 - Data Sources
Primary Research
- Web Analytics
- Survey Reports
- Research Institute
- Latest Research Reports
- Opinion Leaders
Secondary Research
- Annual Reports
- White Paper
- Latest Press Release
- Industry Association
- Paid Database
- Investor Presentations

Step 4 - Data Triangulation
Involves using different sources of information in order to increase the validity of a study
These sources are likely to be stakeholders in a program - participants, other researchers, program staff, other community members, and so on.
Then we put all data in single framework & apply various statistical tools to find out the dynamic on the market.
During the analysis stage, feedback from the stakeholder groups would be compared to determine areas of agreement as well as areas of divergence