

Key Insights
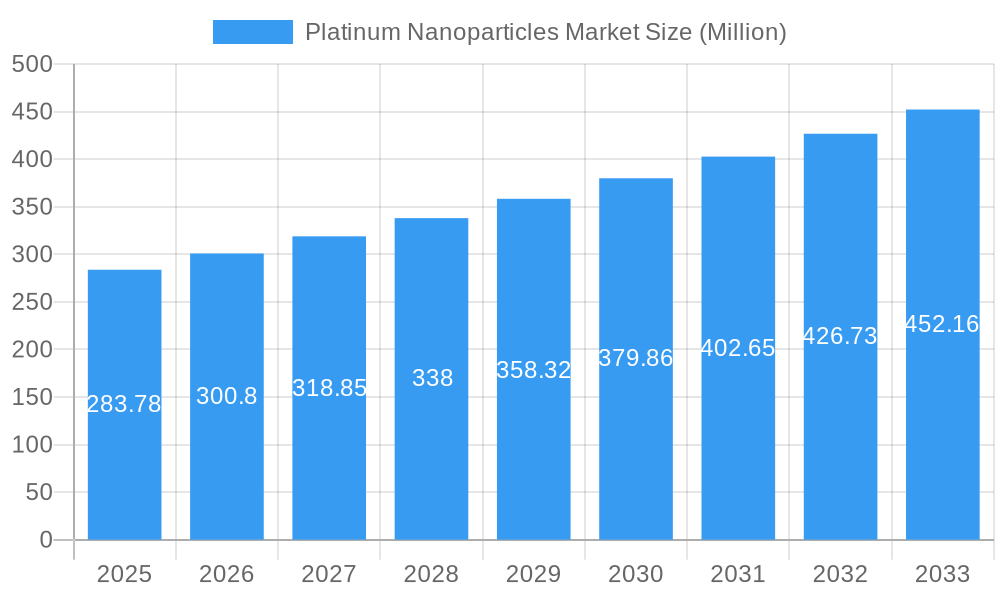
The Platinum Nanoparticles market is experiencing robust growth, projected to reach a market size of $283.78 million in 2025 and exhibiting a Compound Annual Growth Rate (CAGR) of 6% from 2025 to 2033. This expansion is driven by the increasing demand for platinum nanoparticles across diverse sectors, particularly in the automotive and healthcare industries. The automotive industry leverages these nanoparticles in catalytic converters for emission control, benefiting from their high catalytic activity and durability. Simultaneously, the healthcare sector utilizes platinum nanoparticles in drug delivery systems, diagnostics, and cancer therapies, fueled by advancements in nanomedicine and the need for targeted treatments. Further growth drivers include the expanding chemical industry's applications in catalysis and material science. Market segmentation reveals significant contributions from spherical platinum nanoparticles, reflecting their versatility and ease of synthesis. North America and Europe currently dominate the market, reflecting established research infrastructure and regulatory frameworks, while the Asia-Pacific region is poised for significant growth owing to increasing industrialization and investment in nanotechnology. However, challenges remain, including the high cost of platinum and potential toxicity concerns requiring careful handling and disposal protocols. Future market dynamics will depend heavily on technological advancements leading to cost-effective production methods and further exploration of their applications in renewable energy and electronics.
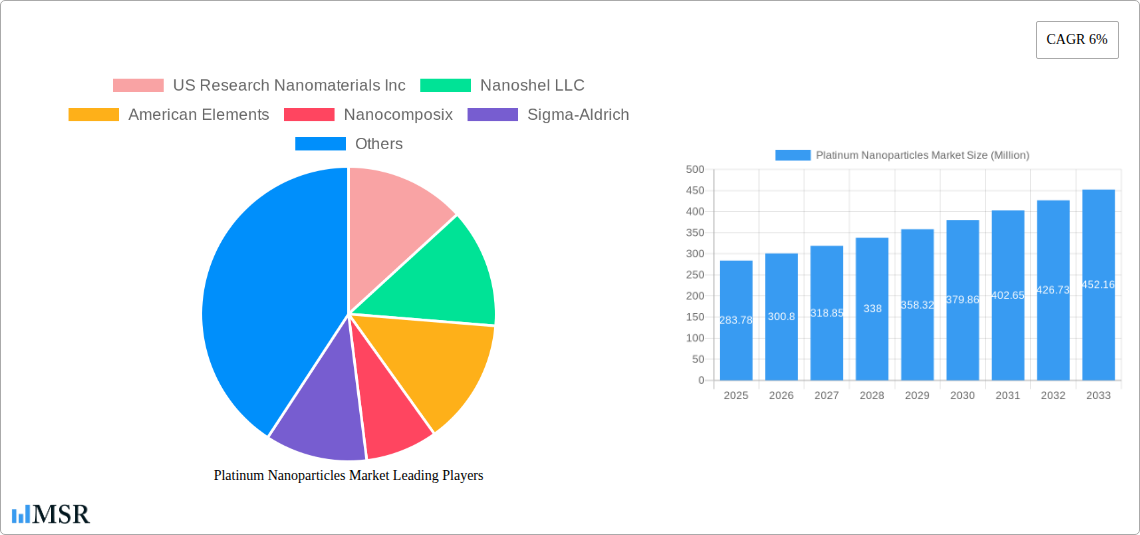
Platinum Nanoparticles Market Market Size (In Million)
The competitive landscape is characterized by a mix of established chemical companies like Sigma-Aldrich and Strem Chemicals, alongside specialized nanomaterials manufacturers such as US Research Nanomaterials Inc. and Nanoshel LLC. Strategic collaborations and mergers & acquisitions are anticipated to shape the market structure as companies seek to expand their product portfolios and geographical reach. The ongoing research and development efforts focused on improving the synthesis, functionalization, and characterization of platinum nanoparticles will further contribute to the market's expansion. A key factor influencing market growth is the increasing regulatory scrutiny and safety standards associated with nanomaterials, which necessitates a concerted focus on responsible manufacturing and usage practices. The long-term outlook for the Platinum Nanoparticles market is positive, with continued growth expected as technological advancements and a wider range of applications drive demand.
Platinum Nanoparticles Market Company Market Share
Platinum Nanoparticles Market: A Comprehensive Analysis (2019-2033)
This comprehensive report provides an in-depth analysis of the global Platinum Nanoparticles Market, offering actionable insights for stakeholders across the value chain. The study covers the period 2019-2033, with a focus on the forecast period 2025-2033 and a base year of 2025. Key market segments, leading players, and emerging trends are meticulously examined, enabling informed decision-making and strategic planning. The market size is projected to reach xx Million by 2033, exhibiting a CAGR of xx% during the forecast period.
Platinum Nanoparticles Market Concentration & Dynamics
The Platinum Nanoparticles market exhibits a moderately concentrated landscape, with several key players holding significant market share. US Research Nanomaterials Inc., Nanoshel LLC, American Elements, and Nanocomposix are among the prominent companies shaping market dynamics. Market share analysis reveals that the top five players collectively account for approximately xx% of the global market in 2025.
The market is driven by continuous innovation in synthesis techniques, leading to the development of highly specialized nanoparticles with improved properties. Regulatory frameworks concerning the use of nanomaterials, particularly in healthcare and environmental applications, play a significant role in shaping market growth. Substitute products, such as other noble metal nanoparticles, pose a degree of competitive pressure. End-user trends, particularly in the automotive and healthcare sectors, are strongly influencing market demand. M&A activities have been relatively moderate in recent years, with approximately xx deals recorded between 2019 and 2024. This suggests a potential for increased consolidation in the coming years.
- Market Concentration: Moderately concentrated, with top 5 players holding xx% market share (2025).
- Innovation: Focus on improved synthesis techniques and specialized nanoparticle properties.
- Regulatory Framework: Growing influence on market growth and application.
- Substitute Products: Limited but present competitive pressure from alternative nanomaterials.
- End-User Trends: Significant influence from automotive and healthcare sectors.
- M&A Activity: Approximately xx deals between 2019 and 2024.
Platinum Nanoparticles Market Industry Insights & Trends
The Platinum Nanoparticles market is experiencing robust growth, driven primarily by increasing demand from the healthcare and automotive industries. The market size was valued at xx Million in 2025 and is projected to reach xx Million by 2033, exhibiting a Compound Annual Growth Rate (CAGR) of xx%. This growth is fueled by technological advancements in the synthesis and characterization of platinum nanoparticles, leading to enhanced functionalities and applications.
Evolving consumer behaviors, particularly a heightened awareness of environmental sustainability and demand for advanced materials, are also contributing to market expansion. The growing adoption of platinum nanoparticles in various applications, such as catalysis, electronics, and medical diagnostics, is further bolstering market growth. Technological disruptions, such as the development of novel synthesis methods and improved characterization techniques, are continuously enhancing the performance and versatility of platinum nanoparticles, thus opening up new avenues for market expansion.
Key Markets & Segments Leading Platinum Nanoparticles Market
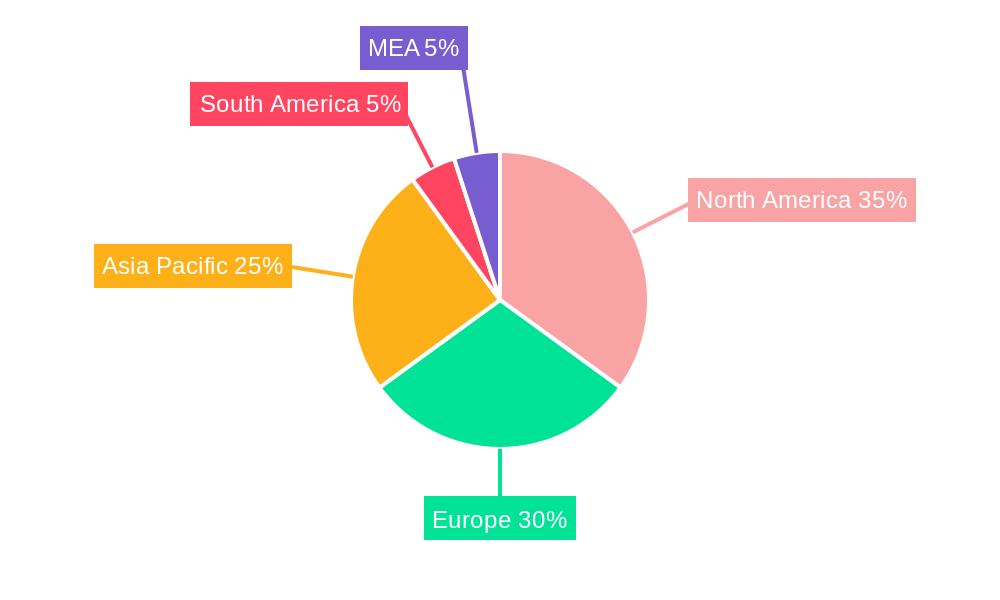
The North American region currently holds a leading position in the Platinum Nanoparticles market, driven by strong demand from the healthcare and chemical sectors. Within product segments, spherical platinum nanoparticles dominate the market due to their versatile applications and ease of synthesis. The automotive sector is a major end-user industry, utilizing platinum nanoparticles in catalytic converters.
Key Drivers:
- North America: Strong demand from healthcare and chemical industries.
- Spherical Nanoparticles: Dominance due to versatility and ease of synthesis.
- Automotive Sector: Major end-user driven by catalytic converter applications.
- Economic Growth: Positive correlation between economic growth and market demand.
- Technological Advancements: Continuous innovations driving market expansion.
Dominance Analysis:
North America's dominance stems from its well-established research infrastructure, significant investments in nanotechnology, and stringent environmental regulations. The high demand for platinum nanoparticles in the region's diverse industries, coupled with a robust regulatory environment, contributes significantly to the regional market's strong performance. The dominance of spherical nanoparticles is attributable to their cost-effectiveness and suitability for a broad range of applications.
Platinum Nanoparticles Market Product Developments
Recent years have witnessed significant advancements in the synthesis and functionalization of platinum nanoparticles. Innovations include the development of novel synthesis methods that result in more uniform and controlled particle size and shape. The enhanced properties of these improved nanoparticles have expanded their applications in catalysis, biosensing, and drug delivery. These advancements give manufacturers a competitive edge by providing superior product performance and expanding market reach.
Challenges in the Platinum Nanoparticles Market Market
The Platinum Nanoparticles market faces several challenges, including stringent regulatory hurdles surrounding the use of nanomaterials, which can increase production costs and limit market access. Supply chain disruptions and price volatility of platinum can negatively impact profitability. Furthermore, intense competition from existing and emerging players puts pressure on profit margins. These factors collectively impose a xx% reduction in projected market growth in 2027, compared to initial projections.
Forces Driving Platinum Nanoparticles Market Growth
Key growth drivers include the rising demand for advanced materials in diverse industries, coupled with continuous technological advancements in nanoparticle synthesis and characterization. Favorable government regulations and incentives promoting nanotechnology research and development further stimulate market growth. The increasing focus on sustainable solutions and the development of environmentally friendly applications for platinum nanoparticles are also contributing factors. For example, the automotive industry's adoption of platinum nanoparticles in catalytic converters, driven by stricter emission regulations, fuels substantial market growth.
Long-Term Growth Catalysts in Platinum Nanoparticles Market
Long-term growth catalysts include the exploration of novel applications in fields like targeted drug delivery and advanced electronics, and strategic partnerships to enhance research and development and accelerate product commercialization. Expanding into new geographical markets with emerging nanotechnology industries offers substantial potential for growth. Furthermore, continuous innovation in synthesis techniques and improved cost-effectiveness will sustain market expansion over the long term.
Emerging Opportunities in Platinum Nanoparticles Market
Emerging opportunities include the development of biocompatible platinum nanoparticles for medical applications, and the expansion into new markets like renewable energy and water purification. Customized nanoparticle synthesis for specific applications offers significant potential. The increasing adoption of platinum nanoparticles in sensors and diagnostic tools presents considerable growth prospects.
Leading Players in the Platinum Nanoparticles Market Sector
- US Research Nanomaterials Inc.
- Nanoshel LLC
- American Elements
- Nanocomposix
- Sigma-Aldrich
- NanoBio Chemicals India Pvt Ltd
- TANAKA HOLDINGS Co Ltd
- Nanostructured & Amorphous Materials Inc.
- Metrohm India Limited
- HiQ-Nano s r l
- Strem Chemicals Inc
- PlasmaChem GmbH
- Meliorum Technologies Inc
- Particular GMBH
- NANOCHEMAZONE
Key Milestones in Platinum Nanoparticles Market Industry
- 2020: Launch of a novel platinum nanoparticle synthesis technique by Nanocomposix, resulting in improved product quality and reduced production costs.
- 2022: Acquisition of a smaller competitor by TANAKA HOLDINGS Co Ltd., strengthening their market position.
- 2023: Approval of a new platinum nanoparticle-based drug delivery system by regulatory authorities, opening new market segments.
- 2024: Introduction of a high-throughput synthesis method by American Elements, significantly increasing production capacity.
Strategic Outlook for Platinum Nanoparticles Market Market
The Platinum Nanoparticles market is poised for sustained growth driven by ongoing technological innovations, increasing demand from various industries, and the exploration of new applications. Strategic partnerships, focusing on R&D and commercialization, will play a pivotal role in shaping the future market landscape. Companies that can adapt quickly to evolving industry trends and effectively navigate regulatory challenges will be best positioned for success in this dynamic market.
Platinum Nanoparticles Market Segmentation
-
1. Product
- 1.1. Spherical
- 1.2. Cube
- 1.3. Square
- 1.4. Others
-
2. End-user Industry
- 2.1. Automotive
- 2.2. Health Care
- 2.3. Chemical
- 2.4. Others
Platinum Nanoparticles Market Segmentation By Geography
-
1. Asia Pacific
- 1.1. China
- 1.2. India
- 1.3. Japan
- 1.4. South Korea
- 1.5. Rest of Asia Pacific
-
2. North America
- 2.1. United States
- 2.2. Canada
- 2.3. Mexico
-
3. Europe
- 3.1. Germany
- 3.2. United Kingdom
- 3.3. France
- 3.4. Italy
- 3.5. Rest of Europe
-
4. South America
- 4.1. Brazil
- 4.2. Argentina
- 4.3. Rest of South America
-
5. Middle East and Africa
- 5.1. Saudi Arabia
- 5.2. South Africa
- 5.3. Rest of Middle East and Africa
Platinum Nanoparticles Market Regional Market Share
Geographic Coverage of Platinum Nanoparticles Market
Platinum Nanoparticles Market REPORT HIGHLIGHTS
| Aspects | Details |
|---|---|
| Study Period | 2020-2034 |
| Base Year | 2025 |
| Estimated Year | 2026 |
| Forecast Period | 2026-2034 |
| Historical Period | 2020-2025 |
| Growth Rate | CAGR of 6% from 2020-2034 |
| Segmentation |
|
Table of Contents
- 1. Introduction
- 1.1. Research Scope
- 1.2. Market Segmentation
- 1.3. Research Objective
- 1.4. Definitions and Assumptions
- 2. Executive Summary
- 2.1. Market Snapshot
- 3. Market Dynamics
- 3.1. Market Drivers
- 3.2. Market Restrains
- 3.3. Market Trends
- 3.4. Market Opportunities
- 4. Market Factor Analysis
- 4.1. Porters Five Forces
- 4.1.1. Bargaining Power of Suppliers
- 4.1.2. Bargaining Power of Buyers
- 4.1.3. Threat of New Entrants
- 4.1.4. Threat of Substitutes
- 4.1.5. Competitive Rivalry
- 4.2. PESTEL analysis
- 4.3. BCG Analysis
- 4.3.1. Stars (High Growth, High Market Share)
- 4.3.2. Cash Cows (Low Growth, High Market Share)
- 4.3.3. Question Mark (High Growth, Low Market Share)
- 4.3.4. Dogs (Low Growth, Low Market Share)
- 4.4. Ansoff Matrix Analysis
- 4.5. Supply Chain Analysis
- 4.6. Regulatory Landscape
- 4.7. Current Market Potential and Opportunity Assessment (TAM–SAM–SOM Framework)
- 4.8. MSR Analyst Note
- 4.1. Porters Five Forces
- 5. Market Analysis, Insights and Forecast 2021-2033
- 5.1. Market Analysis, Insights and Forecast - by Product
- 5.1.1. Spherical
- 5.1.2. Cube
- 5.1.3. Square
- 5.1.4. Others
- 5.2. Market Analysis, Insights and Forecast - by End-user Industry
- 5.2.1. Automotive
- 5.2.2. Health Care
- 5.2.3. Chemical
- 5.2.4. Others
- 5.3. Market Analysis, Insights and Forecast - by Region
- 5.3.1. Asia Pacific
- 5.3.2. North America
- 5.3.3. Europe
- 5.3.4. South America
- 5.3.5. Middle East and Africa
- 5.1. Market Analysis, Insights and Forecast - by Product
- 6. Global Platinum Nanoparticles Market Analysis, Insights and Forecast, 2021-2033
- 6.1. Market Analysis, Insights and Forecast - by Product
- 6.1.1. Spherical
- 6.1.2. Cube
- 6.1.3. Square
- 6.1.4. Others
- 6.2. Market Analysis, Insights and Forecast - by End-user Industry
- 6.2.1. Automotive
- 6.2.2. Health Care
- 6.2.3. Chemical
- 6.2.4. Others
- 6.1. Market Analysis, Insights and Forecast - by Product
- 7. Asia Pacific Platinum Nanoparticles Market Analysis, Insights and Forecast, 2020-2032
- 7.1. Market Analysis, Insights and Forecast - by Product
- 7.1.1. Spherical
- 7.1.2. Cube
- 7.1.3. Square
- 7.1.4. Others
- 7.2. Market Analysis, Insights and Forecast - by End-user Industry
- 7.2.1. Automotive
- 7.2.2. Health Care
- 7.2.3. Chemical
- 7.2.4. Others
- 7.1. Market Analysis, Insights and Forecast - by Product
- 8. North America Platinum Nanoparticles Market Analysis, Insights and Forecast, 2020-2032
- 8.1. Market Analysis, Insights and Forecast - by Product
- 8.1.1. Spherical
- 8.1.2. Cube
- 8.1.3. Square
- 8.1.4. Others
- 8.2. Market Analysis, Insights and Forecast - by End-user Industry
- 8.2.1. Automotive
- 8.2.2. Health Care
- 8.2.3. Chemical
- 8.2.4. Others
- 8.1. Market Analysis, Insights and Forecast - by Product
- 9. Europe Platinum Nanoparticles Market Analysis, Insights and Forecast, 2020-2032
- 9.1. Market Analysis, Insights and Forecast - by Product
- 9.1.1. Spherical
- 9.1.2. Cube
- 9.1.3. Square
- 9.1.4. Others
- 9.2. Market Analysis, Insights and Forecast - by End-user Industry
- 9.2.1. Automotive
- 9.2.2. Health Care
- 9.2.3. Chemical
- 9.2.4. Others
- 9.1. Market Analysis, Insights and Forecast - by Product
- 10. South America Platinum Nanoparticles Market Analysis, Insights and Forecast, 2020-2032
- 10.1. Market Analysis, Insights and Forecast - by Product
- 10.1.1. Spherical
- 10.1.2. Cube
- 10.1.3. Square
- 10.1.4. Others
- 10.2. Market Analysis, Insights and Forecast - by End-user Industry
- 10.2.1. Automotive
- 10.2.2. Health Care
- 10.2.3. Chemical
- 10.2.4. Others
- 10.1. Market Analysis, Insights and Forecast - by Product
- 11. Middle East and Africa Platinum Nanoparticles Market Analysis, Insights and Forecast, 2020-2032
- 11.1. Market Analysis, Insights and Forecast - by Product
- 11.1.1. Spherical
- 11.1.2. Cube
- 11.1.3. Square
- 11.1.4. Others
- 11.2. Market Analysis, Insights and Forecast - by End-user Industry
- 11.2.1. Automotive
- 11.2.2. Health Care
- 11.2.3. Chemical
- 11.2.4. Others
- 11.1. Market Analysis, Insights and Forecast - by Product
- 12. Competitive Analysis
- 12.1. Company Profiles
- 12.1.1 US Research Nanomaterials Inc
- 12.1.1.1. Company Overview
- 12.1.1.2. Products
- 12.1.1.3. Company Financials
- 12.1.1.4. SWOT Analysis
- 12.1.2 Nanoshel LLC
- 12.1.2.1. Company Overview
- 12.1.2.2. Products
- 12.1.2.3. Company Financials
- 12.1.2.4. SWOT Analysis
- 12.1.3 American Elements
- 12.1.3.1. Company Overview
- 12.1.3.2. Products
- 12.1.3.3. Company Financials
- 12.1.3.4. SWOT Analysis
- 12.1.4 Nanocomposix
- 12.1.4.1. Company Overview
- 12.1.4.2. Products
- 12.1.4.3. Company Financials
- 12.1.4.4. SWOT Analysis
- 12.1.5 Sigma-Aldrich
- 12.1.5.1. Company Overview
- 12.1.5.2. Products
- 12.1.5.3. Company Financials
- 12.1.5.4. SWOT Analysis
- 12.1.6 NanoBio Chemicals India Pvt Ltd
- 12.1.6.1. Company Overview
- 12.1.6.2. Products
- 12.1.6.3. Company Financials
- 12.1.6.4. SWOT Analysis
- 12.1.7 TANAKA HOLDINGS Co Ltd
- 12.1.7.1. Company Overview
- 12.1.7.2. Products
- 12.1.7.3. Company Financials
- 12.1.7.4. SWOT Analysis
- 12.1.8 Nanostructured & Amorphous Materials Inc
- 12.1.8.1. Company Overview
- 12.1.8.2. Products
- 12.1.8.3. Company Financials
- 12.1.8.4. SWOT Analysis
- 12.1.9 Metrohm India Limited
- 12.1.9.1. Company Overview
- 12.1.9.2. Products
- 12.1.9.3. Company Financials
- 12.1.9.4. SWOT Analysis
- 12.1.10 HiQ-Nano s r l
- 12.1.10.1. Company Overview
- 12.1.10.2. Products
- 12.1.10.3. Company Financials
- 12.1.10.4. SWOT Analysis
- 12.1.11 Strem Chemicals Inc
- 12.1.11.1. Company Overview
- 12.1.11.2. Products
- 12.1.11.3. Company Financials
- 12.1.11.4. SWOT Analysis
- 12.1.12 PlasmaChem GmbH
- 12.1.12.1. Company Overview
- 12.1.12.2. Products
- 12.1.12.3. Company Financials
- 12.1.12.4. SWOT Analysis
- 12.1.13 Meliorum Technologies Inc
- 12.1.13.1. Company Overview
- 12.1.13.2. Products
- 12.1.13.3. Company Financials
- 12.1.13.4. SWOT Analysis
- 12.1.14 Particular GMBH
- 12.1.14.1. Company Overview
- 12.1.14.2. Products
- 12.1.14.3. Company Financials
- 12.1.14.4. SWOT Analysis
- 12.1.15 NANOCHEMAZONE
- 12.1.15.1. Company Overview
- 12.1.15.2. Products
- 12.1.15.3. Company Financials
- 12.1.15.4. SWOT Analysis
- 12.1.1 US Research Nanomaterials Inc
- 12.2. Market Entropy
- 12.2.1 Company's Key Areas Served
- 12.2.2 Recent Developments
- 12.3. Company Market Share Analysis 2025
- 12.3.1 Top 5 Companies Market Share Analysis
- 12.3.2 Top 3 Companies Market Share Analysis
- 12.4. List of Potential Customers
- 13. Research Methodology
List of Figures
- Figure 1: Global Platinum Nanoparticles Market Revenue Breakdown (Million, %) by Region 2025 & 2033
- Figure 2: Global Platinum Nanoparticles Market Volume Breakdown (K Tons, %) by Region 2025 & 2033
- Figure 3: Asia Pacific Platinum Nanoparticles Market Revenue (Million), by Product 2025 & 2033
- Figure 4: Asia Pacific Platinum Nanoparticles Market Volume (K Tons), by Product 2025 & 2033
- Figure 5: Asia Pacific Platinum Nanoparticles Market Revenue Share (%), by Product 2025 & 2033
- Figure 6: Asia Pacific Platinum Nanoparticles Market Volume Share (%), by Product 2025 & 2033
- Figure 7: Asia Pacific Platinum Nanoparticles Market Revenue (Million), by End-user Industry 2025 & 2033
- Figure 8: Asia Pacific Platinum Nanoparticles Market Volume (K Tons), by End-user Industry 2025 & 2033
- Figure 9: Asia Pacific Platinum Nanoparticles Market Revenue Share (%), by End-user Industry 2025 & 2033
- Figure 10: Asia Pacific Platinum Nanoparticles Market Volume Share (%), by End-user Industry 2025 & 2033
- Figure 11: Asia Pacific Platinum Nanoparticles Market Revenue (Million), by Country 2025 & 2033
- Figure 12: Asia Pacific Platinum Nanoparticles Market Volume (K Tons), by Country 2025 & 2033
- Figure 13: Asia Pacific Platinum Nanoparticles Market Revenue Share (%), by Country 2025 & 2033
- Figure 14: Asia Pacific Platinum Nanoparticles Market Volume Share (%), by Country 2025 & 2033
- Figure 15: North America Platinum Nanoparticles Market Revenue (Million), by Product 2025 & 2033
- Figure 16: North America Platinum Nanoparticles Market Volume (K Tons), by Product 2025 & 2033
- Figure 17: North America Platinum Nanoparticles Market Revenue Share (%), by Product 2025 & 2033
- Figure 18: North America Platinum Nanoparticles Market Volume Share (%), by Product 2025 & 2033
- Figure 19: North America Platinum Nanoparticles Market Revenue (Million), by End-user Industry 2025 & 2033
- Figure 20: North America Platinum Nanoparticles Market Volume (K Tons), by End-user Industry 2025 & 2033
- Figure 21: North America Platinum Nanoparticles Market Revenue Share (%), by End-user Industry 2025 & 2033
- Figure 22: North America Platinum Nanoparticles Market Volume Share (%), by End-user Industry 2025 & 2033
- Figure 23: North America Platinum Nanoparticles Market Revenue (Million), by Country 2025 & 2033
- Figure 24: North America Platinum Nanoparticles Market Volume (K Tons), by Country 2025 & 2033
- Figure 25: North America Platinum Nanoparticles Market Revenue Share (%), by Country 2025 & 2033
- Figure 26: North America Platinum Nanoparticles Market Volume Share (%), by Country 2025 & 2033
- Figure 27: Europe Platinum Nanoparticles Market Revenue (Million), by Product 2025 & 2033
- Figure 28: Europe Platinum Nanoparticles Market Volume (K Tons), by Product 2025 & 2033
- Figure 29: Europe Platinum Nanoparticles Market Revenue Share (%), by Product 2025 & 2033
- Figure 30: Europe Platinum Nanoparticles Market Volume Share (%), by Product 2025 & 2033
- Figure 31: Europe Platinum Nanoparticles Market Revenue (Million), by End-user Industry 2025 & 2033
- Figure 32: Europe Platinum Nanoparticles Market Volume (K Tons), by End-user Industry 2025 & 2033
- Figure 33: Europe Platinum Nanoparticles Market Revenue Share (%), by End-user Industry 2025 & 2033
- Figure 34: Europe Platinum Nanoparticles Market Volume Share (%), by End-user Industry 2025 & 2033
- Figure 35: Europe Platinum Nanoparticles Market Revenue (Million), by Country 2025 & 2033
- Figure 36: Europe Platinum Nanoparticles Market Volume (K Tons), by Country 2025 & 2033
- Figure 37: Europe Platinum Nanoparticles Market Revenue Share (%), by Country 2025 & 2033
- Figure 38: Europe Platinum Nanoparticles Market Volume Share (%), by Country 2025 & 2033
- Figure 39: South America Platinum Nanoparticles Market Revenue (Million), by Product 2025 & 2033
- Figure 40: South America Platinum Nanoparticles Market Volume (K Tons), by Product 2025 & 2033
- Figure 41: South America Platinum Nanoparticles Market Revenue Share (%), by Product 2025 & 2033
- Figure 42: South America Platinum Nanoparticles Market Volume Share (%), by Product 2025 & 2033
- Figure 43: South America Platinum Nanoparticles Market Revenue (Million), by End-user Industry 2025 & 2033
- Figure 44: South America Platinum Nanoparticles Market Volume (K Tons), by End-user Industry 2025 & 2033
- Figure 45: South America Platinum Nanoparticles Market Revenue Share (%), by End-user Industry 2025 & 2033
- Figure 46: South America Platinum Nanoparticles Market Volume Share (%), by End-user Industry 2025 & 2033
- Figure 47: South America Platinum Nanoparticles Market Revenue (Million), by Country 2025 & 2033
- Figure 48: South America Platinum Nanoparticles Market Volume (K Tons), by Country 2025 & 2033
- Figure 49: South America Platinum Nanoparticles Market Revenue Share (%), by Country 2025 & 2033
- Figure 50: South America Platinum Nanoparticles Market Volume Share (%), by Country 2025 & 2033
- Figure 51: Middle East and Africa Platinum Nanoparticles Market Revenue (Million), by Product 2025 & 2033
- Figure 52: Middle East and Africa Platinum Nanoparticles Market Volume (K Tons), by Product 2025 & 2033
- Figure 53: Middle East and Africa Platinum Nanoparticles Market Revenue Share (%), by Product 2025 & 2033
- Figure 54: Middle East and Africa Platinum Nanoparticles Market Volume Share (%), by Product 2025 & 2033
- Figure 55: Middle East and Africa Platinum Nanoparticles Market Revenue (Million), by End-user Industry 2025 & 2033
- Figure 56: Middle East and Africa Platinum Nanoparticles Market Volume (K Tons), by End-user Industry 2025 & 2033
- Figure 57: Middle East and Africa Platinum Nanoparticles Market Revenue Share (%), by End-user Industry 2025 & 2033
- Figure 58: Middle East and Africa Platinum Nanoparticles Market Volume Share (%), by End-user Industry 2025 & 2033
- Figure 59: Middle East and Africa Platinum Nanoparticles Market Revenue (Million), by Country 2025 & 2033
- Figure 60: Middle East and Africa Platinum Nanoparticles Market Volume (K Tons), by Country 2025 & 2033
- Figure 61: Middle East and Africa Platinum Nanoparticles Market Revenue Share (%), by Country 2025 & 2033
- Figure 62: Middle East and Africa Platinum Nanoparticles Market Volume Share (%), by Country 2025 & 2033
List of Tables
- Table 1: Global Platinum Nanoparticles Market Revenue Million Forecast, by Product 2020 & 2033
- Table 2: Global Platinum Nanoparticles Market Volume K Tons Forecast, by Product 2020 & 2033
- Table 3: Global Platinum Nanoparticles Market Revenue Million Forecast, by End-user Industry 2020 & 2033
- Table 4: Global Platinum Nanoparticles Market Volume K Tons Forecast, by End-user Industry 2020 & 2033
- Table 5: Global Platinum Nanoparticles Market Revenue Million Forecast, by Region 2020 & 2033
- Table 6: Global Platinum Nanoparticles Market Volume K Tons Forecast, by Region 2020 & 2033
- Table 7: Global Platinum Nanoparticles Market Revenue Million Forecast, by Product 2020 & 2033
- Table 8: Global Platinum Nanoparticles Market Volume K Tons Forecast, by Product 2020 & 2033
- Table 9: Global Platinum Nanoparticles Market Revenue Million Forecast, by End-user Industry 2020 & 2033
- Table 10: Global Platinum Nanoparticles Market Volume K Tons Forecast, by End-user Industry 2020 & 2033
- Table 11: Global Platinum Nanoparticles Market Revenue Million Forecast, by Country 2020 & 2033
- Table 12: Global Platinum Nanoparticles Market Volume K Tons Forecast, by Country 2020 & 2033
- Table 13: China Platinum Nanoparticles Market Revenue (Million) Forecast, by Application 2020 & 2033
- Table 14: China Platinum Nanoparticles Market Volume (K Tons) Forecast, by Application 2020 & 2033
- Table 15: India Platinum Nanoparticles Market Revenue (Million) Forecast, by Application 2020 & 2033
- Table 16: India Platinum Nanoparticles Market Volume (K Tons) Forecast, by Application 2020 & 2033
- Table 17: Japan Platinum Nanoparticles Market Revenue (Million) Forecast, by Application 2020 & 2033
- Table 18: Japan Platinum Nanoparticles Market Volume (K Tons) Forecast, by Application 2020 & 2033
- Table 19: South Korea Platinum Nanoparticles Market Revenue (Million) Forecast, by Application 2020 & 2033
- Table 20: South Korea Platinum Nanoparticles Market Volume (K Tons) Forecast, by Application 2020 & 2033
- Table 21: Rest of Asia Pacific Platinum Nanoparticles Market Revenue (Million) Forecast, by Application 2020 & 2033
- Table 22: Rest of Asia Pacific Platinum Nanoparticles Market Volume (K Tons) Forecast, by Application 2020 & 2033
- Table 23: Global Platinum Nanoparticles Market Revenue Million Forecast, by Product 2020 & 2033
- Table 24: Global Platinum Nanoparticles Market Volume K Tons Forecast, by Product 2020 & 2033
- Table 25: Global Platinum Nanoparticles Market Revenue Million Forecast, by End-user Industry 2020 & 2033
- Table 26: Global Platinum Nanoparticles Market Volume K Tons Forecast, by End-user Industry 2020 & 2033
- Table 27: Global Platinum Nanoparticles Market Revenue Million Forecast, by Country 2020 & 2033
- Table 28: Global Platinum Nanoparticles Market Volume K Tons Forecast, by Country 2020 & 2033
- Table 29: United States Platinum Nanoparticles Market Revenue (Million) Forecast, by Application 2020 & 2033
- Table 30: United States Platinum Nanoparticles Market Volume (K Tons) Forecast, by Application 2020 & 2033
- Table 31: Canada Platinum Nanoparticles Market Revenue (Million) Forecast, by Application 2020 & 2033
- Table 32: Canada Platinum Nanoparticles Market Volume (K Tons) Forecast, by Application 2020 & 2033
- Table 33: Mexico Platinum Nanoparticles Market Revenue (Million) Forecast, by Application 2020 & 2033
- Table 34: Mexico Platinum Nanoparticles Market Volume (K Tons) Forecast, by Application 2020 & 2033
- Table 35: Global Platinum Nanoparticles Market Revenue Million Forecast, by Product 2020 & 2033
- Table 36: Global Platinum Nanoparticles Market Volume K Tons Forecast, by Product 2020 & 2033
- Table 37: Global Platinum Nanoparticles Market Revenue Million Forecast, by End-user Industry 2020 & 2033
- Table 38: Global Platinum Nanoparticles Market Volume K Tons Forecast, by End-user Industry 2020 & 2033
- Table 39: Global Platinum Nanoparticles Market Revenue Million Forecast, by Country 2020 & 2033
- Table 40: Global Platinum Nanoparticles Market Volume K Tons Forecast, by Country 2020 & 2033
- Table 41: Germany Platinum Nanoparticles Market Revenue (Million) Forecast, by Application 2020 & 2033
- Table 42: Germany Platinum Nanoparticles Market Volume (K Tons) Forecast, by Application 2020 & 2033
- Table 43: United Kingdom Platinum Nanoparticles Market Revenue (Million) Forecast, by Application 2020 & 2033
- Table 44: United Kingdom Platinum Nanoparticles Market Volume (K Tons) Forecast, by Application 2020 & 2033
- Table 45: France Platinum Nanoparticles Market Revenue (Million) Forecast, by Application 2020 & 2033
- Table 46: France Platinum Nanoparticles Market Volume (K Tons) Forecast, by Application 2020 & 2033
- Table 47: Italy Platinum Nanoparticles Market Revenue (Million) Forecast, by Application 2020 & 2033
- Table 48: Italy Platinum Nanoparticles Market Volume (K Tons) Forecast, by Application 2020 & 2033
- Table 49: Rest of Europe Platinum Nanoparticles Market Revenue (Million) Forecast, by Application 2020 & 2033
- Table 50: Rest of Europe Platinum Nanoparticles Market Volume (K Tons) Forecast, by Application 2020 & 2033
- Table 51: Global Platinum Nanoparticles Market Revenue Million Forecast, by Product 2020 & 2033
- Table 52: Global Platinum Nanoparticles Market Volume K Tons Forecast, by Product 2020 & 2033
- Table 53: Global Platinum Nanoparticles Market Revenue Million Forecast, by End-user Industry 2020 & 2033
- Table 54: Global Platinum Nanoparticles Market Volume K Tons Forecast, by End-user Industry 2020 & 2033
- Table 55: Global Platinum Nanoparticles Market Revenue Million Forecast, by Country 2020 & 2033
- Table 56: Global Platinum Nanoparticles Market Volume K Tons Forecast, by Country 2020 & 2033
- Table 57: Brazil Platinum Nanoparticles Market Revenue (Million) Forecast, by Application 2020 & 2033
- Table 58: Brazil Platinum Nanoparticles Market Volume (K Tons) Forecast, by Application 2020 & 2033
- Table 59: Argentina Platinum Nanoparticles Market Revenue (Million) Forecast, by Application 2020 & 2033
- Table 60: Argentina Platinum Nanoparticles Market Volume (K Tons) Forecast, by Application 2020 & 2033
- Table 61: Rest of South America Platinum Nanoparticles Market Revenue (Million) Forecast, by Application 2020 & 2033
- Table 62: Rest of South America Platinum Nanoparticles Market Volume (K Tons) Forecast, by Application 2020 & 2033
- Table 63: Global Platinum Nanoparticles Market Revenue Million Forecast, by Product 2020 & 2033
- Table 64: Global Platinum Nanoparticles Market Volume K Tons Forecast, by Product 2020 & 2033
- Table 65: Global Platinum Nanoparticles Market Revenue Million Forecast, by End-user Industry 2020 & 2033
- Table 66: Global Platinum Nanoparticles Market Volume K Tons Forecast, by End-user Industry 2020 & 2033
- Table 67: Global Platinum Nanoparticles Market Revenue Million Forecast, by Country 2020 & 2033
- Table 68: Global Platinum Nanoparticles Market Volume K Tons Forecast, by Country 2020 & 2033
- Table 69: Saudi Arabia Platinum Nanoparticles Market Revenue (Million) Forecast, by Application 2020 & 2033
- Table 70: Saudi Arabia Platinum Nanoparticles Market Volume (K Tons) Forecast, by Application 2020 & 2033
- Table 71: South Africa Platinum Nanoparticles Market Revenue (Million) Forecast, by Application 2020 & 2033
- Table 72: South Africa Platinum Nanoparticles Market Volume (K Tons) Forecast, by Application 2020 & 2033
- Table 73: Rest of Middle East and Africa Platinum Nanoparticles Market Revenue (Million) Forecast, by Application 2020 & 2033
- Table 74: Rest of Middle East and Africa Platinum Nanoparticles Market Volume (K Tons) Forecast, by Application 2020 & 2033
Frequently Asked Questions
1. What is the projected Compound Annual Growth Rate (CAGR) of the Platinum Nanoparticles Market?
The projected CAGR is approximately 6%.
2. Which companies are prominent players in the Platinum Nanoparticles Market?
Key companies in the market include US Research Nanomaterials Inc, Nanoshel LLC, American Elements, Nanocomposix, Sigma-Aldrich, NanoBio Chemicals India Pvt Ltd, TANAKA HOLDINGS Co Ltd, Nanostructured & Amorphous Materials Inc, Metrohm India Limited, HiQ-Nano s r l, Strem Chemicals Inc, PlasmaChem GmbH, Meliorum Technologies Inc, Particular GMBH, NANOCHEMAZONE.
3. What are the main segments of the Platinum Nanoparticles Market?
The market segments include Product, End-user Industry.
4. Can you provide details about the market size?
The market size is estimated to be USD 283.78 Million as of 2022.
5. What are some drivers contributing to market growth?
; Growing Health Care Industry; Other Drivers.
6. What are the notable trends driving market growth?
Health Care Segment to Dominate the Market.
7. Are there any restraints impacting market growth?
; Toxic Nature of Platinum Nanoparticles; Unfavorable Conditions in Non-medical End-user Industries Arising Due to COVID-19 Outbreak.
8. Can you provide examples of recent developments in the market?
N/A
9. What pricing options are available for accessing the report?
Pricing options include single-user, multi-user, and enterprise licenses priced at USD 4750, USD 5250, and USD 8750 respectively.
10. Is the market size provided in terms of value or volume?
The market size is provided in terms of value, measured in Million and volume, measured in K Tons.
11. Are there any specific market keywords associated with the report?
Yes, the market keyword associated with the report is "Platinum Nanoparticles Market," which aids in identifying and referencing the specific market segment covered.
12. How do I determine which pricing option suits my needs best?
The pricing options vary based on user requirements and access needs. Individual users may opt for single-user licenses, while businesses requiring broader access may choose multi-user or enterprise licenses for cost-effective access to the report.
13. Are there any additional resources or data provided in the Platinum Nanoparticles Market report?
While the report offers comprehensive insights, it's advisable to review the specific contents or supplementary materials provided to ascertain if additional resources or data are available.
14. How can I stay updated on further developments or reports in the Platinum Nanoparticles Market?
To stay informed about further developments, trends, and reports in the Platinum Nanoparticles Market, consider subscribing to industry newsletters, following relevant companies and organizations, or regularly checking reputable industry news sources and publications.
Methodology
Step 1 - Identification of Relevant Samples Size from Population Database


Step 2 - Approaches for Defining Global Market Size (Value, Volume* & Price*)

Note*: In applicable scenarios
Step 3 - Data Sources
Primary Research
- Web Analytics
- Survey Reports
- Research Institute
- Latest Research Reports
- Opinion Leaders
Secondary Research
- Annual Reports
- White Paper
- Latest Press Release
- Industry Association
- Paid Database
- Investor Presentations

Step 4 - Data Triangulation
Involves using different sources of information in order to increase the validity of a study
These sources are likely to be stakeholders in a program - participants, other researchers, program staff, other community members, and so on.
Then we put all data in single framework & apply various statistical tools to find out the dynamic on the market.
During the analysis stage, feedback from the stakeholder groups would be compared to determine areas of agreement as well as areas of divergence