

Key Insights
The Polylactic Acid (PLA) market is experiencing substantial expansion, propelled by the escalating demand for sustainable and biodegradable plastic alternatives. With a projected Compound Annual Growth Rate (CAGR) of 17.5%, the market is anticipated to reach approximately 2.01 billion by 2025. Key growth drivers include a global imperative for sustainability, increasingly stringent regulations on conventional plastics, and the broadening applications of PLA across various industries. The packaging sector remains a primary consumer, driven by consumer preference for eco-friendly options and the widespread adoption of PLA in food packaging and other applications. However, the comparative cost of PLA versus traditional plastics, alongside challenges in scalability and performance, represent notable market restraints. Diverse raw material sources, including corn, cassava, sugarcane, sugar beet, and molasses, contribute to varying cost structures and sustainability profiles, influencing market dynamics. The PLA market is segmented by product form (fiber, films & sheets, coatings, etc.) and by end-user industry (packaging, medical, electronics, agriculture, textiles, and others). The Asia Pacific region, particularly China and India, holds a significant market share due to a robust packaging industry and supportive government policies promoting sustainable materials. North America and Europe also exhibit strong growth potential, influenced by heightened consumer awareness and comprehensive regulatory frameworks. Leading entities such as NatureWorks LLC, Total Corbion PLA, and BASF SE are actively investing in research and development, aiming to improve PLA's performance and reduce its cost to enhance market penetration.
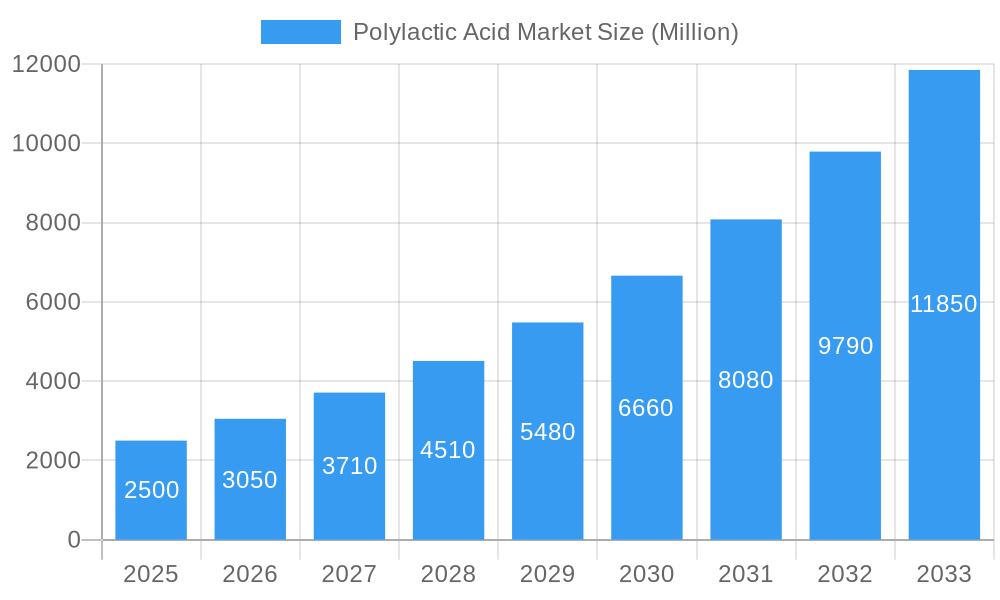
Polylactic Acid Market Market Size (In Billion)
The outlook for the PLA market is highly positive, with considerable expansion potential in emerging economies. Continuous advancements in PLA production technologies and the development of novel applications are expected to significantly boost market growth. Nevertheless, achieving widespread adoption will hinge on further cost reductions, enhancements in material properties, and the establishment of effective recycling infrastructure. Seamless integration of PLA into existing value chains and overcoming current limitations are crucial for realizing its full market potential and addressing the global challenge of plastic pollution. Competitive landscape analysis indicates a dynamic market characterized by a blend of established leaders and emerging players, fostering ongoing innovation to enhance PLA's versatility and minimize its environmental impact.
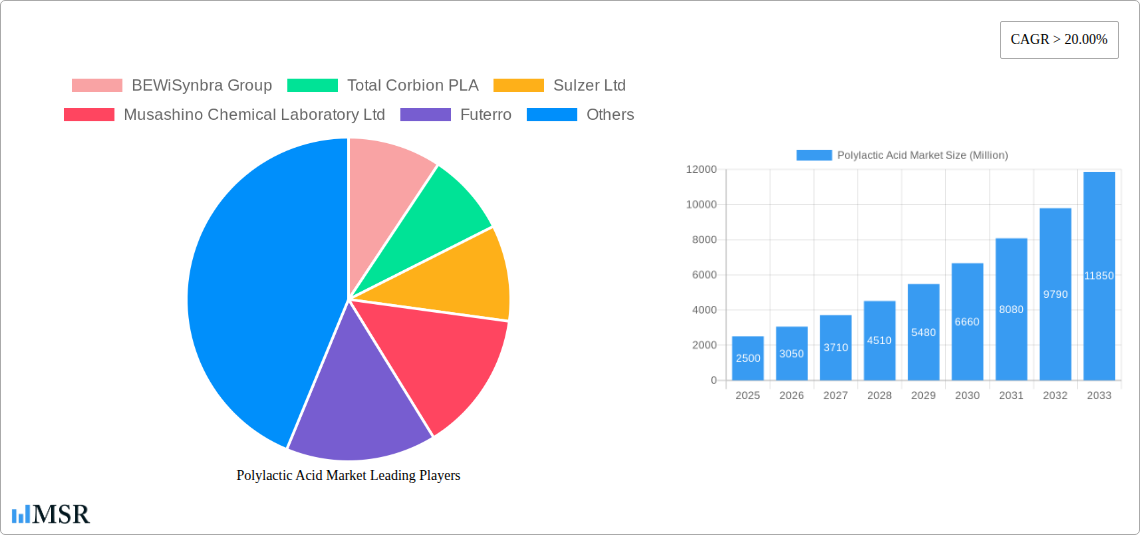
Polylactic Acid Market Company Market Share
Polylactic Acid (PLA) Market Report: A Comprehensive Analysis (2019-2033)
This comprehensive report provides an in-depth analysis of the Polylactic Acid (PLA) market, offering invaluable insights for stakeholders across the value chain. From raw material sourcing to end-user applications, this study covers market dynamics, growth drivers, competitive landscapes, and future projections, helping you navigate the evolving landscape of bioplastics. The report covers the period from 2019 to 2033, with 2025 serving as the base and estimated year. The forecast period extends from 2025 to 2033, providing a long-term perspective on market trends. The market size is expected to reach xx Million by 2033, exhibiting a CAGR of xx% during the forecast period.
Polylactic Acid Market Concentration & Dynamics
The Polylactic Acid (PLA) market exhibits a moderately concentrated landscape, with a few major players holding significant market share. However, the presence of numerous smaller companies indicates a dynamic and competitive environment. Innovation within the PLA ecosystem is driven by advancements in bio-based feedstock utilization, polymer modification, and the development of novel applications. Stringent environmental regulations across the globe, especially regarding plastic waste, are pushing for adoption of biodegradable alternatives, including PLA. Substitute products like other bioplastics (e.g., PHA) and traditional plastics present competition, but PLA's inherent biodegradability and versatility are key strengths. End-user trends are shaped by growing consumer awareness of environmental sustainability and the increasing demand for eco-friendly packaging and consumer goods. The market witnesses consistent M&A activity, with larger companies seeking to consolidate their position and enhance their product portfolios. Between 2019 and 2024, approximately xx M&A deals were recorded in the PLA market, with a notable increase in activity in recent years. Specific examples include collaborations between large chemical companies and smaller bioplastic innovators. Furthermore, market share analysis reveals that the top five players collectively account for approximately xx% of the global market.
Polylactic Acid Market Industry Insights & Trends
The global Polylactic Acid (PLA) market is experiencing robust growth, driven primarily by the increasing demand for sustainable and eco-friendly materials across various sectors. The market size reached xx Million in 2024 and is projected to reach xx Million by 2033, growing at a CAGR of xx%. Key growth drivers include the escalating environmental concerns regarding plastic pollution, stringent government regulations promoting biodegradable alternatives, and the expanding applications of PLA in packaging, textiles, and medical industries. Technological advancements in PLA production, including improved efficiency and cost reduction, are further fueling market expansion. Consumer preference for sustainable and ethically sourced products is also a significant factor, encouraging broader adoption of PLA-based materials. The shift towards a circular economy further strengthens the growth trajectory, as PLA's biodegradability makes it a crucial component of waste management solutions. Moreover, advancements in PLA technology like the development of higher-performance polymers with enhanced properties are broadening its applicability.
Key Markets & Segments Leading Polylactic Acid Market
The packaging industry is currently the dominant end-user segment for PLA, accounting for approximately xx% of the total market share. This is primarily due to the rising demand for compostable and biodegradable packaging solutions. Corn is currently the leading raw material used for PLA production, followed by sugarcane and cassava. Geographically, Asia-Pacific is currently the leading region in terms of PLA consumption, driven by substantial economic growth, rapid industrialization, and increasing consumer awareness of environmental issues. Key factors driving growth within specific segments include:
- Packaging: Growing consumer demand for sustainable packaging alternatives, stricter regulations on plastic waste, and advancements in PLA-based barrier film technology.
- Medical: Expanding applications in medical implants, sutures, drug delivery systems, and disposables due to PLA's biocompatibility and biodegradability.
- Agriculture: Increasing demand for biodegradable mulching films and other agricultural applications.
- Textiles: Growing interest in PLA-based fibers for clothing and other textile products.
The dominance of Asia-Pacific reflects the region's significant manufacturing capacity and high consumption rates within various end-use sectors. North America and Europe are also important markets with notable growth potential.
Polylactic Acid Market Product Developments
Significant advancements in PLA technology have broadened its applications and enhanced its market competitiveness. Recent innovations include the development of high-strength PLA materials, improved barrier properties for food packaging, and the incorporation of PLA into novel composite materials for enhanced functionalities. These developments have widened PLA's applicability across various industries, from medical devices to construction materials, bolstering its position as a viable alternative to traditional plastics. Companies are actively exploring methods to enhance PLA's processability, thermal stability, and cost-effectiveness to compete more effectively in the broader plastics market.
Challenges in the Polylactic Acid Market Market
The PLA market faces several challenges, including the relatively high production cost compared to traditional petroleum-based plastics. This price disparity hinders wider adoption in price-sensitive applications. Furthermore, the performance characteristics of PLA, such as its sensitivity to moisture and temperature, sometimes limit its usage in certain applications. Supply chain limitations for feedstock materials and technological hurdles in scaling up PLA production efficiently also pose significant barriers. Finally, the need for improved infrastructure for PLA composting and recycling remains a critical concern. These challenges collectively impact the market's growth and require concerted efforts from industry players and policymakers to overcome. For example, limited availability of suitable composting facilities restricts the full realization of PLA's biodegradability advantages, impacting market acceptance.
Forces Driving Polylactic Acid Market Growth
Technological advancements, particularly in improving PLA's properties and reducing its production costs, are key drivers of market expansion. Growing consumer preference for sustainable alternatives to traditional plastics, coupled with stricter environmental regulations, fuels the demand for PLA-based products. Increasing investments in research and development focused on PLA production and applications further contribute to the growth trajectory. Government initiatives to promote the adoption of biodegradable materials and incentives for using renewable resources are also strengthening the market. For example, several countries now mandate the use of biodegradable packaging for certain products.
Long-Term Growth Catalysts in the Polylactic Acid Market
Long-term growth in the PLA market is propelled by continuous innovation in PLA polymer chemistry and processing technology. Strategic partnerships between material producers and end-user companies are streamlining the development and commercialization of PLA-based products. The expansion of PLA applications into new and emerging markets, such as advanced biomedicine and flexible electronics, enhances the market's long-term growth potential.
Emerging Opportunities in Polylactic Acid Market
Emerging opportunities lie in the development of novel PLA-based composites and blends with improved properties for specific applications. Expanding the use of PLA in 3D printing and other additive manufacturing processes represents a significant opportunity. The potential to create fully circular and closed-loop systems for PLA production and recycling holds substantial long-term growth potential.
Leading Players in the Polylactic Acid Market Sector
- BEWiSynbra Group
- Total Corbion PLA
- Sulzer Ltd
- Musashino Chemical Laboratory Ltd
- Futerro
- BASF SE
- Esun
- Zhejiang Hisun Biomaterials Co Ltd
- Shanghai Tong Jie Liang Biomaterials Co Ltd
- NatureWorks LLC
- Cofco
- Polysciences Inc
- Weforyou
- Jiangxi Keyuan Bio-Material Co Ltd
- Danimer Scientific
Key Milestones in Polylactic Acid Market Industry
- May 2023: Sulzer's agreement with Jindan New Biomaterials to produce up to 750,000 tonnes of PLA annually for packaging, molded goods, and fiber production signals a major expansion in manufacturing capacity.
- September 2023: Danimer Scientific's collaboration with Chevron Phillips Chemical to develop high-volume biodegradable plastic products using Rinnovo polymers showcases a significant push towards increasing PLA production and market penetration.
Strategic Outlook for Polylactic Acid Market Market
The future of the PLA market looks promising, with continued growth anticipated due to the increasing demand for sustainable materials. Strategic investments in research and development, coupled with the development of innovative applications and efficient production methods, will be crucial for long-term success. The focus on creating a circular economy, emphasizing recycling and waste management solutions, will play a vital role in shaping the future of this dynamic market. The market's potential lies in its ability to offer sustainable, eco-friendly alternatives and to effectively address the global challenge of plastic pollution.
Polylactic Acid Market Segmentation
-
1. Raw Material
- 1.1. Corn
- 1.2. Cassava
- 1.3. Sugarcane and Sugar Beet
- 1.4. Other Raw Materials(molasses, potato, wheat)
-
2. Form
- 2.1. Fiber
- 2.2. Films and Sheets
- 2.3. Coatings
- 2.4. Other Forms
-
3. End-user Industry
- 3.1. Packaging
- 3.2. Medical
- 3.3. Electronics
- 3.4. Agriculture
- 3.5. Textiles
- 3.6. Other En
Polylactic Acid Market Segmentation By Geography
-
1. Asia Pacific
- 1.1. China
- 1.2. India
- 1.3. Japan
- 1.4. South Korea
- 1.5. ASEAN Countries
- 1.6. Rest of Asia Pacific
-
2. North America
- 2.1. United States
- 2.2. Canada
- 2.3. Mexico
-
3. Europe
- 3.1. Germany
- 3.2. United Kingdom
- 3.3. France
- 3.4. Italy
- 3.5. CIS region
- 3.6. Rest of Europe
-
4. South America
- 4.1. Brazil
- 4.2. Argentina
- 4.3. Rest of South America
-
5. Middle East and Africa
- 5.1. Saudi Arabia
- 5.2. South Africa
- 5.3. Rest of Middle East and Africa
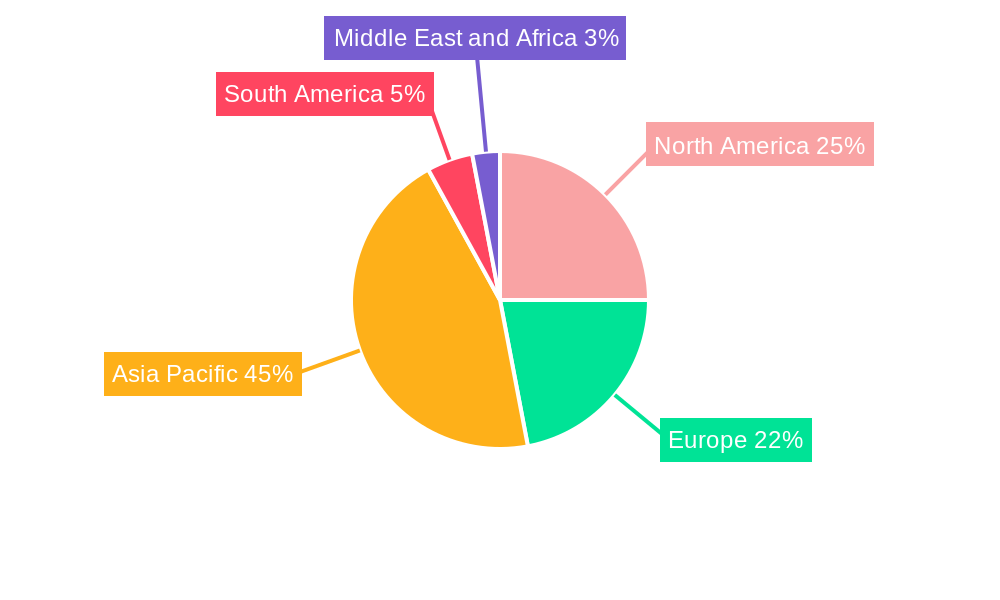
Polylactic Acid Market Regional Market Share
Geographic Coverage of Polylactic Acid Market
Polylactic Acid Market REPORT HIGHLIGHTS
| Aspects | Details |
|---|---|
| Study Period | 2020-2034 |
| Base Year | 2025 |
| Estimated Year | 2026 |
| Forecast Period | 2026-2034 |
| Historical Period | 2020-2025 |
| Growth Rate | CAGR of 17.5% from 2020-2034 |
| Segmentation |
|
Table of Contents
- 1. Introduction
- 1.1. Research Scope
- 1.2. Market Segmentation
- 1.3. Research Objective
- 1.4. Definitions and Assumptions
- 2. Executive Summary
- 2.1. Market Snapshot
- 3. Market Dynamics
- 3.1. Market Drivers
- 3.2. Market Restrains
- 3.3. Market Trends
- 3.4. Market Opportunities
- 4. Market Factor Analysis
- 4.1. Porters Five Forces
- 4.1.1. Bargaining Power of Suppliers
- 4.1.2. Bargaining Power of Buyers
- 4.1.3. Threat of New Entrants
- 4.1.4. Threat of Substitutes
- 4.1.5. Competitive Rivalry
- 4.2. PESTEL analysis
- 4.3. BCG Analysis
- 4.3.1. Stars (High Growth, High Market Share)
- 4.3.2. Cash Cows (Low Growth, High Market Share)
- 4.3.3. Question Mark (High Growth, Low Market Share)
- 4.3.4. Dogs (Low Growth, Low Market Share)
- 4.4. Ansoff Matrix Analysis
- 4.5. Supply Chain Analysis
- 4.6. Regulatory Landscape
- 4.7. Current Market Potential and Opportunity Assessment (TAM–SAM–SOM Framework)
- 4.8. MSR Analyst Note
- 4.1. Porters Five Forces
- 5. Market Analysis, Insights and Forecast 2021-2033
- 5.1. Market Analysis, Insights and Forecast - by Raw Material
- 5.1.1. Corn
- 5.1.2. Cassava
- 5.1.3. Sugarcane and Sugar Beet
- 5.1.4. Other Raw Materials(molasses, potato, wheat)
- 5.2. Market Analysis, Insights and Forecast - by Form
- 5.2.1. Fiber
- 5.2.2. Films and Sheets
- 5.2.3. Coatings
- 5.2.4. Other Forms
- 5.3. Market Analysis, Insights and Forecast - by End-user Industry
- 5.3.1. Packaging
- 5.3.2. Medical
- 5.3.3. Electronics
- 5.3.4. Agriculture
- 5.3.5. Textiles
- 5.3.6. Other En
- 5.4. Market Analysis, Insights and Forecast - by Region
- 5.4.1. Asia Pacific
- 5.4.2. North America
- 5.4.3. Europe
- 5.4.4. South America
- 5.4.5. Middle East and Africa
- 5.1. Market Analysis, Insights and Forecast - by Raw Material
- 6. Global Polylactic Acid Market Analysis, Insights and Forecast, 2021-2033
- 6.1. Market Analysis, Insights and Forecast - by Raw Material
- 6.1.1. Corn
- 6.1.2. Cassava
- 6.1.3. Sugarcane and Sugar Beet
- 6.1.4. Other Raw Materials(molasses, potato, wheat)
- 6.2. Market Analysis, Insights and Forecast - by Form
- 6.2.1. Fiber
- 6.2.2. Films and Sheets
- 6.2.3. Coatings
- 6.2.4. Other Forms
- 6.3. Market Analysis, Insights and Forecast - by End-user Industry
- 6.3.1. Packaging
- 6.3.2. Medical
- 6.3.3. Electronics
- 6.3.4. Agriculture
- 6.3.5. Textiles
- 6.3.6. Other En
- 6.1. Market Analysis, Insights and Forecast - by Raw Material
- 7. Asia Pacific Polylactic Acid Market Analysis, Insights and Forecast, 2020-2032
- 7.1. Market Analysis, Insights and Forecast - by Raw Material
- 7.1.1. Corn
- 7.1.2. Cassava
- 7.1.3. Sugarcane and Sugar Beet
- 7.1.4. Other Raw Materials(molasses, potato, wheat)
- 7.2. Market Analysis, Insights and Forecast - by Form
- 7.2.1. Fiber
- 7.2.2. Films and Sheets
- 7.2.3. Coatings
- 7.2.4. Other Forms
- 7.3. Market Analysis, Insights and Forecast - by End-user Industry
- 7.3.1. Packaging
- 7.3.2. Medical
- 7.3.3. Electronics
- 7.3.4. Agriculture
- 7.3.5. Textiles
- 7.3.6. Other En
- 7.1. Market Analysis, Insights and Forecast - by Raw Material
- 8. North America Polylactic Acid Market Analysis, Insights and Forecast, 2020-2032
- 8.1. Market Analysis, Insights and Forecast - by Raw Material
- 8.1.1. Corn
- 8.1.2. Cassava
- 8.1.3. Sugarcane and Sugar Beet
- 8.1.4. Other Raw Materials(molasses, potato, wheat)
- 8.2. Market Analysis, Insights and Forecast - by Form
- 8.2.1. Fiber
- 8.2.2. Films and Sheets
- 8.2.3. Coatings
- 8.2.4. Other Forms
- 8.3. Market Analysis, Insights and Forecast - by End-user Industry
- 8.3.1. Packaging
- 8.3.2. Medical
- 8.3.3. Electronics
- 8.3.4. Agriculture
- 8.3.5. Textiles
- 8.3.6. Other En
- 8.1. Market Analysis, Insights and Forecast - by Raw Material
- 9. Europe Polylactic Acid Market Analysis, Insights and Forecast, 2020-2032
- 9.1. Market Analysis, Insights and Forecast - by Raw Material
- 9.1.1. Corn
- 9.1.2. Cassava
- 9.1.3. Sugarcane and Sugar Beet
- 9.1.4. Other Raw Materials(molasses, potato, wheat)
- 9.2. Market Analysis, Insights and Forecast - by Form
- 9.2.1. Fiber
- 9.2.2. Films and Sheets
- 9.2.3. Coatings
- 9.2.4. Other Forms
- 9.3. Market Analysis, Insights and Forecast - by End-user Industry
- 9.3.1. Packaging
- 9.3.2. Medical
- 9.3.3. Electronics
- 9.3.4. Agriculture
- 9.3.5. Textiles
- 9.3.6. Other En
- 9.1. Market Analysis, Insights and Forecast - by Raw Material
- 10. South America Polylactic Acid Market Analysis, Insights and Forecast, 2020-2032
- 10.1. Market Analysis, Insights and Forecast - by Raw Material
- 10.1.1. Corn
- 10.1.2. Cassava
- 10.1.3. Sugarcane and Sugar Beet
- 10.1.4. Other Raw Materials(molasses, potato, wheat)
- 10.2. Market Analysis, Insights and Forecast - by Form
- 10.2.1. Fiber
- 10.2.2. Films and Sheets
- 10.2.3. Coatings
- 10.2.4. Other Forms
- 10.3. Market Analysis, Insights and Forecast - by End-user Industry
- 10.3.1. Packaging
- 10.3.2. Medical
- 10.3.3. Electronics
- 10.3.4. Agriculture
- 10.3.5. Textiles
- 10.3.6. Other En
- 10.1. Market Analysis, Insights and Forecast - by Raw Material
- 11. Middle East and Africa Polylactic Acid Market Analysis, Insights and Forecast, 2020-2032
- 11.1. Market Analysis, Insights and Forecast - by Raw Material
- 11.1.1. Corn
- 11.1.2. Cassava
- 11.1.3. Sugarcane and Sugar Beet
- 11.1.4. Other Raw Materials(molasses, potato, wheat)
- 11.2. Market Analysis, Insights and Forecast - by Form
- 11.2.1. Fiber
- 11.2.2. Films and Sheets
- 11.2.3. Coatings
- 11.2.4. Other Forms
- 11.3. Market Analysis, Insights and Forecast - by End-user Industry
- 11.3.1. Packaging
- 11.3.2. Medical
- 11.3.3. Electronics
- 11.3.4. Agriculture
- 11.3.5. Textiles
- 11.3.6. Other En
- 11.1. Market Analysis, Insights and Forecast - by Raw Material
- 12. Competitive Analysis
- 12.1. Company Profiles
- 12.1.1 BEWiSynbra Group
- 12.1.1.1. Company Overview
- 12.1.1.2. Products
- 12.1.1.3. Company Financials
- 12.1.1.4. SWOT Analysis
- 12.1.2 Total Corbion PLA
- 12.1.2.1. Company Overview
- 12.1.2.2. Products
- 12.1.2.3. Company Financials
- 12.1.2.4. SWOT Analysis
- 12.1.3 Sulzer Ltd
- 12.1.3.1. Company Overview
- 12.1.3.2. Products
- 12.1.3.3. Company Financials
- 12.1.3.4. SWOT Analysis
- 12.1.4 Musashino Chemical Laboratory Ltd
- 12.1.4.1. Company Overview
- 12.1.4.2. Products
- 12.1.4.3. Company Financials
- 12.1.4.4. SWOT Analysis
- 12.1.5 Futerro
- 12.1.5.1. Company Overview
- 12.1.5.2. Products
- 12.1.5.3. Company Financials
- 12.1.5.4. SWOT Analysis
- 12.1.6 BASF SE
- 12.1.6.1. Company Overview
- 12.1.6.2. Products
- 12.1.6.3. Company Financials
- 12.1.6.4. SWOT Analysis
- 12.1.7 Esun
- 12.1.7.1. Company Overview
- 12.1.7.2. Products
- 12.1.7.3. Company Financials
- 12.1.7.4. SWOT Analysis
- 12.1.8 Zhejiang Hisun Biomaterials Co Ltd*List Not Exhaustive
- 12.1.8.1. Company Overview
- 12.1.8.2. Products
- 12.1.8.3. Company Financials
- 12.1.8.4. SWOT Analysis
- 12.1.9 Shanghai Tong Jie Liang Biomaterials Co Ltd
- 12.1.9.1. Company Overview
- 12.1.9.2. Products
- 12.1.9.3. Company Financials
- 12.1.9.4. SWOT Analysis
- 12.1.10 NatureWorks LLC
- 12.1.10.1. Company Overview
- 12.1.10.2. Products
- 12.1.10.3. Company Financials
- 12.1.10.4. SWOT Analysis
- 12.1.11 Cofco
- 12.1.11.1. Company Overview
- 12.1.11.2. Products
- 12.1.11.3. Company Financials
- 12.1.11.4. SWOT Analysis
- 12.1.12 Polysciences Inc
- 12.1.12.1. Company Overview
- 12.1.12.2. Products
- 12.1.12.3. Company Financials
- 12.1.12.4. SWOT Analysis
- 12.1.13 Weforyou
- 12.1.13.1. Company Overview
- 12.1.13.2. Products
- 12.1.13.3. Company Financials
- 12.1.13.4. SWOT Analysis
- 12.1.14 Jiangxi Keyuan Bio-Material Co Ltd
- 12.1.14.1. Company Overview
- 12.1.14.2. Products
- 12.1.14.3. Company Financials
- 12.1.14.4. SWOT Analysis
- 12.1.15 Danimer Scientific
- 12.1.15.1. Company Overview
- 12.1.15.2. Products
- 12.1.15.3. Company Financials
- 12.1.15.4. SWOT Analysis
- 12.1.1 BEWiSynbra Group
- 12.2. Market Entropy
- 12.2.1 Company's Key Areas Served
- 12.2.2 Recent Developments
- 12.3. Company Market Share Analysis 2025
- 12.3.1 Top 5 Companies Market Share Analysis
- 12.3.2 Top 3 Companies Market Share Analysis
- 12.4. List of Potential Customers
- 13. Research Methodology
List of Figures
- Figure 1: Global Polylactic Acid Market Revenue Breakdown (billion, %) by Region 2025 & 2033
- Figure 2: Global Polylactic Acid Market Volume Breakdown (Million, %) by Region 2025 & 2033
- Figure 3: Asia Pacific Polylactic Acid Market Revenue (billion), by Raw Material 2025 & 2033
- Figure 4: Asia Pacific Polylactic Acid Market Volume (Million), by Raw Material 2025 & 2033
- Figure 5: Asia Pacific Polylactic Acid Market Revenue Share (%), by Raw Material 2025 & 2033
- Figure 6: Asia Pacific Polylactic Acid Market Volume Share (%), by Raw Material 2025 & 2033
- Figure 7: Asia Pacific Polylactic Acid Market Revenue (billion), by Form 2025 & 2033
- Figure 8: Asia Pacific Polylactic Acid Market Volume (Million), by Form 2025 & 2033
- Figure 9: Asia Pacific Polylactic Acid Market Revenue Share (%), by Form 2025 & 2033
- Figure 10: Asia Pacific Polylactic Acid Market Volume Share (%), by Form 2025 & 2033
- Figure 11: Asia Pacific Polylactic Acid Market Revenue (billion), by End-user Industry 2025 & 2033
- Figure 12: Asia Pacific Polylactic Acid Market Volume (Million), by End-user Industry 2025 & 2033
- Figure 13: Asia Pacific Polylactic Acid Market Revenue Share (%), by End-user Industry 2025 & 2033
- Figure 14: Asia Pacific Polylactic Acid Market Volume Share (%), by End-user Industry 2025 & 2033
- Figure 15: Asia Pacific Polylactic Acid Market Revenue (billion), by Country 2025 & 2033
- Figure 16: Asia Pacific Polylactic Acid Market Volume (Million), by Country 2025 & 2033
- Figure 17: Asia Pacific Polylactic Acid Market Revenue Share (%), by Country 2025 & 2033
- Figure 18: Asia Pacific Polylactic Acid Market Volume Share (%), by Country 2025 & 2033
- Figure 19: North America Polylactic Acid Market Revenue (billion), by Raw Material 2025 & 2033
- Figure 20: North America Polylactic Acid Market Volume (Million), by Raw Material 2025 & 2033
- Figure 21: North America Polylactic Acid Market Revenue Share (%), by Raw Material 2025 & 2033
- Figure 22: North America Polylactic Acid Market Volume Share (%), by Raw Material 2025 & 2033
- Figure 23: North America Polylactic Acid Market Revenue (billion), by Form 2025 & 2033
- Figure 24: North America Polylactic Acid Market Volume (Million), by Form 2025 & 2033
- Figure 25: North America Polylactic Acid Market Revenue Share (%), by Form 2025 & 2033
- Figure 26: North America Polylactic Acid Market Volume Share (%), by Form 2025 & 2033
- Figure 27: North America Polylactic Acid Market Revenue (billion), by End-user Industry 2025 & 2033
- Figure 28: North America Polylactic Acid Market Volume (Million), by End-user Industry 2025 & 2033
- Figure 29: North America Polylactic Acid Market Revenue Share (%), by End-user Industry 2025 & 2033
- Figure 30: North America Polylactic Acid Market Volume Share (%), by End-user Industry 2025 & 2033
- Figure 31: North America Polylactic Acid Market Revenue (billion), by Country 2025 & 2033
- Figure 32: North America Polylactic Acid Market Volume (Million), by Country 2025 & 2033
- Figure 33: North America Polylactic Acid Market Revenue Share (%), by Country 2025 & 2033
- Figure 34: North America Polylactic Acid Market Volume Share (%), by Country 2025 & 2033
- Figure 35: Europe Polylactic Acid Market Revenue (billion), by Raw Material 2025 & 2033
- Figure 36: Europe Polylactic Acid Market Volume (Million), by Raw Material 2025 & 2033
- Figure 37: Europe Polylactic Acid Market Revenue Share (%), by Raw Material 2025 & 2033
- Figure 38: Europe Polylactic Acid Market Volume Share (%), by Raw Material 2025 & 2033
- Figure 39: Europe Polylactic Acid Market Revenue (billion), by Form 2025 & 2033
- Figure 40: Europe Polylactic Acid Market Volume (Million), by Form 2025 & 2033
- Figure 41: Europe Polylactic Acid Market Revenue Share (%), by Form 2025 & 2033
- Figure 42: Europe Polylactic Acid Market Volume Share (%), by Form 2025 & 2033
- Figure 43: Europe Polylactic Acid Market Revenue (billion), by End-user Industry 2025 & 2033
- Figure 44: Europe Polylactic Acid Market Volume (Million), by End-user Industry 2025 & 2033
- Figure 45: Europe Polylactic Acid Market Revenue Share (%), by End-user Industry 2025 & 2033
- Figure 46: Europe Polylactic Acid Market Volume Share (%), by End-user Industry 2025 & 2033
- Figure 47: Europe Polylactic Acid Market Revenue (billion), by Country 2025 & 2033
- Figure 48: Europe Polylactic Acid Market Volume (Million), by Country 2025 & 2033
- Figure 49: Europe Polylactic Acid Market Revenue Share (%), by Country 2025 & 2033
- Figure 50: Europe Polylactic Acid Market Volume Share (%), by Country 2025 & 2033
- Figure 51: South America Polylactic Acid Market Revenue (billion), by Raw Material 2025 & 2033
- Figure 52: South America Polylactic Acid Market Volume (Million), by Raw Material 2025 & 2033
- Figure 53: South America Polylactic Acid Market Revenue Share (%), by Raw Material 2025 & 2033
- Figure 54: South America Polylactic Acid Market Volume Share (%), by Raw Material 2025 & 2033
- Figure 55: South America Polylactic Acid Market Revenue (billion), by Form 2025 & 2033
- Figure 56: South America Polylactic Acid Market Volume (Million), by Form 2025 & 2033
- Figure 57: South America Polylactic Acid Market Revenue Share (%), by Form 2025 & 2033
- Figure 58: South America Polylactic Acid Market Volume Share (%), by Form 2025 & 2033
- Figure 59: South America Polylactic Acid Market Revenue (billion), by End-user Industry 2025 & 2033
- Figure 60: South America Polylactic Acid Market Volume (Million), by End-user Industry 2025 & 2033
- Figure 61: South America Polylactic Acid Market Revenue Share (%), by End-user Industry 2025 & 2033
- Figure 62: South America Polylactic Acid Market Volume Share (%), by End-user Industry 2025 & 2033
- Figure 63: South America Polylactic Acid Market Revenue (billion), by Country 2025 & 2033
- Figure 64: South America Polylactic Acid Market Volume (Million), by Country 2025 & 2033
- Figure 65: South America Polylactic Acid Market Revenue Share (%), by Country 2025 & 2033
- Figure 66: South America Polylactic Acid Market Volume Share (%), by Country 2025 & 2033
- Figure 67: Middle East and Africa Polylactic Acid Market Revenue (billion), by Raw Material 2025 & 2033
- Figure 68: Middle East and Africa Polylactic Acid Market Volume (Million), by Raw Material 2025 & 2033
- Figure 69: Middle East and Africa Polylactic Acid Market Revenue Share (%), by Raw Material 2025 & 2033
- Figure 70: Middle East and Africa Polylactic Acid Market Volume Share (%), by Raw Material 2025 & 2033
- Figure 71: Middle East and Africa Polylactic Acid Market Revenue (billion), by Form 2025 & 2033
- Figure 72: Middle East and Africa Polylactic Acid Market Volume (Million), by Form 2025 & 2033
- Figure 73: Middle East and Africa Polylactic Acid Market Revenue Share (%), by Form 2025 & 2033
- Figure 74: Middle East and Africa Polylactic Acid Market Volume Share (%), by Form 2025 & 2033
- Figure 75: Middle East and Africa Polylactic Acid Market Revenue (billion), by End-user Industry 2025 & 2033
- Figure 76: Middle East and Africa Polylactic Acid Market Volume (Million), by End-user Industry 2025 & 2033
- Figure 77: Middle East and Africa Polylactic Acid Market Revenue Share (%), by End-user Industry 2025 & 2033
- Figure 78: Middle East and Africa Polylactic Acid Market Volume Share (%), by End-user Industry 2025 & 2033
- Figure 79: Middle East and Africa Polylactic Acid Market Revenue (billion), by Country 2025 & 2033
- Figure 80: Middle East and Africa Polylactic Acid Market Volume (Million), by Country 2025 & 2033
- Figure 81: Middle East and Africa Polylactic Acid Market Revenue Share (%), by Country 2025 & 2033
- Figure 82: Middle East and Africa Polylactic Acid Market Volume Share (%), by Country 2025 & 2033
List of Tables
- Table 1: Global Polylactic Acid Market Revenue billion Forecast, by Raw Material 2020 & 2033
- Table 2: Global Polylactic Acid Market Volume Million Forecast, by Raw Material 2020 & 2033
- Table 3: Global Polylactic Acid Market Revenue billion Forecast, by Form 2020 & 2033
- Table 4: Global Polylactic Acid Market Volume Million Forecast, by Form 2020 & 2033
- Table 5: Global Polylactic Acid Market Revenue billion Forecast, by End-user Industry 2020 & 2033
- Table 6: Global Polylactic Acid Market Volume Million Forecast, by End-user Industry 2020 & 2033
- Table 7: Global Polylactic Acid Market Revenue billion Forecast, by Region 2020 & 2033
- Table 8: Global Polylactic Acid Market Volume Million Forecast, by Region 2020 & 2033
- Table 9: Global Polylactic Acid Market Revenue billion Forecast, by Raw Material 2020 & 2033
- Table 10: Global Polylactic Acid Market Volume Million Forecast, by Raw Material 2020 & 2033
- Table 11: Global Polylactic Acid Market Revenue billion Forecast, by Form 2020 & 2033
- Table 12: Global Polylactic Acid Market Volume Million Forecast, by Form 2020 & 2033
- Table 13: Global Polylactic Acid Market Revenue billion Forecast, by End-user Industry 2020 & 2033
- Table 14: Global Polylactic Acid Market Volume Million Forecast, by End-user Industry 2020 & 2033
- Table 15: Global Polylactic Acid Market Revenue billion Forecast, by Country 2020 & 2033
- Table 16: Global Polylactic Acid Market Volume Million Forecast, by Country 2020 & 2033
- Table 17: China Polylactic Acid Market Revenue (billion) Forecast, by Application 2020 & 2033
- Table 18: China Polylactic Acid Market Volume (Million) Forecast, by Application 2020 & 2033
- Table 19: India Polylactic Acid Market Revenue (billion) Forecast, by Application 2020 & 2033
- Table 20: India Polylactic Acid Market Volume (Million) Forecast, by Application 2020 & 2033
- Table 21: Japan Polylactic Acid Market Revenue (billion) Forecast, by Application 2020 & 2033
- Table 22: Japan Polylactic Acid Market Volume (Million) Forecast, by Application 2020 & 2033
- Table 23: South Korea Polylactic Acid Market Revenue (billion) Forecast, by Application 2020 & 2033
- Table 24: South Korea Polylactic Acid Market Volume (Million) Forecast, by Application 2020 & 2033
- Table 25: ASEAN Countries Polylactic Acid Market Revenue (billion) Forecast, by Application 2020 & 2033
- Table 26: ASEAN Countries Polylactic Acid Market Volume (Million) Forecast, by Application 2020 & 2033
- Table 27: Rest of Asia Pacific Polylactic Acid Market Revenue (billion) Forecast, by Application 2020 & 2033
- Table 28: Rest of Asia Pacific Polylactic Acid Market Volume (Million) Forecast, by Application 2020 & 2033
- Table 29: Global Polylactic Acid Market Revenue billion Forecast, by Raw Material 2020 & 2033
- Table 30: Global Polylactic Acid Market Volume Million Forecast, by Raw Material 2020 & 2033
- Table 31: Global Polylactic Acid Market Revenue billion Forecast, by Form 2020 & 2033
- Table 32: Global Polylactic Acid Market Volume Million Forecast, by Form 2020 & 2033
- Table 33: Global Polylactic Acid Market Revenue billion Forecast, by End-user Industry 2020 & 2033
- Table 34: Global Polylactic Acid Market Volume Million Forecast, by End-user Industry 2020 & 2033
- Table 35: Global Polylactic Acid Market Revenue billion Forecast, by Country 2020 & 2033
- Table 36: Global Polylactic Acid Market Volume Million Forecast, by Country 2020 & 2033
- Table 37: United States Polylactic Acid Market Revenue (billion) Forecast, by Application 2020 & 2033
- Table 38: United States Polylactic Acid Market Volume (Million) Forecast, by Application 2020 & 2033
- Table 39: Canada Polylactic Acid Market Revenue (billion) Forecast, by Application 2020 & 2033
- Table 40: Canada Polylactic Acid Market Volume (Million) Forecast, by Application 2020 & 2033
- Table 41: Mexico Polylactic Acid Market Revenue (billion) Forecast, by Application 2020 & 2033
- Table 42: Mexico Polylactic Acid Market Volume (Million) Forecast, by Application 2020 & 2033
- Table 43: Global Polylactic Acid Market Revenue billion Forecast, by Raw Material 2020 & 2033
- Table 44: Global Polylactic Acid Market Volume Million Forecast, by Raw Material 2020 & 2033
- Table 45: Global Polylactic Acid Market Revenue billion Forecast, by Form 2020 & 2033
- Table 46: Global Polylactic Acid Market Volume Million Forecast, by Form 2020 & 2033
- Table 47: Global Polylactic Acid Market Revenue billion Forecast, by End-user Industry 2020 & 2033
- Table 48: Global Polylactic Acid Market Volume Million Forecast, by End-user Industry 2020 & 2033
- Table 49: Global Polylactic Acid Market Revenue billion Forecast, by Country 2020 & 2033
- Table 50: Global Polylactic Acid Market Volume Million Forecast, by Country 2020 & 2033
- Table 51: Germany Polylactic Acid Market Revenue (billion) Forecast, by Application 2020 & 2033
- Table 52: Germany Polylactic Acid Market Volume (Million) Forecast, by Application 2020 & 2033
- Table 53: United Kingdom Polylactic Acid Market Revenue (billion) Forecast, by Application 2020 & 2033
- Table 54: United Kingdom Polylactic Acid Market Volume (Million) Forecast, by Application 2020 & 2033
- Table 55: France Polylactic Acid Market Revenue (billion) Forecast, by Application 2020 & 2033
- Table 56: France Polylactic Acid Market Volume (Million) Forecast, by Application 2020 & 2033
- Table 57: Italy Polylactic Acid Market Revenue (billion) Forecast, by Application 2020 & 2033
- Table 58: Italy Polylactic Acid Market Volume (Million) Forecast, by Application 2020 & 2033
- Table 59: CIS region Polylactic Acid Market Revenue (billion) Forecast, by Application 2020 & 2033
- Table 60: CIS region Polylactic Acid Market Volume (Million) Forecast, by Application 2020 & 2033
- Table 61: Rest of Europe Polylactic Acid Market Revenue (billion) Forecast, by Application 2020 & 2033
- Table 62: Rest of Europe Polylactic Acid Market Volume (Million) Forecast, by Application 2020 & 2033
- Table 63: Global Polylactic Acid Market Revenue billion Forecast, by Raw Material 2020 & 2033
- Table 64: Global Polylactic Acid Market Volume Million Forecast, by Raw Material 2020 & 2033
- Table 65: Global Polylactic Acid Market Revenue billion Forecast, by Form 2020 & 2033
- Table 66: Global Polylactic Acid Market Volume Million Forecast, by Form 2020 & 2033
- Table 67: Global Polylactic Acid Market Revenue billion Forecast, by End-user Industry 2020 & 2033
- Table 68: Global Polylactic Acid Market Volume Million Forecast, by End-user Industry 2020 & 2033
- Table 69: Global Polylactic Acid Market Revenue billion Forecast, by Country 2020 & 2033
- Table 70: Global Polylactic Acid Market Volume Million Forecast, by Country 2020 & 2033
- Table 71: Brazil Polylactic Acid Market Revenue (billion) Forecast, by Application 2020 & 2033
- Table 72: Brazil Polylactic Acid Market Volume (Million) Forecast, by Application 2020 & 2033
- Table 73: Argentina Polylactic Acid Market Revenue (billion) Forecast, by Application 2020 & 2033
- Table 74: Argentina Polylactic Acid Market Volume (Million) Forecast, by Application 2020 & 2033
- Table 75: Rest of South America Polylactic Acid Market Revenue (billion) Forecast, by Application 2020 & 2033
- Table 76: Rest of South America Polylactic Acid Market Volume (Million) Forecast, by Application 2020 & 2033
- Table 77: Global Polylactic Acid Market Revenue billion Forecast, by Raw Material 2020 & 2033
- Table 78: Global Polylactic Acid Market Volume Million Forecast, by Raw Material 2020 & 2033
- Table 79: Global Polylactic Acid Market Revenue billion Forecast, by Form 2020 & 2033
- Table 80: Global Polylactic Acid Market Volume Million Forecast, by Form 2020 & 2033
- Table 81: Global Polylactic Acid Market Revenue billion Forecast, by End-user Industry 2020 & 2033
- Table 82: Global Polylactic Acid Market Volume Million Forecast, by End-user Industry 2020 & 2033
- Table 83: Global Polylactic Acid Market Revenue billion Forecast, by Country 2020 & 2033
- Table 84: Global Polylactic Acid Market Volume Million Forecast, by Country 2020 & 2033
- Table 85: Saudi Arabia Polylactic Acid Market Revenue (billion) Forecast, by Application 2020 & 2033
- Table 86: Saudi Arabia Polylactic Acid Market Volume (Million) Forecast, by Application 2020 & 2033
- Table 87: South Africa Polylactic Acid Market Revenue (billion) Forecast, by Application 2020 & 2033
- Table 88: South Africa Polylactic Acid Market Volume (Million) Forecast, by Application 2020 & 2033
- Table 89: Rest of Middle East and Africa Polylactic Acid Market Revenue (billion) Forecast, by Application 2020 & 2033
- Table 90: Rest of Middle East and Africa Polylactic Acid Market Volume (Million) Forecast, by Application 2020 & 2033
Frequently Asked Questions
1. What is the projected Compound Annual Growth Rate (CAGR) of the Polylactic Acid Market?
The projected CAGR is approximately 17.5%.
2. Which companies are prominent players in the Polylactic Acid Market?
Key companies in the market include BEWiSynbra Group, Total Corbion PLA, Sulzer Ltd, Musashino Chemical Laboratory Ltd, Futerro, BASF SE, Esun, Zhejiang Hisun Biomaterials Co Ltd*List Not Exhaustive, Shanghai Tong Jie Liang Biomaterials Co Ltd, NatureWorks LLC, Cofco, Polysciences Inc, Weforyou, Jiangxi Keyuan Bio-Material Co Ltd, Danimer Scientific.
3. What are the main segments of the Polylactic Acid Market?
The market segments include Raw Material, Form, End-user Industry.
4. Can you provide details about the market size?
The market size is estimated to be USD 2.01 billion as of 2022.
5. What are some drivers contributing to market growth?
Favorable Government Policies Promoting Bio-plastics; Other Drivers.
6. What are the notable trends driving market growth?
The Packaging Segment is Expected to Dominate the Market.
7. Are there any restraints impacting market growth?
High Price and Other Disadvantages; Other Restraints.
8. Can you provide examples of recent developments in the market?
September 2023: Danimer Scientific has announced its collaboration with Chevron Phillips Chemical to explore the development and commercialization of high-volume biodegradable plastic products using Danimer’s Rinnovo polymers. This partnership aims to boost the company’s profile of PLA-based bioplastic products in the market.
9. What pricing options are available for accessing the report?
Pricing options include single-user, multi-user, and enterprise licenses priced at USD 4750, USD 5250, and USD 8750 respectively.
10. Is the market size provided in terms of value or volume?
The market size is provided in terms of value, measured in billion and volume, measured in Million.
11. Are there any specific market keywords associated with the report?
Yes, the market keyword associated with the report is "Polylactic Acid Market," which aids in identifying and referencing the specific market segment covered.
12. How do I determine which pricing option suits my needs best?
The pricing options vary based on user requirements and access needs. Individual users may opt for single-user licenses, while businesses requiring broader access may choose multi-user or enterprise licenses for cost-effective access to the report.
13. Are there any additional resources or data provided in the Polylactic Acid Market report?
While the report offers comprehensive insights, it's advisable to review the specific contents or supplementary materials provided to ascertain if additional resources or data are available.
14. How can I stay updated on further developments or reports in the Polylactic Acid Market?
To stay informed about further developments, trends, and reports in the Polylactic Acid Market, consider subscribing to industry newsletters, following relevant companies and organizations, or regularly checking reputable industry news sources and publications.
Methodology
Step 1 - Identification of Relevant Samples Size from Population Database


Step 2 - Approaches for Defining Global Market Size (Value, Volume* & Price*)

Note*: In applicable scenarios
Step 3 - Data Sources
Primary Research
- Web Analytics
- Survey Reports
- Research Institute
- Latest Research Reports
- Opinion Leaders
Secondary Research
- Annual Reports
- White Paper
- Latest Press Release
- Industry Association
- Paid Database
- Investor Presentations

Step 4 - Data Triangulation
Involves using different sources of information in order to increase the validity of a study
These sources are likely to be stakeholders in a program - participants, other researchers, program staff, other community members, and so on.
Then we put all data in single framework & apply various statistical tools to find out the dynamic on the market.
During the analysis stage, feedback from the stakeholder groups would be compared to determine areas of agreement as well as areas of divergence