

Key Insights
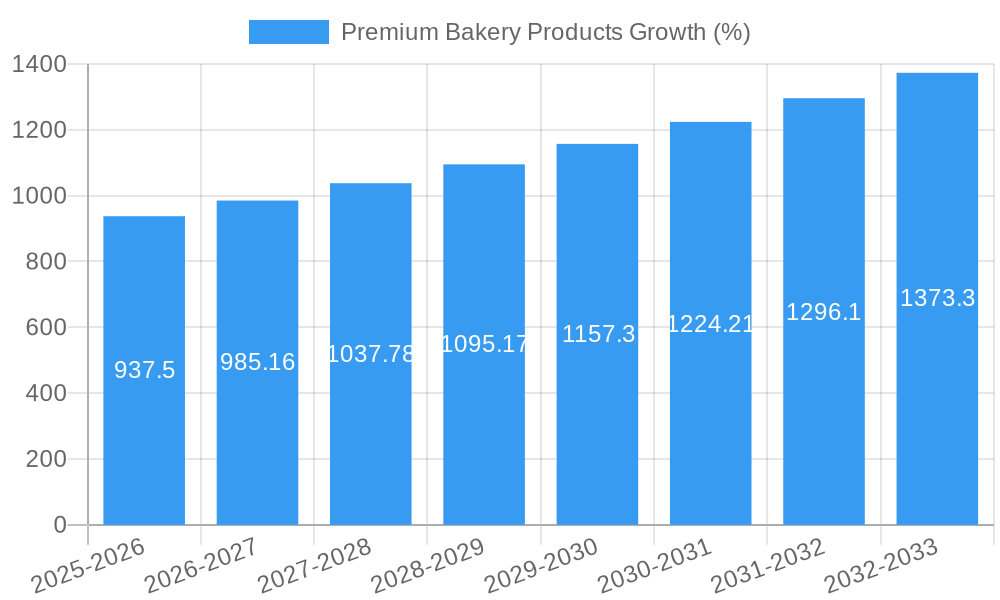
The premium bakery products market, encompassing breads, cookies, biscuits, morning goods, cakes, and pastries, is experiencing robust growth, projected to maintain a 6.25% CAGR from 2025 to 2033. This expansion is fueled by several key factors. Increasing consumer disposable incomes, particularly in developing economies within Asia-Pacific and South America, are driving demand for premium, higher-quality baked goods. The rise of health-conscious consumers is also impacting the market, with a surge in demand for products featuring organic ingredients, reduced sugar, and gluten-free options. Furthermore, the convenience factor offered by online retail channels is significantly contributing to market growth, supplementing traditional supermarket and specialty store sales. The market is segmented by product type and distribution channel, with supermarkets/hypermarkets currently holding the largest market share in terms of distribution. However, the online retail segment is showing the most significant growth potential. Leading players like Barilla, General Mills, and Mondelez are leveraging brand recognition and innovation to capture market share, while smaller, specialized bakeries are focusing on niche offerings to attract discerning consumers.
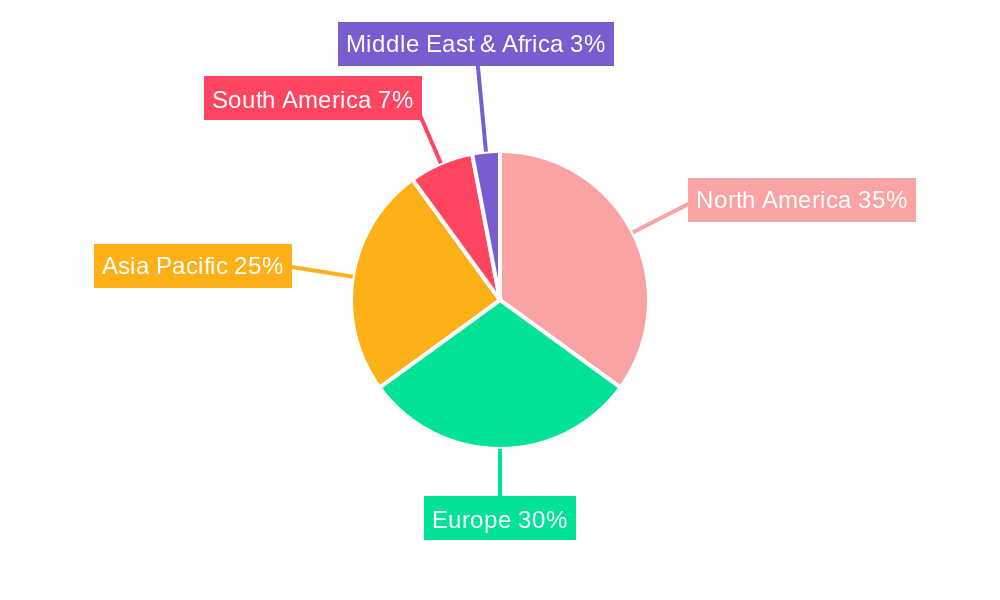
Competition within the premium bakery sector is fierce, with established multinational corporations competing against regional and local brands. The success of companies will depend on their ability to adapt to evolving consumer preferences, including the growing demand for sustainable and ethically sourced ingredients. Challenges facing the market include fluctuations in raw material costs (e.g., flour, sugar, butter) and increasing labor costs. However, strategic partnerships, product diversification, and targeted marketing campaigns are anticipated to mitigate these challenges and further propel market growth. Regional variations in consumer preferences will continue to shape market dynamics, with North America and Europe remaining dominant, but Asia-Pacific exhibiting significant growth potential due to rising purchasing power and changing dietary habits. The forecast for 2033 anticipates a substantial expansion of the premium bakery products market driven by continued consumer preference shifts and strategic industry maneuvers.
Premium Bakery Products Market Report: A Comprehensive Analysis (2019-2033)
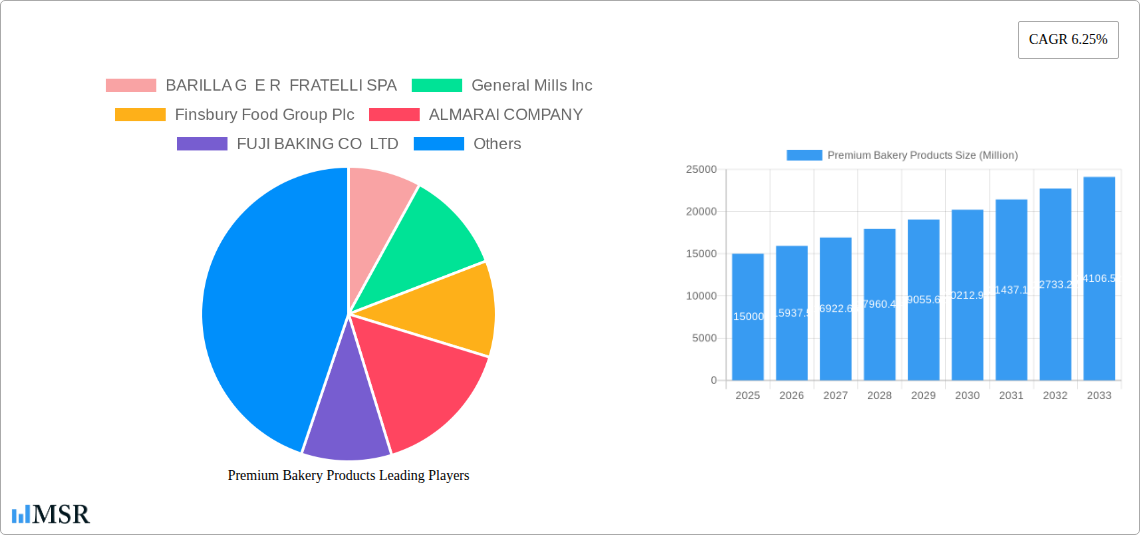
This comprehensive report provides an in-depth analysis of the global premium bakery products market, offering invaluable insights for industry stakeholders. With a study period spanning 2019-2033, a base year of 2025, and a forecast period of 2025-2033, this report examines market dynamics, leading players, and future growth opportunities. The market is segmented by product type (Breads, Cookies and Biscuits, Morning Goods, Cakes and Pastries, Others) and distribution channel (Supermarkets/Hypermarkets, Speciality stores, Online Retail Stores, Other Distribution Channels). The report analyzes key players such as BARILLA G E R FRATELLI SPA, General Mills Inc, Finsbury Food Group Plc, ALMARAI COMPANY, FUJI BAKING CO LTD, Associated British Foods plc, Mondelez International Inc, Bimbo Bakeries USA, Bakers Delight Holdings Limited, and Britannia Industries Ltd, among others. This detailed analysis projects a market valued at xx Million by 2025, exhibiting a CAGR of xx% during the forecast period.
Premium Bakery Products Market Concentration & Dynamics
The premium bakery products market exhibits a moderately concentrated landscape, with several multinational corporations holding significant market share. However, the presence of smaller, specialized bakeries and regional brands contributes to market diversity. Innovation is a key driver, with companies continuously introducing new product lines and flavors to meet evolving consumer preferences. Regulatory frameworks concerning food safety and labeling play a crucial role in shaping market dynamics. Substitute products, such as breakfast cereals or snack bars, exert competitive pressure. End-user trends, including health consciousness and demand for premium ingredients, influence product development and marketing strategies.
- Market Share: The top 5 players hold approximately xx% of the global market share (2024).
- M&A Activity: The past five years have witnessed xx major mergers and acquisitions in the premium bakery products sector. Key examples include Mondelez International’s acquisition of Chipita S.A. in 2021.
- Innovation Ecosystem: Strong R&D investments and collaborations with ingredient suppliers drive innovation in product formulations, packaging, and production processes.
Premium Bakery Products Industry Insights & Trends
The premium bakery products market is experiencing robust growth driven by several factors. Rising disposable incomes, particularly in developing economies, fuel consumer demand for premium food products. The shift towards healthier lifestyles has led to increased demand for products with natural ingredients and reduced sugar content. Technological advancements in baking processes, such as automation and precision fermentation, improve efficiency and product quality. Evolving consumer behaviors, such as increased online shopping and demand for personalized experiences, are reshaping distribution channels. The market size is estimated at xx Million in 2025, showcasing a significant growth trajectory.
Key Markets & Segments Leading Premium Bakery Products
The global premium bakery products market demonstrates strong regional variations. North America and Europe currently represent significant market shares, driven by high consumer spending and established distribution networks. However, Asia-Pacific exhibits the fastest growth rate, fueled by rising disposable incomes and increasing westernization of diets.
By Product Type:
- Cookies and Biscuits: This segment holds a leading market share, driven by strong consumer demand and product innovation.
- Cakes and Pastries: This segment showcases significant growth potential, driven by increasing demand for premium desserts and specialty items.
By Distribution Channel:
- Supermarkets/Hypermarkets: This channel remains dominant due to its wide reach and established infrastructure.
- Online Retail Stores: This channel demonstrates rapid growth, facilitated by increased internet penetration and e-commerce adoption.
Drivers:
- Economic Growth: Rising disposable incomes in emerging markets stimulate demand for premium bakery products.
- Infrastructure Development: Improved cold chain infrastructure supports efficient distribution of perishable bakery items.
Premium Bakery Products Product Developments
Recent product innovations focus on clean label ingredients, functional benefits (e.g., high fiber, high protein), and unique flavors. Technological advancements such as 3D printing and automated baking systems enhance product customization and production efficiency. These innovations offer competitive advantages through enhanced product quality, improved shelf life, and reduced production costs.
Challenges in the Premium Bakery Products Market
The premium bakery products market faces several challenges including fluctuating raw material prices, stringent food safety regulations, and intense competition. Supply chain disruptions, such as those caused by geopolitical events, can significantly impact production and distribution. Maintaining a balance between premium pricing and consumer affordability remains crucial.
Forces Driving Premium Bakery Products Growth
Several key drivers are propelling the growth of the premium bakery products market. These include rising disposable incomes, increasing demand for convenience foods, and the expansion of organized retail. Technological advancements in processing and packaging also contribute to growth. Government initiatives promoting food safety and quality further enhance market expansion.
Long-Term Growth Catalysts in Premium Bakery Products
Long-term growth will be fueled by continuous innovation in product development, expanding partnerships with food retailers, and strategic market expansion into emerging economies. Focus on sustainable practices and eco-friendly packaging will resonate with increasingly environmentally-conscious consumers.
Emerging Opportunities in Premium Bakery Products
Emerging opportunities lie in the development of niche products catering to specific dietary needs (e.g., gluten-free, vegan) and preferences. Leveraging online marketing channels and personalized product offerings will further expand market reach and customer engagement. Expanding into emerging markets presents significant growth potential.
Leading Players in the Premium Bakery Products Sector
- BARILLA G E R FRATELLI SPA
- General Mills Inc
- Finsbury Food Group Plc
- ALMARAI COMPANY
- FUJI BAKING CO LTD
- Associated British Foods plc
- Mondelez International Inc
- Bimbo Bakeries USA
- Bakers Delight Holdings Limited
- Britannia Industries Ltd
Key Milestones in Premium Bakery Products Industry
- April 2022: Walker's Shortbread partners with Dufry for a global travel retailer range launch.
- April 2022: Burton's Biscuit Company merges with Fox's Biscuits.
- May 2021: Mondelez International acquires Chipita S.A. for approximately USD 2 Billion.
Strategic Outlook for Premium Bakery Products Market
The premium bakery products market is poised for significant growth in the coming years, driven by innovation, evolving consumer preferences, and expanding distribution channels. Companies that invest in R&D, embrace sustainable practices, and strategically target emerging markets will be well-positioned to capitalize on future opportunities. The focus on health and wellness will continue to shape product development, with increasing demand for healthier, natural ingredients and functional products.
Premium Bakery Products Segmentation
-
1. Product Type
- 1.1. Breads
- 1.2. Cookies and Biscuits
- 1.3. Morning Goods
- 1.4. Cakes and Pastries
- 1.5. others
-
2. Distibution Channel
- 2.1. Supermarkets/Hypermarkets
- 2.2. Speciality stores
- 2.3. Online Retail Stores
- 2.4. Other Distribution Channels
Premium Bakery Products Segmentation By Geography
-
1. North America
- 1.1. United States
- 1.2. Canada
- 1.3. Mexico
- 1.4. Rest of North America
-
2. Europe
- 2.1. United Kingdom
- 2.2. Germany
- 2.3. Spain
- 2.4. France
- 2.5. Italy
- 2.6. Russia
- 2.7. Rest of Europe
-
3. Asia Pacific
- 3.1. China
- 3.2. Japan
- 3.3. India
- 3.4. Australia
- 3.5. Rest of Asia Pacific
-
4. South America
- 4.1. Brazil
- 4.2. Argentina
- 4.3. Rest of South America
- 5. Middle East
-
6. Saudi Arabia
- 6.1. South Africa
- 6.2. Rest of Middle East
Premium Bakery Products REPORT HIGHLIGHTS
| Aspects | Details |
|---|---|
| Study Period | 2019-2033 |
| Base Year | 2024 |
| Estimated Year | 2025 |
| Forecast Period | 2025-2033 |
| Historical Period | 2019-2024 |
| Growth Rate | CAGR of 6.25% from 2019-2033 |
| Segmentation |
|
Table of Contents
- 1. Introduction
- 1.1. Research Scope
- 1.2. Market Segmentation
- 1.3. Research Methodology
- 1.4. Definitions and Assumptions
- 2. Executive Summary
- 2.1. Introduction
- 3. Market Dynamics
- 3.1. Introduction
- 3.2. Market Drivers
- 3.2.1. Innovation in Vanillin Synthesis; Diverse Functionality of Vanillin In End-use Industries
- 3.3. Market Restrains
- 3.3.1. Supply Chain Variability Impacting Vanilla Bean Availability For Flavor Production
- 3.4. Market Trends
- 3.4.1. Rising demand for premium healthy snacking options is driving the market
- 4. Market Factor Analysis
- 4.1. Porters Five Forces
- 4.2. Supply/Value Chain
- 4.3. PESTEL analysis
- 4.4. Market Entropy
- 4.5. Patent/Trademark Analysis
- 5. Global Premium Bakery Products Analysis, Insights and Forecast, 2019-2031
- 5.1. Market Analysis, Insights and Forecast - by Product Type
- 5.1.1. Breads
- 5.1.2. Cookies and Biscuits
- 5.1.3. Morning Goods
- 5.1.4. Cakes and Pastries
- 5.1.5. others
- 5.2. Market Analysis, Insights and Forecast - by Distibution Channel
- 5.2.1. Supermarkets/Hypermarkets
- 5.2.2. Speciality stores
- 5.2.3. Online Retail Stores
- 5.2.4. Other Distribution Channels
- 5.3. Market Analysis, Insights and Forecast - by Region
- 5.3.1. North America
- 5.3.2. Europe
- 5.3.3. Asia Pacific
- 5.3.4. South America
- 5.3.5. Middle East
- 5.3.6. Saudi Arabia
- 5.1. Market Analysis, Insights and Forecast - by Product Type
- 6. North America Premium Bakery Products Analysis, Insights and Forecast, 2019-2031
- 6.1. Market Analysis, Insights and Forecast - by Product Type
- 6.1.1. Breads
- 6.1.2. Cookies and Biscuits
- 6.1.3. Morning Goods
- 6.1.4. Cakes and Pastries
- 6.1.5. others
- 6.2. Market Analysis, Insights and Forecast - by Distibution Channel
- 6.2.1. Supermarkets/Hypermarkets
- 6.2.2. Speciality stores
- 6.2.3. Online Retail Stores
- 6.2.4. Other Distribution Channels
- 6.1. Market Analysis, Insights and Forecast - by Product Type
- 7. Europe Premium Bakery Products Analysis, Insights and Forecast, 2019-2031
- 7.1. Market Analysis, Insights and Forecast - by Product Type
- 7.1.1. Breads
- 7.1.2. Cookies and Biscuits
- 7.1.3. Morning Goods
- 7.1.4. Cakes and Pastries
- 7.1.5. others
- 7.2. Market Analysis, Insights and Forecast - by Distibution Channel
- 7.2.1. Supermarkets/Hypermarkets
- 7.2.2. Speciality stores
- 7.2.3. Online Retail Stores
- 7.2.4. Other Distribution Channels
- 7.1. Market Analysis, Insights and Forecast - by Product Type
- 8. Asia Pacific Premium Bakery Products Analysis, Insights and Forecast, 2019-2031
- 8.1. Market Analysis, Insights and Forecast - by Product Type
- 8.1.1. Breads
- 8.1.2. Cookies and Biscuits
- 8.1.3. Morning Goods
- 8.1.4. Cakes and Pastries
- 8.1.5. others
- 8.2. Market Analysis, Insights and Forecast - by Distibution Channel
- 8.2.1. Supermarkets/Hypermarkets
- 8.2.2. Speciality stores
- 8.2.3. Online Retail Stores
- 8.2.4. Other Distribution Channels
- 8.1. Market Analysis, Insights and Forecast - by Product Type
- 9. South America Premium Bakery Products Analysis, Insights and Forecast, 2019-2031
- 9.1. Market Analysis, Insights and Forecast - by Product Type
- 9.1.1. Breads
- 9.1.2. Cookies and Biscuits
- 9.1.3. Morning Goods
- 9.1.4. Cakes and Pastries
- 9.1.5. others
- 9.2. Market Analysis, Insights and Forecast - by Distibution Channel
- 9.2.1. Supermarkets/Hypermarkets
- 9.2.2. Speciality stores
- 9.2.3. Online Retail Stores
- 9.2.4. Other Distribution Channels
- 9.1. Market Analysis, Insights and Forecast - by Product Type
- 10. Middle East Premium Bakery Products Analysis, Insights and Forecast, 2019-2031
- 10.1. Market Analysis, Insights and Forecast - by Product Type
- 10.1.1. Breads
- 10.1.2. Cookies and Biscuits
- 10.1.3. Morning Goods
- 10.1.4. Cakes and Pastries
- 10.1.5. others
- 10.2. Market Analysis, Insights and Forecast - by Distibution Channel
- 10.2.1. Supermarkets/Hypermarkets
- 10.2.2. Speciality stores
- 10.2.3. Online Retail Stores
- 10.2.4. Other Distribution Channels
- 10.1. Market Analysis, Insights and Forecast - by Product Type
- 11. Saudi Arabia Premium Bakery Products Analysis, Insights and Forecast, 2019-2031
- 11.1. Market Analysis, Insights and Forecast - by Product Type
- 11.1.1. Breads
- 11.1.2. Cookies and Biscuits
- 11.1.3. Morning Goods
- 11.1.4. Cakes and Pastries
- 11.1.5. others
- 11.2. Market Analysis, Insights and Forecast - by Distibution Channel
- 11.2.1. Supermarkets/Hypermarkets
- 11.2.2. Speciality stores
- 11.2.3. Online Retail Stores
- 11.2.4. Other Distribution Channels
- 11.1. Market Analysis, Insights and Forecast - by Product Type
- 12. North America Premium Bakery Products Analysis, Insights and Forecast, 2019-2031
- 12.1. Market Analysis, Insights and Forecast - By Country/Sub-region
- 12.1.1 United States
- 12.1.2 Canada
- 12.1.3 Mexico
- 12.1.4 Rest of North America
- 13. Europe Premium Bakery Products Analysis, Insights and Forecast, 2019-2031
- 13.1. Market Analysis, Insights and Forecast - By Country/Sub-region
- 13.1.1 United Kingdom
- 13.1.2 Germany
- 13.1.3 Spain
- 13.1.4 France
- 13.1.5 Italy
- 13.1.6 Russia
- 13.1.7 Rest of Europe
- 14. Asia Pacific Premium Bakery Products Analysis, Insights and Forecast, 2019-2031
- 14.1. Market Analysis, Insights and Forecast - By Country/Sub-region
- 14.1.1 China
- 14.1.2 Japan
- 14.1.3 India
- 14.1.4 Australia
- 14.1.5 Rest of Asia Pacific
- 15. South America Premium Bakery Products Analysis, Insights and Forecast, 2019-2031
- 15.1. Market Analysis, Insights and Forecast - By Country/Sub-region
- 15.1.1 Brazil
- 15.1.2 Argentina
- 15.1.3 Rest of South America
- 16. Middle East & Africa Premium Bakery Products Analysis, Insights and Forecast, 2019-2031
- 16.1. Market Analysis, Insights and Forecast - By Country/Sub-region
- 16.1.1 UAE
- 16.1.2 South Africa
- 16.1.3 Saudi Arabia
- 16.1.4 Rest of MEA
- 17. Competitive Analysis
- 17.1. Global Market Share Analysis 2024
- 17.2. Company Profiles
- 17.2.1 BARILLA G E R FRATELLI SPA
- 17.2.1.1. Overview
- 17.2.1.2. Products
- 17.2.1.3. SWOT Analysis
- 17.2.1.4. Recent Developments
- 17.2.1.5. Financials (Based on Availability)
- 17.2.2 General Mills Inc
- 17.2.2.1. Overview
- 17.2.2.2. Products
- 17.2.2.3. SWOT Analysis
- 17.2.2.4. Recent Developments
- 17.2.2.5. Financials (Based on Availability)
- 17.2.3 Finsbury Food Group Plc
- 17.2.3.1. Overview
- 17.2.3.2. Products
- 17.2.3.3. SWOT Analysis
- 17.2.3.4. Recent Developments
- 17.2.3.5. Financials (Based on Availability)
- 17.2.4 ALMARAI COMPANY
- 17.2.4.1. Overview
- 17.2.4.2. Products
- 17.2.4.3. SWOT Analysis
- 17.2.4.4. Recent Developments
- 17.2.4.5. Financials (Based on Availability)
- 17.2.5 FUJI BAKING CO LTD
- 17.2.5.1. Overview
- 17.2.5.2. Products
- 17.2.5.3. SWOT Analysis
- 17.2.5.4. Recent Developments
- 17.2.5.5. Financials (Based on Availability)
- 17.2.6 Associated British Foods plc
- 17.2.6.1. Overview
- 17.2.6.2. Products
- 17.2.6.3. SWOT Analysis
- 17.2.6.4. Recent Developments
- 17.2.6.5. Financials (Based on Availability)
- 17.2.7 Mondelez International Inc
- 17.2.7.1. Overview
- 17.2.7.2. Products
- 17.2.7.3. SWOT Analysis
- 17.2.7.4. Recent Developments
- 17.2.7.5. Financials (Based on Availability)
- 17.2.8 Bimbo Bakeries USA
- 17.2.8.1. Overview
- 17.2.8.2. Products
- 17.2.8.3. SWOT Analysis
- 17.2.8.4. Recent Developments
- 17.2.8.5. Financials (Based on Availability)
- 17.2.9 Bakers Delight Holdings Limited
- 17.2.9.1. Overview
- 17.2.9.2. Products
- 17.2.9.3. SWOT Analysis
- 17.2.9.4. Recent Developments
- 17.2.9.5. Financials (Based on Availability)
- 17.2.10 Britannia Industries Ltd*List Not Exhaustive
- 17.2.10.1. Overview
- 17.2.10.2. Products
- 17.2.10.3. SWOT Analysis
- 17.2.10.4. Recent Developments
- 17.2.10.5. Financials (Based on Availability)
- 17.2.1 BARILLA G E R FRATELLI SPA
List of Figures
- Figure 1: Global Premium Bakery Products Revenue Breakdown (Million, %) by Region 2024 & 2032
- Figure 2: Global Premium Bakery Products Volume Breakdown (K Tons, %) by Region 2024 & 2032
- Figure 3: North America Premium Bakery Products Revenue (Million), by Country 2024 & 2032
- Figure 4: North America Premium Bakery Products Volume (K Tons), by Country 2024 & 2032
- Figure 5: North America Premium Bakery Products Revenue Share (%), by Country 2024 & 2032
- Figure 6: North America Premium Bakery Products Volume Share (%), by Country 2024 & 2032
- Figure 7: Europe Premium Bakery Products Revenue (Million), by Country 2024 & 2032
- Figure 8: Europe Premium Bakery Products Volume (K Tons), by Country 2024 & 2032
- Figure 9: Europe Premium Bakery Products Revenue Share (%), by Country 2024 & 2032
- Figure 10: Europe Premium Bakery Products Volume Share (%), by Country 2024 & 2032
- Figure 11: Asia Pacific Premium Bakery Products Revenue (Million), by Country 2024 & 2032
- Figure 12: Asia Pacific Premium Bakery Products Volume (K Tons), by Country 2024 & 2032
- Figure 13: Asia Pacific Premium Bakery Products Revenue Share (%), by Country 2024 & 2032
- Figure 14: Asia Pacific Premium Bakery Products Volume Share (%), by Country 2024 & 2032
- Figure 15: South America Premium Bakery Products Revenue (Million), by Country 2024 & 2032
- Figure 16: South America Premium Bakery Products Volume (K Tons), by Country 2024 & 2032
- Figure 17: South America Premium Bakery Products Revenue Share (%), by Country 2024 & 2032
- Figure 18: South America Premium Bakery Products Volume Share (%), by Country 2024 & 2032
- Figure 19: Middle East & Africa Premium Bakery Products Revenue (Million), by Country 2024 & 2032
- Figure 20: Middle East & Africa Premium Bakery Products Volume (K Tons), by Country 2024 & 2032
- Figure 21: Middle East & Africa Premium Bakery Products Revenue Share (%), by Country 2024 & 2032
- Figure 22: Middle East & Africa Premium Bakery Products Volume Share (%), by Country 2024 & 2032
- Figure 23: North America Premium Bakery Products Revenue (Million), by Product Type 2024 & 2032
- Figure 24: North America Premium Bakery Products Volume (K Tons), by Product Type 2024 & 2032
- Figure 25: North America Premium Bakery Products Revenue Share (%), by Product Type 2024 & 2032
- Figure 26: North America Premium Bakery Products Volume Share (%), by Product Type 2024 & 2032
- Figure 27: North America Premium Bakery Products Revenue (Million), by Distibution Channel 2024 & 2032
- Figure 28: North America Premium Bakery Products Volume (K Tons), by Distibution Channel 2024 & 2032
- Figure 29: North America Premium Bakery Products Revenue Share (%), by Distibution Channel 2024 & 2032
- Figure 30: North America Premium Bakery Products Volume Share (%), by Distibution Channel 2024 & 2032
- Figure 31: North America Premium Bakery Products Revenue (Million), by Country 2024 & 2032
- Figure 32: North America Premium Bakery Products Volume (K Tons), by Country 2024 & 2032
- Figure 33: North America Premium Bakery Products Revenue Share (%), by Country 2024 & 2032
- Figure 34: North America Premium Bakery Products Volume Share (%), by Country 2024 & 2032
- Figure 35: Europe Premium Bakery Products Revenue (Million), by Product Type 2024 & 2032
- Figure 36: Europe Premium Bakery Products Volume (K Tons), by Product Type 2024 & 2032
- Figure 37: Europe Premium Bakery Products Revenue Share (%), by Product Type 2024 & 2032
- Figure 38: Europe Premium Bakery Products Volume Share (%), by Product Type 2024 & 2032
- Figure 39: Europe Premium Bakery Products Revenue (Million), by Distibution Channel 2024 & 2032
- Figure 40: Europe Premium Bakery Products Volume (K Tons), by Distibution Channel 2024 & 2032
- Figure 41: Europe Premium Bakery Products Revenue Share (%), by Distibution Channel 2024 & 2032
- Figure 42: Europe Premium Bakery Products Volume Share (%), by Distibution Channel 2024 & 2032
- Figure 43: Europe Premium Bakery Products Revenue (Million), by Country 2024 & 2032
- Figure 44: Europe Premium Bakery Products Volume (K Tons), by Country 2024 & 2032
- Figure 45: Europe Premium Bakery Products Revenue Share (%), by Country 2024 & 2032
- Figure 46: Europe Premium Bakery Products Volume Share (%), by Country 2024 & 2032
- Figure 47: Asia Pacific Premium Bakery Products Revenue (Million), by Product Type 2024 & 2032
- Figure 48: Asia Pacific Premium Bakery Products Volume (K Tons), by Product Type 2024 & 2032
- Figure 49: Asia Pacific Premium Bakery Products Revenue Share (%), by Product Type 2024 & 2032
- Figure 50: Asia Pacific Premium Bakery Products Volume Share (%), by Product Type 2024 & 2032
- Figure 51: Asia Pacific Premium Bakery Products Revenue (Million), by Distibution Channel 2024 & 2032
- Figure 52: Asia Pacific Premium Bakery Products Volume (K Tons), by Distibution Channel 2024 & 2032
- Figure 53: Asia Pacific Premium Bakery Products Revenue Share (%), by Distibution Channel 2024 & 2032
- Figure 54: Asia Pacific Premium Bakery Products Volume Share (%), by Distibution Channel 2024 & 2032
- Figure 55: Asia Pacific Premium Bakery Products Revenue (Million), by Country 2024 & 2032
- Figure 56: Asia Pacific Premium Bakery Products Volume (K Tons), by Country 2024 & 2032
- Figure 57: Asia Pacific Premium Bakery Products Revenue Share (%), by Country 2024 & 2032
- Figure 58: Asia Pacific Premium Bakery Products Volume Share (%), by Country 2024 & 2032
- Figure 59: South America Premium Bakery Products Revenue (Million), by Product Type 2024 & 2032
- Figure 60: South America Premium Bakery Products Volume (K Tons), by Product Type 2024 & 2032
- Figure 61: South America Premium Bakery Products Revenue Share (%), by Product Type 2024 & 2032
- Figure 62: South America Premium Bakery Products Volume Share (%), by Product Type 2024 & 2032
- Figure 63: South America Premium Bakery Products Revenue (Million), by Distibution Channel 2024 & 2032
- Figure 64: South America Premium Bakery Products Volume (K Tons), by Distibution Channel 2024 & 2032
- Figure 65: South America Premium Bakery Products Revenue Share (%), by Distibution Channel 2024 & 2032
- Figure 66: South America Premium Bakery Products Volume Share (%), by Distibution Channel 2024 & 2032
- Figure 67: South America Premium Bakery Products Revenue (Million), by Country 2024 & 2032
- Figure 68: South America Premium Bakery Products Volume (K Tons), by Country 2024 & 2032
- Figure 69: South America Premium Bakery Products Revenue Share (%), by Country 2024 & 2032
- Figure 70: South America Premium Bakery Products Volume Share (%), by Country 2024 & 2032
- Figure 71: Middle East Premium Bakery Products Revenue (Million), by Product Type 2024 & 2032
- Figure 72: Middle East Premium Bakery Products Volume (K Tons), by Product Type 2024 & 2032
- Figure 73: Middle East Premium Bakery Products Revenue Share (%), by Product Type 2024 & 2032
- Figure 74: Middle East Premium Bakery Products Volume Share (%), by Product Type 2024 & 2032
- Figure 75: Middle East Premium Bakery Products Revenue (Million), by Distibution Channel 2024 & 2032
- Figure 76: Middle East Premium Bakery Products Volume (K Tons), by Distibution Channel 2024 & 2032
- Figure 77: Middle East Premium Bakery Products Revenue Share (%), by Distibution Channel 2024 & 2032
- Figure 78: Middle East Premium Bakery Products Volume Share (%), by Distibution Channel 2024 & 2032
- Figure 79: Middle East Premium Bakery Products Revenue (Million), by Country 2024 & 2032
- Figure 80: Middle East Premium Bakery Products Volume (K Tons), by Country 2024 & 2032
- Figure 81: Middle East Premium Bakery Products Revenue Share (%), by Country 2024 & 2032
- Figure 82: Middle East Premium Bakery Products Volume Share (%), by Country 2024 & 2032
- Figure 83: Saudi Arabia Premium Bakery Products Revenue (Million), by Product Type 2024 & 2032
- Figure 84: Saudi Arabia Premium Bakery Products Volume (K Tons), by Product Type 2024 & 2032
- Figure 85: Saudi Arabia Premium Bakery Products Revenue Share (%), by Product Type 2024 & 2032
- Figure 86: Saudi Arabia Premium Bakery Products Volume Share (%), by Product Type 2024 & 2032
- Figure 87: Saudi Arabia Premium Bakery Products Revenue (Million), by Distibution Channel 2024 & 2032
- Figure 88: Saudi Arabia Premium Bakery Products Volume (K Tons), by Distibution Channel 2024 & 2032
- Figure 89: Saudi Arabia Premium Bakery Products Revenue Share (%), by Distibution Channel 2024 & 2032
- Figure 90: Saudi Arabia Premium Bakery Products Volume Share (%), by Distibution Channel 2024 & 2032
- Figure 91: Saudi Arabia Premium Bakery Products Revenue (Million), by Country 2024 & 2032
- Figure 92: Saudi Arabia Premium Bakery Products Volume (K Tons), by Country 2024 & 2032
- Figure 93: Saudi Arabia Premium Bakery Products Revenue Share (%), by Country 2024 & 2032
- Figure 94: Saudi Arabia Premium Bakery Products Volume Share (%), by Country 2024 & 2032
List of Tables
- Table 1: Global Premium Bakery Products Revenue Million Forecast, by Region 2019 & 2032
- Table 2: Global Premium Bakery Products Volume K Tons Forecast, by Region 2019 & 2032
- Table 3: Global Premium Bakery Products Revenue Million Forecast, by Product Type 2019 & 2032
- Table 4: Global Premium Bakery Products Volume K Tons Forecast, by Product Type 2019 & 2032
- Table 5: Global Premium Bakery Products Revenue Million Forecast, by Distibution Channel 2019 & 2032
- Table 6: Global Premium Bakery Products Volume K Tons Forecast, by Distibution Channel 2019 & 2032
- Table 7: Global Premium Bakery Products Revenue Million Forecast, by Region 2019 & 2032
- Table 8: Global Premium Bakery Products Volume K Tons Forecast, by Region 2019 & 2032
- Table 9: Global Premium Bakery Products Revenue Million Forecast, by Country 2019 & 2032
- Table 10: Global Premium Bakery Products Volume K Tons Forecast, by Country 2019 & 2032
- Table 11: United States Premium Bakery Products Revenue (Million) Forecast, by Application 2019 & 2032
- Table 12: United States Premium Bakery Products Volume (K Tons) Forecast, by Application 2019 & 2032
- Table 13: Canada Premium Bakery Products Revenue (Million) Forecast, by Application 2019 & 2032
- Table 14: Canada Premium Bakery Products Volume (K Tons) Forecast, by Application 2019 & 2032
- Table 15: Mexico Premium Bakery Products Revenue (Million) Forecast, by Application 2019 & 2032
- Table 16: Mexico Premium Bakery Products Volume (K Tons) Forecast, by Application 2019 & 2032
- Table 17: Rest of North America Premium Bakery Products Revenue (Million) Forecast, by Application 2019 & 2032
- Table 18: Rest of North America Premium Bakery Products Volume (K Tons) Forecast, by Application 2019 & 2032
- Table 19: Global Premium Bakery Products Revenue Million Forecast, by Country 2019 & 2032
- Table 20: Global Premium Bakery Products Volume K Tons Forecast, by Country 2019 & 2032
- Table 21: United Kingdom Premium Bakery Products Revenue (Million) Forecast, by Application 2019 & 2032
- Table 22: United Kingdom Premium Bakery Products Volume (K Tons) Forecast, by Application 2019 & 2032
- Table 23: Germany Premium Bakery Products Revenue (Million) Forecast, by Application 2019 & 2032
- Table 24: Germany Premium Bakery Products Volume (K Tons) Forecast, by Application 2019 & 2032
- Table 25: Spain Premium Bakery Products Revenue (Million) Forecast, by Application 2019 & 2032
- Table 26: Spain Premium Bakery Products Volume (K Tons) Forecast, by Application 2019 & 2032
- Table 27: France Premium Bakery Products Revenue (Million) Forecast, by Application 2019 & 2032
- Table 28: France Premium Bakery Products Volume (K Tons) Forecast, by Application 2019 & 2032
- Table 29: Italy Premium Bakery Products Revenue (Million) Forecast, by Application 2019 & 2032
- Table 30: Italy Premium Bakery Products Volume (K Tons) Forecast, by Application 2019 & 2032
- Table 31: Russia Premium Bakery Products Revenue (Million) Forecast, by Application 2019 & 2032
- Table 32: Russia Premium Bakery Products Volume (K Tons) Forecast, by Application 2019 & 2032
- Table 33: Rest of Europe Premium Bakery Products Revenue (Million) Forecast, by Application 2019 & 2032
- Table 34: Rest of Europe Premium Bakery Products Volume (K Tons) Forecast, by Application 2019 & 2032
- Table 35: Global Premium Bakery Products Revenue Million Forecast, by Country 2019 & 2032
- Table 36: Global Premium Bakery Products Volume K Tons Forecast, by Country 2019 & 2032
- Table 37: China Premium Bakery Products Revenue (Million) Forecast, by Application 2019 & 2032
- Table 38: China Premium Bakery Products Volume (K Tons) Forecast, by Application 2019 & 2032
- Table 39: Japan Premium Bakery Products Revenue (Million) Forecast, by Application 2019 & 2032
- Table 40: Japan Premium Bakery Products Volume (K Tons) Forecast, by Application 2019 & 2032
- Table 41: India Premium Bakery Products Revenue (Million) Forecast, by Application 2019 & 2032
- Table 42: India Premium Bakery Products Volume (K Tons) Forecast, by Application 2019 & 2032
- Table 43: Australia Premium Bakery Products Revenue (Million) Forecast, by Application 2019 & 2032
- Table 44: Australia Premium Bakery Products Volume (K Tons) Forecast, by Application 2019 & 2032
- Table 45: Rest of Asia Pacific Premium Bakery Products Revenue (Million) Forecast, by Application 2019 & 2032
- Table 46: Rest of Asia Pacific Premium Bakery Products Volume (K Tons) Forecast, by Application 2019 & 2032
- Table 47: Global Premium Bakery Products Revenue Million Forecast, by Country 2019 & 2032
- Table 48: Global Premium Bakery Products Volume K Tons Forecast, by Country 2019 & 2032
- Table 49: Brazil Premium Bakery Products Revenue (Million) Forecast, by Application 2019 & 2032
- Table 50: Brazil Premium Bakery Products Volume (K Tons) Forecast, by Application 2019 & 2032
- Table 51: Argentina Premium Bakery Products Revenue (Million) Forecast, by Application 2019 & 2032
- Table 52: Argentina Premium Bakery Products Volume (K Tons) Forecast, by Application 2019 & 2032
- Table 53: Rest of South America Premium Bakery Products Revenue (Million) Forecast, by Application 2019 & 2032
- Table 54: Rest of South America Premium Bakery Products Volume (K Tons) Forecast, by Application 2019 & 2032
- Table 55: Global Premium Bakery Products Revenue Million Forecast, by Country 2019 & 2032
- Table 56: Global Premium Bakery Products Volume K Tons Forecast, by Country 2019 & 2032
- Table 57: UAE Premium Bakery Products Revenue (Million) Forecast, by Application 2019 & 2032
- Table 58: UAE Premium Bakery Products Volume (K Tons) Forecast, by Application 2019 & 2032
- Table 59: South Africa Premium Bakery Products Revenue (Million) Forecast, by Application 2019 & 2032
- Table 60: South Africa Premium Bakery Products Volume (K Tons) Forecast, by Application 2019 & 2032
- Table 61: Saudi Arabia Premium Bakery Products Revenue (Million) Forecast, by Application 2019 & 2032
- Table 62: Saudi Arabia Premium Bakery Products Volume (K Tons) Forecast, by Application 2019 & 2032
- Table 63: Rest of MEA Premium Bakery Products Revenue (Million) Forecast, by Application 2019 & 2032
- Table 64: Rest of MEA Premium Bakery Products Volume (K Tons) Forecast, by Application 2019 & 2032
- Table 65: Global Premium Bakery Products Revenue Million Forecast, by Product Type 2019 & 2032
- Table 66: Global Premium Bakery Products Volume K Tons Forecast, by Product Type 2019 & 2032
- Table 67: Global Premium Bakery Products Revenue Million Forecast, by Distibution Channel 2019 & 2032
- Table 68: Global Premium Bakery Products Volume K Tons Forecast, by Distibution Channel 2019 & 2032
- Table 69: Global Premium Bakery Products Revenue Million Forecast, by Country 2019 & 2032
- Table 70: Global Premium Bakery Products Volume K Tons Forecast, by Country 2019 & 2032
- Table 71: United States Premium Bakery Products Revenue (Million) Forecast, by Application 2019 & 2032
- Table 72: United States Premium Bakery Products Volume (K Tons) Forecast, by Application 2019 & 2032
- Table 73: Canada Premium Bakery Products Revenue (Million) Forecast, by Application 2019 & 2032
- Table 74: Canada Premium Bakery Products Volume (K Tons) Forecast, by Application 2019 & 2032
- Table 75: Mexico Premium Bakery Products Revenue (Million) Forecast, by Application 2019 & 2032
- Table 76: Mexico Premium Bakery Products Volume (K Tons) Forecast, by Application 2019 & 2032
- Table 77: Rest of North America Premium Bakery Products Revenue (Million) Forecast, by Application 2019 & 2032
- Table 78: Rest of North America Premium Bakery Products Volume (K Tons) Forecast, by Application 2019 & 2032
- Table 79: Global Premium Bakery Products Revenue Million Forecast, by Product Type 2019 & 2032
- Table 80: Global Premium Bakery Products Volume K Tons Forecast, by Product Type 2019 & 2032
- Table 81: Global Premium Bakery Products Revenue Million Forecast, by Distibution Channel 2019 & 2032
- Table 82: Global Premium Bakery Products Volume K Tons Forecast, by Distibution Channel 2019 & 2032
- Table 83: Global Premium Bakery Products Revenue Million Forecast, by Country 2019 & 2032
- Table 84: Global Premium Bakery Products Volume K Tons Forecast, by Country 2019 & 2032
- Table 85: United Kingdom Premium Bakery Products Revenue (Million) Forecast, by Application 2019 & 2032
- Table 86: United Kingdom Premium Bakery Products Volume (K Tons) Forecast, by Application 2019 & 2032
- Table 87: Germany Premium Bakery Products Revenue (Million) Forecast, by Application 2019 & 2032
- Table 88: Germany Premium Bakery Products Volume (K Tons) Forecast, by Application 2019 & 2032
- Table 89: Spain Premium Bakery Products Revenue (Million) Forecast, by Application 2019 & 2032
- Table 90: Spain Premium Bakery Products Volume (K Tons) Forecast, by Application 2019 & 2032
- Table 91: France Premium Bakery Products Revenue (Million) Forecast, by Application 2019 & 2032
- Table 92: France Premium Bakery Products Volume (K Tons) Forecast, by Application 2019 & 2032
- Table 93: Italy Premium Bakery Products Revenue (Million) Forecast, by Application 2019 & 2032
- Table 94: Italy Premium Bakery Products Volume (K Tons) Forecast, by Application 2019 & 2032
- Table 95: Russia Premium Bakery Products Revenue (Million) Forecast, by Application 2019 & 2032
- Table 96: Russia Premium Bakery Products Volume (K Tons) Forecast, by Application 2019 & 2032
- Table 97: Rest of Europe Premium Bakery Products Revenue (Million) Forecast, by Application 2019 & 2032
- Table 98: Rest of Europe Premium Bakery Products Volume (K Tons) Forecast, by Application 2019 & 2032
- Table 99: Global Premium Bakery Products Revenue Million Forecast, by Product Type 2019 & 2032
- Table 100: Global Premium Bakery Products Volume K Tons Forecast, by Product Type 2019 & 2032
- Table 101: Global Premium Bakery Products Revenue Million Forecast, by Distibution Channel 2019 & 2032
- Table 102: Global Premium Bakery Products Volume K Tons Forecast, by Distibution Channel 2019 & 2032
- Table 103: Global Premium Bakery Products Revenue Million Forecast, by Country 2019 & 2032
- Table 104: Global Premium Bakery Products Volume K Tons Forecast, by Country 2019 & 2032
- Table 105: China Premium Bakery Products Revenue (Million) Forecast, by Application 2019 & 2032
- Table 106: China Premium Bakery Products Volume (K Tons) Forecast, by Application 2019 & 2032
- Table 107: Japan Premium Bakery Products Revenue (Million) Forecast, by Application 2019 & 2032
- Table 108: Japan Premium Bakery Products Volume (K Tons) Forecast, by Application 2019 & 2032
- Table 109: India Premium Bakery Products Revenue (Million) Forecast, by Application 2019 & 2032
- Table 110: India Premium Bakery Products Volume (K Tons) Forecast, by Application 2019 & 2032
- Table 111: Australia Premium Bakery Products Revenue (Million) Forecast, by Application 2019 & 2032
- Table 112: Australia Premium Bakery Products Volume (K Tons) Forecast, by Application 2019 & 2032
- Table 113: Rest of Asia Pacific Premium Bakery Products Revenue (Million) Forecast, by Application 2019 & 2032
- Table 114: Rest of Asia Pacific Premium Bakery Products Volume (K Tons) Forecast, by Application 2019 & 2032
- Table 115: Global Premium Bakery Products Revenue Million Forecast, by Product Type 2019 & 2032
- Table 116: Global Premium Bakery Products Volume K Tons Forecast, by Product Type 2019 & 2032
- Table 117: Global Premium Bakery Products Revenue Million Forecast, by Distibution Channel 2019 & 2032
- Table 118: Global Premium Bakery Products Volume K Tons Forecast, by Distibution Channel 2019 & 2032
- Table 119: Global Premium Bakery Products Revenue Million Forecast, by Country 2019 & 2032
- Table 120: Global Premium Bakery Products Volume K Tons Forecast, by Country 2019 & 2032
- Table 121: Brazil Premium Bakery Products Revenue (Million) Forecast, by Application 2019 & 2032
- Table 122: Brazil Premium Bakery Products Volume (K Tons) Forecast, by Application 2019 & 2032
- Table 123: Argentina Premium Bakery Products Revenue (Million) Forecast, by Application 2019 & 2032
- Table 124: Argentina Premium Bakery Products Volume (K Tons) Forecast, by Application 2019 & 2032
- Table 125: Rest of South America Premium Bakery Products Revenue (Million) Forecast, by Application 2019 & 2032
- Table 126: Rest of South America Premium Bakery Products Volume (K Tons) Forecast, by Application 2019 & 2032
- Table 127: Global Premium Bakery Products Revenue Million Forecast, by Product Type 2019 & 2032
- Table 128: Global Premium Bakery Products Volume K Tons Forecast, by Product Type 2019 & 2032
- Table 129: Global Premium Bakery Products Revenue Million Forecast, by Distibution Channel 2019 & 2032
- Table 130: Global Premium Bakery Products Volume K Tons Forecast, by Distibution Channel 2019 & 2032
- Table 131: Global Premium Bakery Products Revenue Million Forecast, by Country 2019 & 2032
- Table 132: Global Premium Bakery Products Volume K Tons Forecast, by Country 2019 & 2032
- Table 133: Global Premium Bakery Products Revenue Million Forecast, by Product Type 2019 & 2032
- Table 134: Global Premium Bakery Products Volume K Tons Forecast, by Product Type 2019 & 2032
- Table 135: Global Premium Bakery Products Revenue Million Forecast, by Distibution Channel 2019 & 2032
- Table 136: Global Premium Bakery Products Volume K Tons Forecast, by Distibution Channel 2019 & 2032
- Table 137: Global Premium Bakery Products Revenue Million Forecast, by Country 2019 & 2032
- Table 138: Global Premium Bakery Products Volume K Tons Forecast, by Country 2019 & 2032
- Table 139: South Africa Premium Bakery Products Revenue (Million) Forecast, by Application 2019 & 2032
- Table 140: South Africa Premium Bakery Products Volume (K Tons) Forecast, by Application 2019 & 2032
- Table 141: Rest of Middle East Premium Bakery Products Revenue (Million) Forecast, by Application 2019 & 2032
- Table 142: Rest of Middle East Premium Bakery Products Volume (K Tons) Forecast, by Application 2019 & 2032
Frequently Asked Questions
1. What is the projected Compound Annual Growth Rate (CAGR) of the Premium Bakery Products?
The projected CAGR is approximately 6.25%.
2. Which companies are prominent players in the Premium Bakery Products?
Key companies in the market include BARILLA G E R FRATELLI SPA, General Mills Inc, Finsbury Food Group Plc, ALMARAI COMPANY, FUJI BAKING CO LTD, Associated British Foods plc, Mondelez International Inc, Bimbo Bakeries USA, Bakers Delight Holdings Limited, Britannia Industries Ltd*List Not Exhaustive.
3. What are the main segments of the Premium Bakery Products?
The market segments include Product Type, Distibution Channel.
4. Can you provide details about the market size?
The market size is estimated to be USD XX Million as of 2022.
5. What are some drivers contributing to market growth?
Innovation in Vanillin Synthesis; Diverse Functionality of Vanillin In End-use Industries.
6. What are the notable trends driving market growth?
Rising demand for premium healthy snacking options is driving the market.
7. Are there any restraints impacting market growth?
Supply Chain Variability Impacting Vanilla Bean Availability For Flavor Production.
8. Can you provide examples of recent developments in the market?
In April 2022, Walker's Shortbread is partnering with retailer Dufry for the launch of a new Global Travel Retailer range into more than 55 travel sites worldwide including France. The product range will include several types of shortbreads and other products in it.
9. What pricing options are available for accessing the report?
Pricing options include single-user, multi-user, and enterprise licenses priced at USD 4750, USD 5250, and USD 8750 respectively.
10. Is the market size provided in terms of value or volume?
The market size is provided in terms of value, measured in Million and volume, measured in K Tons.
11. Are there any specific market keywords associated with the report?
Yes, the market keyword associated with the report is "Premium Bakery Products," which aids in identifying and referencing the specific market segment covered.
12. How do I determine which pricing option suits my needs best?
The pricing options vary based on user requirements and access needs. Individual users may opt for single-user licenses, while businesses requiring broader access may choose multi-user or enterprise licenses for cost-effective access to the report.
13. Are there any additional resources or data provided in the Premium Bakery Products report?
While the report offers comprehensive insights, it's advisable to review the specific contents or supplementary materials provided to ascertain if additional resources or data are available.
14. How can I stay updated on further developments or reports in the Premium Bakery Products?
To stay informed about further developments, trends, and reports in the Premium Bakery Products, consider subscribing to industry newsletters, following relevant companies and organizations, or regularly checking reputable industry news sources and publications.
Methodology
Step 1 - Identification of Relevant Samples Size from Population Database


Step 2 - Approaches for Defining Global Market Size (Value, Volume* & Price*)

Note*: In applicable scenarios
Step 3 - Data Sources
Primary Research
- Web Analytics
- Survey Reports
- Research Institute
- Latest Research Reports
- Opinion Leaders
Secondary Research
- Annual Reports
- White Paper
- Latest Press Release
- Industry Association
- Paid Database
- Investor Presentations

Step 4 - Data Triangulation
Involves using different sources of information in order to increase the validity of a study
These sources are likely to be stakeholders in a program - participants, other researchers, program staff, other community members, and so on.
Then we put all data in single framework & apply various statistical tools to find out the dynamic on the market.
During the analysis stage, feedback from the stakeholder groups would be compared to determine areas of agreement as well as areas of divergence
