

Key Insights
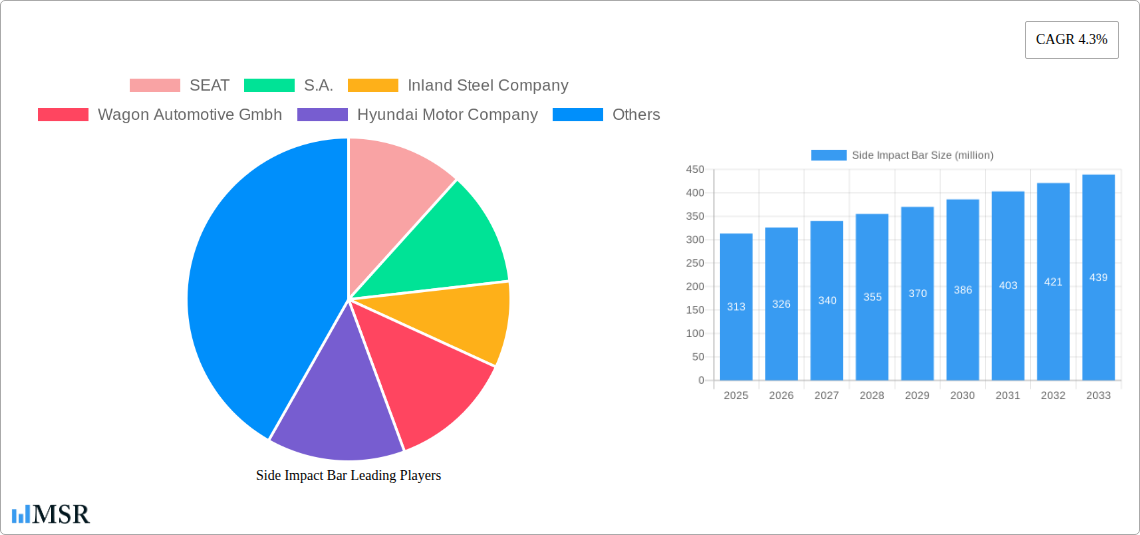
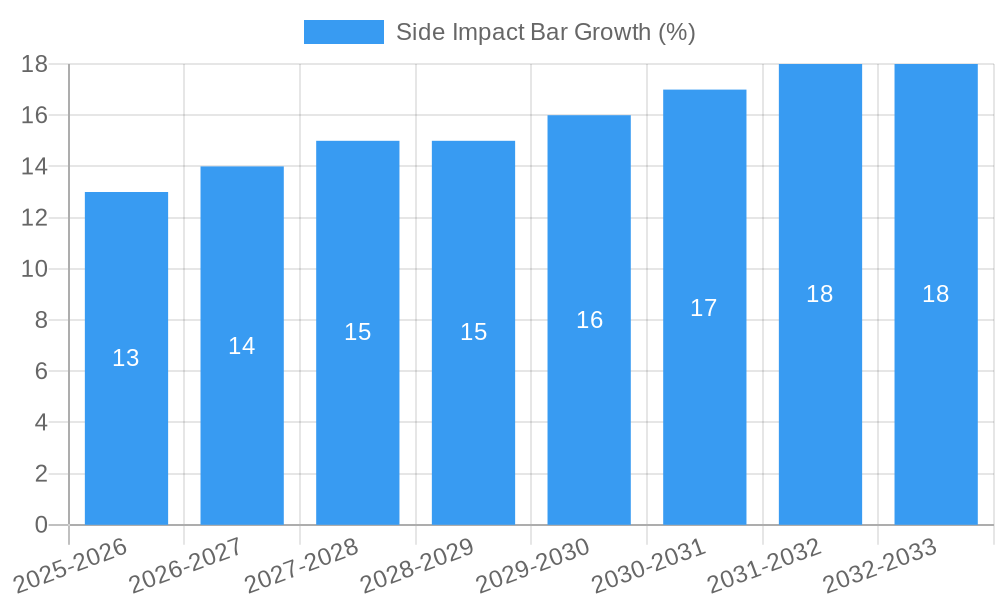
The global side impact bar market, currently valued at approximately $313 million in 2025, is projected to experience steady growth, driven by increasing vehicle production, stringent safety regulations mandating side impact protection, and a rising demand for lightweight yet strong materials in automotive manufacturing. The Compound Annual Growth Rate (CAGR) of 4.3% from 2025 to 2033 indicates a consistent expansion, although this rate may fluctuate slightly year-to-year depending on economic conditions and technological advancements. Key drivers include the integration of advanced materials like high-strength steel and aluminum alloys, which enhance impact absorption while reducing vehicle weight, improving fuel efficiency. Furthermore, the ongoing trend towards enhanced vehicle safety features and the development of more sophisticated side impact protection systems are contributing to market growth. Companies like SEAT, Hyundai, and Toyota, along with specialized automotive parts suppliers, are actively involved in research and development, leading to innovations in design and material science within the side impact bar sector.
However, the market's growth trajectory is not without challenges. Potential restraints include fluctuating raw material prices, particularly for steel and aluminum, which can affect production costs. Furthermore, economic downturns can impact vehicle production volumes, indirectly affecting demand for side impact bars. The competitive landscape is characterized by both established automotive manufacturers and specialized component suppliers, leading to intense competition and price pressures. Despite these challenges, the long-term outlook for the side impact bar market remains positive, driven by the ever-increasing emphasis on vehicle safety and ongoing technological innovations within the automotive industry. This suggests a promising growth trajectory through 2033, although precise figures will depend on the continued evolution of these factors.
Side Impact Bar Market Report: 2019-2033 - A Comprehensive Analysis
This comprehensive report provides an in-depth analysis of the global Side Impact Bar market, offering invaluable insights for industry stakeholders, investors, and strategic decision-makers. Covering the period 2019-2033, with a focus on 2025, this report unveils market dynamics, technological advancements, and key players shaping the future of this critical automotive safety component. The global Side Impact Bar market is projected to reach xx million by 2033, exhibiting a CAGR of xx% during the forecast period (2025-2033).
Side Impact Bar Market Concentration & Dynamics
The global Side Impact Bar market exhibits a moderately concentrated landscape, with key players holding significant market share. Market concentration is influenced by factors such as technological advancements, economies of scale, and strategic partnerships. The market witnessed xx M&A deals during the historical period (2019-2024), indicating a dynamic competitive environment. Innovation ecosystems are characterized by collaborations between automotive manufacturers, component suppliers, and research institutions. Regulatory frameworks, particularly those related to vehicle safety standards, play a crucial role in shaping market dynamics. Substitute products, such as alternative crash protection technologies, pose a competitive challenge, while evolving end-user preferences drive demand for lighter, stronger, and more cost-effective side impact bars.
- Market Share (2024): Top 5 players hold approximately xx% of the market.
- M&A Activity (2019-2024): xx deals, with a focus on expanding product portfolios and geographical reach.
- Key Regulatory Drivers: Stringent vehicle safety regulations in major markets (e.g., Europe, North America, Asia).
- Substitute Products: Advanced materials and alternative crash management systems.
Side Impact Bar Industry Insights & Trends
The global Side Impact Bar market experienced significant growth during the historical period (2019-2024), driven by rising vehicle production, increasing consumer demand for enhanced safety features, and the adoption of stricter safety regulations globally. The market size in 2024 was estimated at xx million. Technological disruptions, such as the increasing use of advanced high-strength steel (AHSS) and other lightweight materials, are transforming the industry. Evolving consumer behavior, emphasizing vehicle safety and fuel efficiency, further fuels market growth. The market is expected to maintain its growth trajectory during the forecast period (2025-2033), driven by factors including rising vehicle sales in developing economies and the increasing adoption of advanced driver-assistance systems (ADAS).
Key Markets & Segments Leading Side Impact Bar
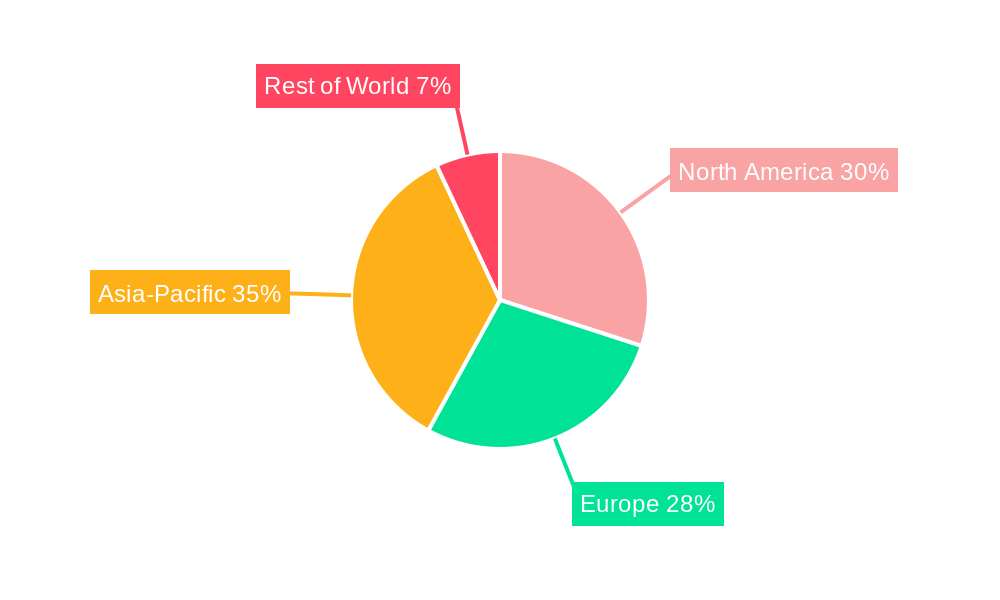
The Asia-Pacific region is currently the dominant market for Side Impact Bars, driven primarily by robust economic growth and surging vehicle production, particularly in China and India. Europe and North America also represent significant markets, characterized by high safety standards and advanced technological adoption. The passenger car segment currently dominates the market, while the light commercial vehicle segment is expected to exhibit strong growth in the coming years.
Drivers of Market Dominance in Asia-Pacific:
- High Vehicle Production: Rapid growth in vehicle manufacturing across the region.
- Rising Disposable Incomes: Increased purchasing power boosting demand for safer vehicles.
- Government Regulations: Stringent safety standards mandating the use of side impact bars.
Detailed analysis reveals that the growth in the Asia-Pacific market is directly correlated with the increasing vehicle ownership rates and government initiatives promoting road safety.
Side Impact Bar Product Developments
Recent product innovations focus on enhancing the strength-to-weight ratio of side impact bars through the utilization of advanced materials such as AHSS, aluminum alloys, and composites. These advancements improve vehicle crash safety performance while simultaneously reducing overall vehicle weight, contributing to improved fuel efficiency. The integration of advanced manufacturing processes, such as hot stamping and hydroforming, further optimizes the design and performance of these crucial safety components, providing manufacturers with a competitive edge in the market.
Challenges in the Side Impact Bar Market
The Side Impact Bar market faces challenges including fluctuating raw material prices (particularly steel), potential supply chain disruptions, and intense competition from both established and emerging players. Stringent regulatory compliance requirements add to the complexity of the market, impacting manufacturing costs and time-to-market. These challenges, cumulatively, may impact market growth by approximately xx million annually.
Forces Driving Side Impact Bar Growth
Several factors drive Side Impact Bar market growth. Increased vehicle production, particularly in emerging economies, fuels demand. Stricter safety regulations globally mandate the use of these bars, boosting market expansion. Technological advancements in materials science lead to lighter, stronger, and more cost-effective designs. The adoption of ADAS features further necessitates robust side impact protection, contributing to significant growth.
Long-Term Growth Catalysts in Side Impact Bar
Long-term growth in the Side Impact Bar market is projected to be driven by ongoing innovations in materials science and manufacturing processes. Strategic partnerships between automotive manufacturers and component suppliers will play a crucial role in accelerating technological advancements and enhancing supply chain efficiencies. Expansion into new markets, particularly in developing economies with growing vehicle ownership rates, will also contribute to long-term growth.
Emerging Opportunities in Side Impact Bar
Emerging opportunities lie in the development of lightweight, high-strength side impact bars using advanced materials like carbon fiber composites. The integration of smart sensors and data analytics for predictive maintenance offers further opportunities. Expansion into electric and autonomous vehicles presents another significant growth avenue, demanding robust and integrated safety systems.
Leading Players in the Side Impact Bar Sector
- SEAT, S.A.
- Inland Steel Company
- Wagon Automotive Gmbh
- Hyundai Motor Company
- COMAU SYSTEMS S.p.A.
- Toyota Motor Engineering & Manufacturing Corporation
- Benteler Ag
- Norsk Hydro Asa
- Aisin Seiki Co Ltd
- NHK Spring Co., Ltd.
- Austria Metall Aktiengesellschaft
Key Milestones in Side Impact Bar Industry
- 2020: Introduction of xx advanced high-strength steel by xx company.
- 2022: Strategic partnership between xx and xx to develop lightweight side impact bars.
- 2023: New safety regulations implemented in xx, impacting market demand.
- 2024: Launch of a new side impact bar design incorporating xx technology.
Strategic Outlook for Side Impact Bar Market
The future of the Side Impact Bar market appears promising, driven by sustained growth in vehicle production, technological innovations, and stricter safety regulations. Strategic partnerships, focusing on research and development, and the adoption of advanced manufacturing techniques will be key success factors for players in this market. The potential for growth is significant, with opportunities in emerging markets and advancements in materials science promising sustained market expansion in the coming decade.
Side Impact Bar Segmentation
-
1. Application
- 1.1. Passenger Cars
- 1.2. Commercial Vehicles
-
2. Type
- 2.1. Steel
- 2.2. Aluminum
- 2.3. Plastic
Side Impact Bar Segmentation By Geography
-
1. North America
- 1.1. United States
- 1.2. Canada
- 1.3. Mexico
-
2. South America
- 2.1. Brazil
- 2.2. Argentina
- 2.3. Rest of South America
-
3. Europe
- 3.1. United Kingdom
- 3.2. Germany
- 3.3. France
- 3.4. Italy
- 3.5. Spain
- 3.6. Russia
- 3.7. Benelux
- 3.8. Nordics
- 3.9. Rest of Europe
-
4. Middle East & Africa
- 4.1. Turkey
- 4.2. Israel
- 4.3. GCC
- 4.4. North Africa
- 4.5. South Africa
- 4.6. Rest of Middle East & Africa
-
5. Asia Pacific
- 5.1. China
- 5.2. India
- 5.3. Japan
- 5.4. South Korea
- 5.5. ASEAN
- 5.6. Oceania
- 5.7. Rest of Asia Pacific
Side Impact Bar REPORT HIGHLIGHTS
| Aspects | Details |
|---|---|
| Study Period | 2019-2033 |
| Base Year | 2024 |
| Estimated Year | 2025 |
| Forecast Period | 2025-2033 |
| Historical Period | 2019-2024 |
| Growth Rate | CAGR of 4.3% from 2019-2033 |
| Segmentation |
|
Table of Contents
- 1. Introduction
- 1.1. Research Scope
- 1.2. Market Segmentation
- 1.3. Research Methodology
- 1.4. Definitions and Assumptions
- 2. Executive Summary
- 2.1. Introduction
- 3. Market Dynamics
- 3.1. Introduction
- 3.2. Market Drivers
- 3.3. Market Restrains
- 3.4. Market Trends
- 4. Market Factor Analysis
- 4.1. Porters Five Forces
- 4.2. Supply/Value Chain
- 4.3. PESTEL analysis
- 4.4. Market Entropy
- 4.5. Patent/Trademark Analysis
- 5. Global Side Impact Bar Analysis, Insights and Forecast, 2019-2031
- 5.1. Market Analysis, Insights and Forecast - by Application
- 5.1.1. Passenger Cars
- 5.1.2. Commercial Vehicles
- 5.2. Market Analysis, Insights and Forecast - by Type
- 5.2.1. Steel
- 5.2.2. Aluminum
- 5.2.3. Plastic
- 5.3. Market Analysis, Insights and Forecast - by Region
- 5.3.1. North America
- 5.3.2. South America
- 5.3.3. Europe
- 5.3.4. Middle East & Africa
- 5.3.5. Asia Pacific
- 5.1. Market Analysis, Insights and Forecast - by Application
- 6. North America Side Impact Bar Analysis, Insights and Forecast, 2019-2031
- 6.1. Market Analysis, Insights and Forecast - by Application
- 6.1.1. Passenger Cars
- 6.1.2. Commercial Vehicles
- 6.2. Market Analysis, Insights and Forecast - by Type
- 6.2.1. Steel
- 6.2.2. Aluminum
- 6.2.3. Plastic
- 6.1. Market Analysis, Insights and Forecast - by Application
- 7. South America Side Impact Bar Analysis, Insights and Forecast, 2019-2031
- 7.1. Market Analysis, Insights and Forecast - by Application
- 7.1.1. Passenger Cars
- 7.1.2. Commercial Vehicles
- 7.2. Market Analysis, Insights and Forecast - by Type
- 7.2.1. Steel
- 7.2.2. Aluminum
- 7.2.3. Plastic
- 7.1. Market Analysis, Insights and Forecast - by Application
- 8. Europe Side Impact Bar Analysis, Insights and Forecast, 2019-2031
- 8.1. Market Analysis, Insights and Forecast - by Application
- 8.1.1. Passenger Cars
- 8.1.2. Commercial Vehicles
- 8.2. Market Analysis, Insights and Forecast - by Type
- 8.2.1. Steel
- 8.2.2. Aluminum
- 8.2.3. Plastic
- 8.1. Market Analysis, Insights and Forecast - by Application
- 9. Middle East & Africa Side Impact Bar Analysis, Insights and Forecast, 2019-2031
- 9.1. Market Analysis, Insights and Forecast - by Application
- 9.1.1. Passenger Cars
- 9.1.2. Commercial Vehicles
- 9.2. Market Analysis, Insights and Forecast - by Type
- 9.2.1. Steel
- 9.2.2. Aluminum
- 9.2.3. Plastic
- 9.1. Market Analysis, Insights and Forecast - by Application
- 10. Asia Pacific Side Impact Bar Analysis, Insights and Forecast, 2019-2031
- 10.1. Market Analysis, Insights and Forecast - by Application
- 10.1.1. Passenger Cars
- 10.1.2. Commercial Vehicles
- 10.2. Market Analysis, Insights and Forecast - by Type
- 10.2.1. Steel
- 10.2.2. Aluminum
- 10.2.3. Plastic
- 10.1. Market Analysis, Insights and Forecast - by Application
- 11. Competitive Analysis
- 11.1. Global Market Share Analysis 2024
- 11.2. Company Profiles
- 11.2.1 SEAT
- 11.2.1.1. Overview
- 11.2.1.2. Products
- 11.2.1.3. SWOT Analysis
- 11.2.1.4. Recent Developments
- 11.2.1.5. Financials (Based on Availability)
- 11.2.2 S.A.
- 11.2.2.1. Overview
- 11.2.2.2. Products
- 11.2.2.3. SWOT Analysis
- 11.2.2.4. Recent Developments
- 11.2.2.5. Financials (Based on Availability)
- 11.2.3 Inland Steel Company
- 11.2.3.1. Overview
- 11.2.3.2. Products
- 11.2.3.3. SWOT Analysis
- 11.2.3.4. Recent Developments
- 11.2.3.5. Financials (Based on Availability)
- 11.2.4 Wagon Automotive Gmbh
- 11.2.4.1. Overview
- 11.2.4.2. Products
- 11.2.4.3. SWOT Analysis
- 11.2.4.4. Recent Developments
- 11.2.4.5. Financials (Based on Availability)
- 11.2.5 Hyundai Motor Company
- 11.2.5.1. Overview
- 11.2.5.2. Products
- 11.2.5.3. SWOT Analysis
- 11.2.5.4. Recent Developments
- 11.2.5.5. Financials (Based on Availability)
- 11.2.6 COMAU SYSTEMS S.p.A.
- 11.2.6.1. Overview
- 11.2.6.2. Products
- 11.2.6.3. SWOT Analysis
- 11.2.6.4. Recent Developments
- 11.2.6.5. Financials (Based on Availability)
- 11.2.7 Toyota Motor Engineering & Manufacturing Corporation
- 11.2.7.1. Overview
- 11.2.7.2. Products
- 11.2.7.3. SWOT Analysis
- 11.2.7.4. Recent Developments
- 11.2.7.5. Financials (Based on Availability)
- 11.2.8 Benteler Ag
- 11.2.8.1. Overview
- 11.2.8.2. Products
- 11.2.8.3. SWOT Analysis
- 11.2.8.4. Recent Developments
- 11.2.8.5. Financials (Based on Availability)
- 11.2.9 Norsk Hydro Asa
- 11.2.9.1. Overview
- 11.2.9.2. Products
- 11.2.9.3. SWOT Analysis
- 11.2.9.4. Recent Developments
- 11.2.9.5. Financials (Based on Availability)
- 11.2.10 Aisin Seiki Co Ltd
- 11.2.10.1. Overview
- 11.2.10.2. Products
- 11.2.10.3. SWOT Analysis
- 11.2.10.4. Recent Developments
- 11.2.10.5. Financials (Based on Availability)
- 11.2.11 Nhk Spring Co.
- 11.2.11.1. Overview
- 11.2.11.2. Products
- 11.2.11.3. SWOT Analysis
- 11.2.11.4. Recent Developments
- 11.2.11.5. Financials (Based on Availability)
- 11.2.12 Ltd.
- 11.2.12.1. Overview
- 11.2.12.2. Products
- 11.2.12.3. SWOT Analysis
- 11.2.12.4. Recent Developments
- 11.2.12.5. Financials (Based on Availability)
- 11.2.13 Austria Metall Aktiengesellschaft
- 11.2.13.1. Overview
- 11.2.13.2. Products
- 11.2.13.3. SWOT Analysis
- 11.2.13.4. Recent Developments
- 11.2.13.5. Financials (Based on Availability)
- 11.2.1 SEAT
List of Figures
- Figure 1: Global Side Impact Bar Revenue Breakdown (million, %) by Region 2024 & 2032
- Figure 2: Global Side Impact Bar Volume Breakdown (K, %) by Region 2024 & 2032
- Figure 3: North America Side Impact Bar Revenue (million), by Application 2024 & 2032
- Figure 4: North America Side Impact Bar Volume (K), by Application 2024 & 2032
- Figure 5: North America Side Impact Bar Revenue Share (%), by Application 2024 & 2032
- Figure 6: North America Side Impact Bar Volume Share (%), by Application 2024 & 2032
- Figure 7: North America Side Impact Bar Revenue (million), by Type 2024 & 2032
- Figure 8: North America Side Impact Bar Volume (K), by Type 2024 & 2032
- Figure 9: North America Side Impact Bar Revenue Share (%), by Type 2024 & 2032
- Figure 10: North America Side Impact Bar Volume Share (%), by Type 2024 & 2032
- Figure 11: North America Side Impact Bar Revenue (million), by Country 2024 & 2032
- Figure 12: North America Side Impact Bar Volume (K), by Country 2024 & 2032
- Figure 13: North America Side Impact Bar Revenue Share (%), by Country 2024 & 2032
- Figure 14: North America Side Impact Bar Volume Share (%), by Country 2024 & 2032
- Figure 15: South America Side Impact Bar Revenue (million), by Application 2024 & 2032
- Figure 16: South America Side Impact Bar Volume (K), by Application 2024 & 2032
- Figure 17: South America Side Impact Bar Revenue Share (%), by Application 2024 & 2032
- Figure 18: South America Side Impact Bar Volume Share (%), by Application 2024 & 2032
- Figure 19: South America Side Impact Bar Revenue (million), by Type 2024 & 2032
- Figure 20: South America Side Impact Bar Volume (K), by Type 2024 & 2032
- Figure 21: South America Side Impact Bar Revenue Share (%), by Type 2024 & 2032
- Figure 22: South America Side Impact Bar Volume Share (%), by Type 2024 & 2032
- Figure 23: South America Side Impact Bar Revenue (million), by Country 2024 & 2032
- Figure 24: South America Side Impact Bar Volume (K), by Country 2024 & 2032
- Figure 25: South America Side Impact Bar Revenue Share (%), by Country 2024 & 2032
- Figure 26: South America Side Impact Bar Volume Share (%), by Country 2024 & 2032
- Figure 27: Europe Side Impact Bar Revenue (million), by Application 2024 & 2032
- Figure 28: Europe Side Impact Bar Volume (K), by Application 2024 & 2032
- Figure 29: Europe Side Impact Bar Revenue Share (%), by Application 2024 & 2032
- Figure 30: Europe Side Impact Bar Volume Share (%), by Application 2024 & 2032
- Figure 31: Europe Side Impact Bar Revenue (million), by Type 2024 & 2032
- Figure 32: Europe Side Impact Bar Volume (K), by Type 2024 & 2032
- Figure 33: Europe Side Impact Bar Revenue Share (%), by Type 2024 & 2032
- Figure 34: Europe Side Impact Bar Volume Share (%), by Type 2024 & 2032
- Figure 35: Europe Side Impact Bar Revenue (million), by Country 2024 & 2032
- Figure 36: Europe Side Impact Bar Volume (K), by Country 2024 & 2032
- Figure 37: Europe Side Impact Bar Revenue Share (%), by Country 2024 & 2032
- Figure 38: Europe Side Impact Bar Volume Share (%), by Country 2024 & 2032
- Figure 39: Middle East & Africa Side Impact Bar Revenue (million), by Application 2024 & 2032
- Figure 40: Middle East & Africa Side Impact Bar Volume (K), by Application 2024 & 2032
- Figure 41: Middle East & Africa Side Impact Bar Revenue Share (%), by Application 2024 & 2032
- Figure 42: Middle East & Africa Side Impact Bar Volume Share (%), by Application 2024 & 2032
- Figure 43: Middle East & Africa Side Impact Bar Revenue (million), by Type 2024 & 2032
- Figure 44: Middle East & Africa Side Impact Bar Volume (K), by Type 2024 & 2032
- Figure 45: Middle East & Africa Side Impact Bar Revenue Share (%), by Type 2024 & 2032
- Figure 46: Middle East & Africa Side Impact Bar Volume Share (%), by Type 2024 & 2032
- Figure 47: Middle East & Africa Side Impact Bar Revenue (million), by Country 2024 & 2032
- Figure 48: Middle East & Africa Side Impact Bar Volume (K), by Country 2024 & 2032
- Figure 49: Middle East & Africa Side Impact Bar Revenue Share (%), by Country 2024 & 2032
- Figure 50: Middle East & Africa Side Impact Bar Volume Share (%), by Country 2024 & 2032
- Figure 51: Asia Pacific Side Impact Bar Revenue (million), by Application 2024 & 2032
- Figure 52: Asia Pacific Side Impact Bar Volume (K), by Application 2024 & 2032
- Figure 53: Asia Pacific Side Impact Bar Revenue Share (%), by Application 2024 & 2032
- Figure 54: Asia Pacific Side Impact Bar Volume Share (%), by Application 2024 & 2032
- Figure 55: Asia Pacific Side Impact Bar Revenue (million), by Type 2024 & 2032
- Figure 56: Asia Pacific Side Impact Bar Volume (K), by Type 2024 & 2032
- Figure 57: Asia Pacific Side Impact Bar Revenue Share (%), by Type 2024 & 2032
- Figure 58: Asia Pacific Side Impact Bar Volume Share (%), by Type 2024 & 2032
- Figure 59: Asia Pacific Side Impact Bar Revenue (million), by Country 2024 & 2032
- Figure 60: Asia Pacific Side Impact Bar Volume (K), by Country 2024 & 2032
- Figure 61: Asia Pacific Side Impact Bar Revenue Share (%), by Country 2024 & 2032
- Figure 62: Asia Pacific Side Impact Bar Volume Share (%), by Country 2024 & 2032
List of Tables
- Table 1: Global Side Impact Bar Revenue million Forecast, by Region 2019 & 2032
- Table 2: Global Side Impact Bar Volume K Forecast, by Region 2019 & 2032
- Table 3: Global Side Impact Bar Revenue million Forecast, by Application 2019 & 2032
- Table 4: Global Side Impact Bar Volume K Forecast, by Application 2019 & 2032
- Table 5: Global Side Impact Bar Revenue million Forecast, by Type 2019 & 2032
- Table 6: Global Side Impact Bar Volume K Forecast, by Type 2019 & 2032
- Table 7: Global Side Impact Bar Revenue million Forecast, by Region 2019 & 2032
- Table 8: Global Side Impact Bar Volume K Forecast, by Region 2019 & 2032
- Table 9: Global Side Impact Bar Revenue million Forecast, by Application 2019 & 2032
- Table 10: Global Side Impact Bar Volume K Forecast, by Application 2019 & 2032
- Table 11: Global Side Impact Bar Revenue million Forecast, by Type 2019 & 2032
- Table 12: Global Side Impact Bar Volume K Forecast, by Type 2019 & 2032
- Table 13: Global Side Impact Bar Revenue million Forecast, by Country 2019 & 2032
- Table 14: Global Side Impact Bar Volume K Forecast, by Country 2019 & 2032
- Table 15: United States Side Impact Bar Revenue (million) Forecast, by Application 2019 & 2032
- Table 16: United States Side Impact Bar Volume (K) Forecast, by Application 2019 & 2032
- Table 17: Canada Side Impact Bar Revenue (million) Forecast, by Application 2019 & 2032
- Table 18: Canada Side Impact Bar Volume (K) Forecast, by Application 2019 & 2032
- Table 19: Mexico Side Impact Bar Revenue (million) Forecast, by Application 2019 & 2032
- Table 20: Mexico Side Impact Bar Volume (K) Forecast, by Application 2019 & 2032
- Table 21: Global Side Impact Bar Revenue million Forecast, by Application 2019 & 2032
- Table 22: Global Side Impact Bar Volume K Forecast, by Application 2019 & 2032
- Table 23: Global Side Impact Bar Revenue million Forecast, by Type 2019 & 2032
- Table 24: Global Side Impact Bar Volume K Forecast, by Type 2019 & 2032
- Table 25: Global Side Impact Bar Revenue million Forecast, by Country 2019 & 2032
- Table 26: Global Side Impact Bar Volume K Forecast, by Country 2019 & 2032
- Table 27: Brazil Side Impact Bar Revenue (million) Forecast, by Application 2019 & 2032
- Table 28: Brazil Side Impact Bar Volume (K) Forecast, by Application 2019 & 2032
- Table 29: Argentina Side Impact Bar Revenue (million) Forecast, by Application 2019 & 2032
- Table 30: Argentina Side Impact Bar Volume (K) Forecast, by Application 2019 & 2032
- Table 31: Rest of South America Side Impact Bar Revenue (million) Forecast, by Application 2019 & 2032
- Table 32: Rest of South America Side Impact Bar Volume (K) Forecast, by Application 2019 & 2032
- Table 33: Global Side Impact Bar Revenue million Forecast, by Application 2019 & 2032
- Table 34: Global Side Impact Bar Volume K Forecast, by Application 2019 & 2032
- Table 35: Global Side Impact Bar Revenue million Forecast, by Type 2019 & 2032
- Table 36: Global Side Impact Bar Volume K Forecast, by Type 2019 & 2032
- Table 37: Global Side Impact Bar Revenue million Forecast, by Country 2019 & 2032
- Table 38: Global Side Impact Bar Volume K Forecast, by Country 2019 & 2032
- Table 39: United Kingdom Side Impact Bar Revenue (million) Forecast, by Application 2019 & 2032
- Table 40: United Kingdom Side Impact Bar Volume (K) Forecast, by Application 2019 & 2032
- Table 41: Germany Side Impact Bar Revenue (million) Forecast, by Application 2019 & 2032
- Table 42: Germany Side Impact Bar Volume (K) Forecast, by Application 2019 & 2032
- Table 43: France Side Impact Bar Revenue (million) Forecast, by Application 2019 & 2032
- Table 44: France Side Impact Bar Volume (K) Forecast, by Application 2019 & 2032
- Table 45: Italy Side Impact Bar Revenue (million) Forecast, by Application 2019 & 2032
- Table 46: Italy Side Impact Bar Volume (K) Forecast, by Application 2019 & 2032
- Table 47: Spain Side Impact Bar Revenue (million) Forecast, by Application 2019 & 2032
- Table 48: Spain Side Impact Bar Volume (K) Forecast, by Application 2019 & 2032
- Table 49: Russia Side Impact Bar Revenue (million) Forecast, by Application 2019 & 2032
- Table 50: Russia Side Impact Bar Volume (K) Forecast, by Application 2019 & 2032
- Table 51: Benelux Side Impact Bar Revenue (million) Forecast, by Application 2019 & 2032
- Table 52: Benelux Side Impact Bar Volume (K) Forecast, by Application 2019 & 2032
- Table 53: Nordics Side Impact Bar Revenue (million) Forecast, by Application 2019 & 2032
- Table 54: Nordics Side Impact Bar Volume (K) Forecast, by Application 2019 & 2032
- Table 55: Rest of Europe Side Impact Bar Revenue (million) Forecast, by Application 2019 & 2032
- Table 56: Rest of Europe Side Impact Bar Volume (K) Forecast, by Application 2019 & 2032
- Table 57: Global Side Impact Bar Revenue million Forecast, by Application 2019 & 2032
- Table 58: Global Side Impact Bar Volume K Forecast, by Application 2019 & 2032
- Table 59: Global Side Impact Bar Revenue million Forecast, by Type 2019 & 2032
- Table 60: Global Side Impact Bar Volume K Forecast, by Type 2019 & 2032
- Table 61: Global Side Impact Bar Revenue million Forecast, by Country 2019 & 2032
- Table 62: Global Side Impact Bar Volume K Forecast, by Country 2019 & 2032
- Table 63: Turkey Side Impact Bar Revenue (million) Forecast, by Application 2019 & 2032
- Table 64: Turkey Side Impact Bar Volume (K) Forecast, by Application 2019 & 2032
- Table 65: Israel Side Impact Bar Revenue (million) Forecast, by Application 2019 & 2032
- Table 66: Israel Side Impact Bar Volume (K) Forecast, by Application 2019 & 2032
- Table 67: GCC Side Impact Bar Revenue (million) Forecast, by Application 2019 & 2032
- Table 68: GCC Side Impact Bar Volume (K) Forecast, by Application 2019 & 2032
- Table 69: North Africa Side Impact Bar Revenue (million) Forecast, by Application 2019 & 2032
- Table 70: North Africa Side Impact Bar Volume (K) Forecast, by Application 2019 & 2032
- Table 71: South Africa Side Impact Bar Revenue (million) Forecast, by Application 2019 & 2032
- Table 72: South Africa Side Impact Bar Volume (K) Forecast, by Application 2019 & 2032
- Table 73: Rest of Middle East & Africa Side Impact Bar Revenue (million) Forecast, by Application 2019 & 2032
- Table 74: Rest of Middle East & Africa Side Impact Bar Volume (K) Forecast, by Application 2019 & 2032
- Table 75: Global Side Impact Bar Revenue million Forecast, by Application 2019 & 2032
- Table 76: Global Side Impact Bar Volume K Forecast, by Application 2019 & 2032
- Table 77: Global Side Impact Bar Revenue million Forecast, by Type 2019 & 2032
- Table 78: Global Side Impact Bar Volume K Forecast, by Type 2019 & 2032
- Table 79: Global Side Impact Bar Revenue million Forecast, by Country 2019 & 2032
- Table 80: Global Side Impact Bar Volume K Forecast, by Country 2019 & 2032
- Table 81: China Side Impact Bar Revenue (million) Forecast, by Application 2019 & 2032
- Table 82: China Side Impact Bar Volume (K) Forecast, by Application 2019 & 2032
- Table 83: India Side Impact Bar Revenue (million) Forecast, by Application 2019 & 2032
- Table 84: India Side Impact Bar Volume (K) Forecast, by Application 2019 & 2032
- Table 85: Japan Side Impact Bar Revenue (million) Forecast, by Application 2019 & 2032
- Table 86: Japan Side Impact Bar Volume (K) Forecast, by Application 2019 & 2032
- Table 87: South Korea Side Impact Bar Revenue (million) Forecast, by Application 2019 & 2032
- Table 88: South Korea Side Impact Bar Volume (K) Forecast, by Application 2019 & 2032
- Table 89: ASEAN Side Impact Bar Revenue (million) Forecast, by Application 2019 & 2032
- Table 90: ASEAN Side Impact Bar Volume (K) Forecast, by Application 2019 & 2032
- Table 91: Oceania Side Impact Bar Revenue (million) Forecast, by Application 2019 & 2032
- Table 92: Oceania Side Impact Bar Volume (K) Forecast, by Application 2019 & 2032
- Table 93: Rest of Asia Pacific Side Impact Bar Revenue (million) Forecast, by Application 2019 & 2032
- Table 94: Rest of Asia Pacific Side Impact Bar Volume (K) Forecast, by Application 2019 & 2032
Frequently Asked Questions
1. What is the projected Compound Annual Growth Rate (CAGR) of the Side Impact Bar?
The projected CAGR is approximately 4.3%.
2. Which companies are prominent players in the Side Impact Bar?
Key companies in the market include SEAT, S.A., Inland Steel Company, Wagon Automotive Gmbh, Hyundai Motor Company, COMAU SYSTEMS S.p.A., Toyota Motor Engineering & Manufacturing Corporation, Benteler Ag, Norsk Hydro Asa, Aisin Seiki Co Ltd, Nhk Spring Co., Ltd., Austria Metall Aktiengesellschaft.
3. What are the main segments of the Side Impact Bar?
The market segments include Application, Type.
4. Can you provide details about the market size?
The market size is estimated to be USD 313 million as of 2022.
5. What are some drivers contributing to market growth?
N/A
6. What are the notable trends driving market growth?
N/A
7. Are there any restraints impacting market growth?
N/A
8. Can you provide examples of recent developments in the market?
N/A
9. What pricing options are available for accessing the report?
Pricing options include single-user, multi-user, and enterprise licenses priced at USD 3950.00, USD 5925.00, and USD 7900.00 respectively.
10. Is the market size provided in terms of value or volume?
The market size is provided in terms of value, measured in million and volume, measured in K.
11. Are there any specific market keywords associated with the report?
Yes, the market keyword associated with the report is "Side Impact Bar," which aids in identifying and referencing the specific market segment covered.
12. How do I determine which pricing option suits my needs best?
The pricing options vary based on user requirements and access needs. Individual users may opt for single-user licenses, while businesses requiring broader access may choose multi-user or enterprise licenses for cost-effective access to the report.
13. Are there any additional resources or data provided in the Side Impact Bar report?
While the report offers comprehensive insights, it's advisable to review the specific contents or supplementary materials provided to ascertain if additional resources or data are available.
14. How can I stay updated on further developments or reports in the Side Impact Bar?
To stay informed about further developments, trends, and reports in the Side Impact Bar, consider subscribing to industry newsletters, following relevant companies and organizations, or regularly checking reputable industry news sources and publications.
Methodology
Step 1 - Identification of Relevant Samples Size from Population Database


Step 2 - Approaches for Defining Global Market Size (Value, Volume* & Price*)

Note*: In applicable scenarios
Step 3 - Data Sources
Primary Research
- Web Analytics
- Survey Reports
- Research Institute
- Latest Research Reports
- Opinion Leaders
Secondary Research
- Annual Reports
- White Paper
- Latest Press Release
- Industry Association
- Paid Database
- Investor Presentations

Step 4 - Data Triangulation
Involves using different sources of information in order to increase the validity of a study
These sources are likely to be stakeholders in a program - participants, other researchers, program staff, other community members, and so on.
Then we put all data in single framework & apply various statistical tools to find out the dynamic on the market.
During the analysis stage, feedback from the stakeholder groups would be compared to determine areas of agreement as well as areas of divergence
