

Key Insights
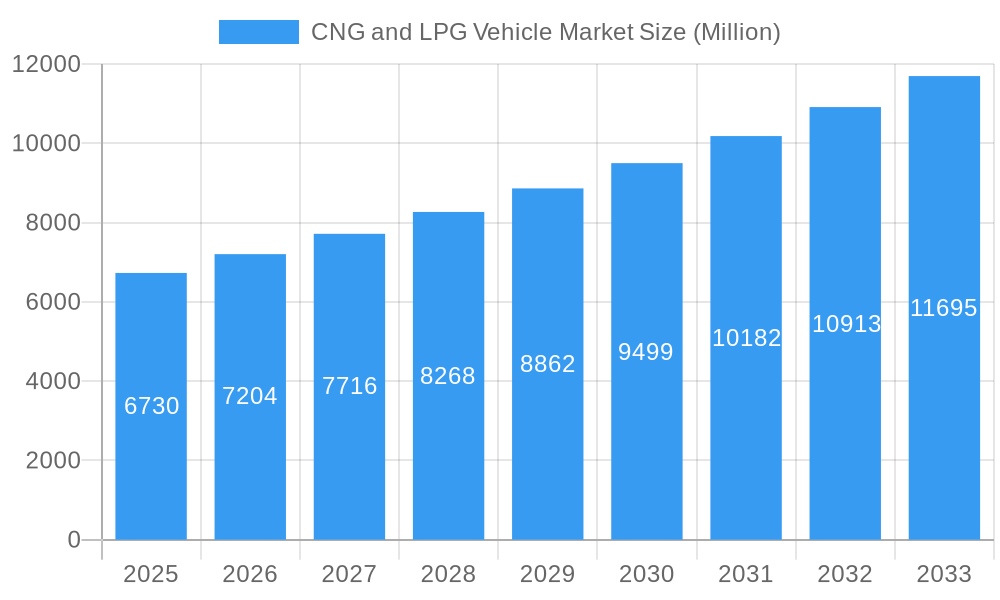
The global CNG and LPG vehicle market, valued at $6.73 billion in 2025, is projected to experience robust growth, driven by stringent emission regulations globally and rising fuel prices. The market's Compound Annual Growth Rate (CAGR) of 7% from 2025 to 2033 indicates a significant expansion. Several factors contribute to this growth. Firstly, governments worldwide are increasingly implementing policies to reduce carbon emissions, making CNG and LPG vehicles, which produce lower emissions than gasoline or diesel vehicles, more attractive. Secondly, the fluctuating and often high prices of gasoline and diesel are making alternative fuels like CNG and LPG economically viable for consumers and businesses. The market is segmented by fuel type (CNG and LPG), vehicle type (passenger cars and commercial vehicles), and sales channel (OEM and retrofitting). While passenger car adoption is significant, the commercial vehicle segment is expected to show substantial growth due to the higher fuel efficiency gains realized in larger vehicles. The retrofitting segment, which involves converting existing vehicles to run on CNG or LPG, represents a significant market opportunity, particularly in regions with mature vehicle fleets. Key players like Nissan, Volkswagen, Tata Motors, and others are actively involved in developing and marketing CNG and LPG vehicles, furthering market expansion. Geographic variations exist, with regions like Asia-Pacific (particularly India and China) exhibiting high growth potential due to increasing vehicle ownership and government support for cleaner fuels.
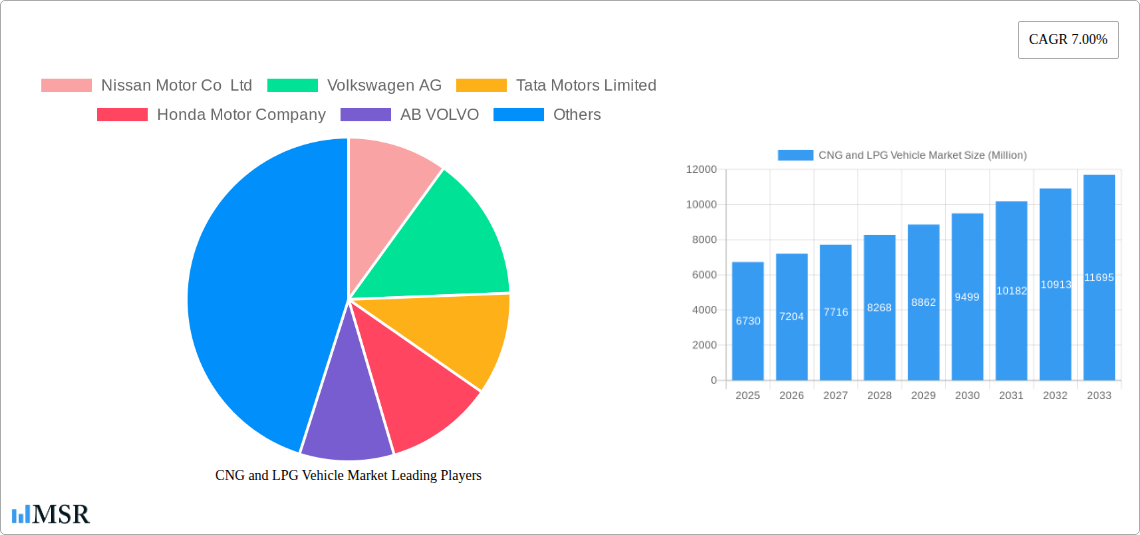
CNG and LPG Vehicle Market Market Size (In Billion)
The North American market, while mature, will see steady growth fueled by regulatory pressures and technological advancements in CNG and LPG vehicle technology. European markets are expected to experience moderate growth driven by environmental concerns and supportive governmental policies. However, the market faces challenges such as the limited refueling infrastructure for CNG and LPG vehicles in certain regions, and higher initial vehicle costs compared to gasoline or diesel alternatives. Despite these challenges, the long-term outlook for the CNG and LPG vehicle market remains positive, with continuous technological advancements, improving infrastructure, and supportive governmental policies expected to drive market expansion throughout the forecast period. The market is expected to surpass $12 billion by 2033 based on the provided CAGR of 7%.
CNG and LPG Vehicle Market Company Market Share
CNG and LPG Vehicle Market: A Comprehensive Report (2019-2033)
This in-depth report provides a comprehensive analysis of the CNG and LPG vehicle market, offering invaluable insights for industry stakeholders, investors, and policymakers. Covering the period 2019-2033, with a base year of 2025, this study examines market dynamics, growth drivers, emerging trends, and key players shaping this evolving sector. The report's findings are supported by rigorous data analysis and detailed market segmentation by fuel type (CNG, LPG), vehicle type (passenger cars, commercial vehicles), and sales channel (OEM, retrofitting). Expect detailed forecasts, competitive landscapes, and actionable recommendations. The market is projected to reach xx Million by 2033.
CNG and LPG Vehicle Market Concentration & Dynamics
The CNG and LPG vehicle market exhibits a moderately concentrated structure, with several major players holding significant market share. However, the landscape is dynamic, influenced by technological advancements, evolving regulations, and strategic mergers and acquisitions (M&A). The market share of the top five players (estimated at xx%) underscores the presence of established industry leaders. However, smaller players and new entrants are increasingly challenging the status quo through innovative technologies and strategic partnerships.
Market Concentration Metrics:
- Top 5 players' market share: xx% (2024)
- Predicted market concentration ratio (CR5): xx% (2033)
- Average M&A deal value: xx Million (2019-2024)
- Number of M&A deals: xx (2019-2024)
Innovation Ecosystems & Regulatory Frameworks:
The market is characterized by a vibrant innovation ecosystem, with continuous development of fuel-efficient engines, improved storage technologies, and advanced safety features. Government regulations play a crucial role in shaping market dynamics, impacting fuel pricing, emission standards, and infrastructure development. The availability of government subsidies and incentives significantly influence market growth.
Substitute Products & End-User Trends:
The primary substitute for CNG and LPG vehicles is electric vehicles (EVs) and, to a lesser extent, vehicles powered by alternative fuels like biofuels. However, the relatively lower cost of CNG and LPG vehicles, coupled with expanding infrastructure and government support in some regions, continues to drive demand. Consumer preferences are shifting towards fuel-efficient and environmentally friendly vehicles, creating opportunities for CNG and LPG vehicles, especially in regions with limited EV infrastructure.
CNG and LPG Vehicle Market Industry Insights & Trends
The CNG and LPG vehicle market is experiencing significant growth, driven by factors such as increasing fuel prices, stringent emission regulations, and growing environmental concerns. The market size was valued at xx Million in 2024 and is projected to reach xx Million by 2033, exhibiting a Compound Annual Growth Rate (CAGR) of xx% during the forecast period (2025-2033). This growth is further fueled by technological advancements leading to improved engine efficiency, longer vehicle life, and reduced emissions. Consumer behavior is also influencing the market, with an increasing preference for affordable and fuel-efficient vehicles, especially in developing economies. Technological disruptions, particularly in fuel storage and engine technology, are playing a crucial role in enhancing the performance and overall appeal of CNG and LPG vehicles.
Key Markets & Segments Leading CNG and LPG Vehicle Market
The CNG and LPG vehicle market demonstrates regional variations in growth. India, with its proactive government initiatives promoting CNG infrastructure and vehicle adoption, is a leading market. Other key markets include countries in Africa and South America with substantial potential for growth driven by factors such as affordability and availability of fuel.
Dominant Segments:
- By Fuel Type: CNG currently holds a larger market share compared to LPG due to its wider availability and lower cost.
- By Vehicle Type: The passenger car segment constitutes a major portion of the market, while the commercial vehicle segment is demonstrating robust growth, particularly in the transportation sector.
- By Sales Channel: OEM (Original Equipment Manufacturer) sales are the primary source of new vehicles, but the retrofitting segment presents growth potential, particularly in existing vehicle fleets.
Drivers of Market Dominance:
- India: Government incentives, expanding CNG infrastructure (planned expansion from 6,000 to 17,700 CNG stations by 2030), and supportive policies are key drivers.
- Nigeria: Government approval for large-scale production of CNG vehicles demonstrates commitment to market development.
- Economic Growth: Economic development in emerging markets fuels demand for affordable transportation solutions, making CNG and LPG vehicles attractive options.
- Infrastructure Development: Investments in CNG and LPG infrastructure are crucial in driving market penetration.
CNG and LPG Vehicle Market Product Developments
Recent advancements in CNG and LPG vehicle technology have significantly improved fuel efficiency, reduced emissions, and enhanced vehicle performance. The introduction of bi-fuel and dual-fuel systems allows for greater flexibility and reduces reliance on a single fuel source. Furthermore, innovations in fuel storage systems have increased storage capacity and reduced the size and weight of tanks. These developments are creating a competitive edge for manufacturers and leading to wider adoption of CNG and LPG vehicles. For example, Maruti Suzuki's launch of the Dzire S-CNG model demonstrates the focus on technological advancements in the market.
Challenges in the CNG and LPG Vehicle Market Market
The CNG and LPG vehicle market faces several challenges, including limited infrastructure in some regions, fluctuating fuel prices, and competition from alternative fuel vehicles like EVs. Regulatory hurdles, especially regarding emission standards and safety regulations, can also pose significant barriers to market entry and growth. Supply chain disruptions can lead to production delays and increased costs. The competition from established automobile manufacturers also contributes to the challenges. These factors collectively impact market growth and need to be carefully considered by industry stakeholders.
Forces Driving CNG and LPG Vehicle Market Growth
Several factors are driving the growth of the CNG and LPG vehicle market. Government policies promoting alternative fuels, increasing fuel costs, and stricter emission regulations are incentivizing the adoption of CNG and LPG vehicles. Technological advancements, such as improved engine efficiency and fuel storage, are making these vehicles more attractive to consumers. Economic growth in developing countries further fuels the demand for affordable and fuel-efficient transportation options. The focus on sustainability also pushes adoption of greener alternatives.
Long-Term Growth Catalysts in the CNG and LPG Vehicle Market
Long-term growth in the CNG and LPG vehicle market hinges on continued innovation in engine technology, fuel storage systems, and infrastructure development. Strategic partnerships between automakers, fuel providers, and government agencies are crucial for market expansion. Exploration of new markets and adoption in various sectors (transportation, logistics, etc.) will unlock significant growth potential. Investing in R&D to improve vehicle efficiency and reduce emissions will further drive growth.
Emerging Opportunities in CNG and LPG Vehicle Market
Emerging opportunities exist in expanding CNG and LPG vehicle adoption in developing economies, coupled with innovations in dual-fuel and flexible-fuel vehicle technologies. The rise of shared mobility services, using CNG and LPG vehicles, presents a potential market expansion avenue. Moreover, exploring biogas as a fuel source can offer a sustainable and cost-effective alternative. These factors contribute to the overall promising market outlook.
Leading Players in the CNG and LPG Vehicle Market Sector
Key Milestones in CNG and LPG Vehicle Market Industry
- March 2022: Maruti Suzuki India Limited launched Dzire with S-CNG technology, featuring a K-series Dual Jet, Dual VVT 1.2L engine.
- January 2023: Suzuki Motor Corporation announced plans to power CNG vehicles using cow dung, collaborating with the National Dairy Development Board.
- June 2023: The National Economic Council (NEC) in Nigeria approved large-scale production of CNG vehicles.
- November 2023: The Indian government committed to expanding CNG stations from 6,000 to 17,700 by 2030, launching the 12th City Gas Distribution (CGD) bidding round.
Strategic Outlook for CNG and LPG Vehicle Market Market
The CNG and LPG vehicle market presents significant growth potential in the coming years, driven by technological advancements, supportive government policies, and increasing consumer demand for affordable and fuel-efficient transportation. Strategic partnerships and investments in infrastructure development are key to unlocking this potential. Focus on sustainability and environmental impact will further drive market expansion, creating a positive and beneficial growth trajectory.
CNG and LPG Vehicle Market Segmentation
-
1. Fuel Type
- 1.1. Compressed Natural Gas (CNG)
- 1.2. Liquefied Petroleum Gas (LPG)
-
2. Vehicle Type
- 2.1. Passenger Cars
- 2.2. Commercial Vehicles
-
3. Sales Channel
- 3.1. OEM
- 3.2. Retrofitting
CNG and LPG Vehicle Market Segmentation By Geography
-
1. North America
- 1.1. United States
- 1.2. Canada
- 1.3. Rest of North America
-
2. Europe
- 2.1. Germany
- 2.2. United Kingdom
- 2.3. France
- 2.4. Italy
- 2.5. Spain
- 2.6. Rest of Europe
-
3. Asia Pacific
- 3.1. India
- 3.2. China
- 3.3. Japan
- 3.4. South Korea
- 3.5. Rest of Asia Pacific
-
4. Rest of the World
- 4.1. South America
- 4.2. Middle East and Africa
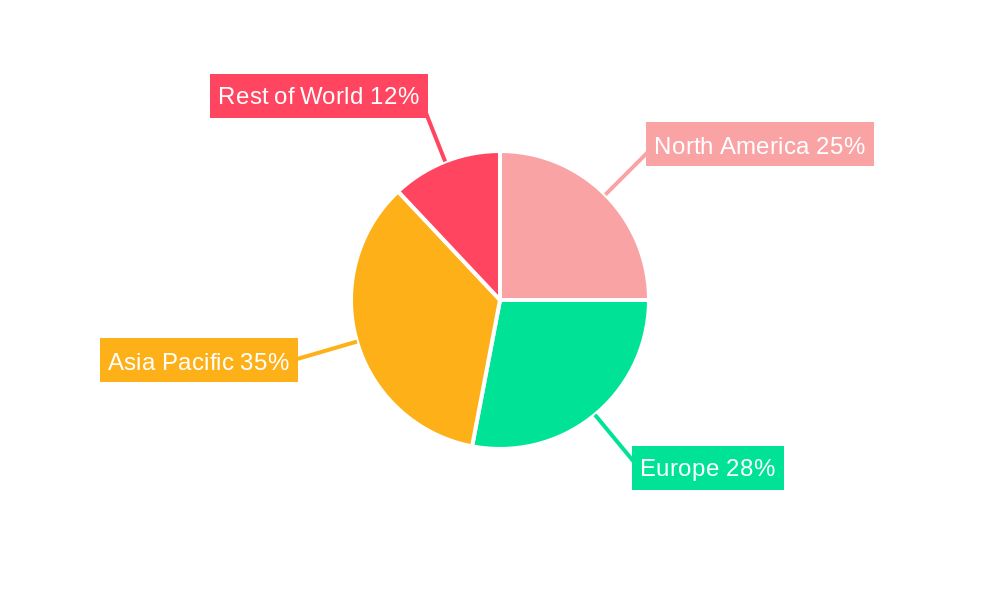
CNG and LPG Vehicle Market Regional Market Share
Geographic Coverage of CNG and LPG Vehicle Market
CNG and LPG Vehicle Market REPORT HIGHLIGHTS
| Aspects | Details |
|---|---|
| Study Period | 2020-2034 |
| Base Year | 2025 |
| Estimated Year | 2026 |
| Forecast Period | 2026-2034 |
| Historical Period | 2020-2025 |
| Growth Rate | CAGR of 4.75% from 2020-2034 |
| Segmentation |
|
Table of Contents
- 1. Introduction
- 1.1. Research Scope
- 1.2. Market Segmentation
- 1.3. Research Objective
- 1.4. Definitions and Assumptions
- 2. Executive Summary
- 2.1. Market Snapshot
- 3. Market Dynamics
- 3.1. Market Drivers
- 3.2. Market Restrains
- 3.3. Market Trends
- 3.4. Market Opportunities
- 4. Market Factor Analysis
- 4.1. Porters Five Forces
- 4.1.1. Bargaining Power of Suppliers
- 4.1.2. Bargaining Power of Buyers
- 4.1.3. Threat of New Entrants
- 4.1.4. Threat of Substitutes
- 4.1.5. Competitive Rivalry
- 4.2. PESTEL analysis
- 4.3. BCG Analysis
- 4.3.1. Stars (High Growth, High Market Share)
- 4.3.2. Cash Cows (Low Growth, High Market Share)
- 4.3.3. Question Mark (High Growth, Low Market Share)
- 4.3.4. Dogs (Low Growth, Low Market Share)
- 4.4. Ansoff Matrix Analysis
- 4.5. Supply Chain Analysis
- 4.6. Regulatory Landscape
- 4.7. Current Market Potential and Opportunity Assessment (TAM–SAM–SOM Framework)
- 4.8. MSR Analyst Note
- 4.1. Porters Five Forces
- 5. Market Analysis, Insights and Forecast 2021-2033
- 5.1. Market Analysis, Insights and Forecast - by Fuel Type
- 5.1.1. Compressed Natural Gas (CNG)
- 5.1.2. Liquefied Petroleum Gas (LPG)
- 5.2. Market Analysis, Insights and Forecast - by Vehicle Type
- 5.2.1. Passenger Cars
- 5.2.2. Commercial Vehicles
- 5.3. Market Analysis, Insights and Forecast - by Sales Channel
- 5.3.1. OEM
- 5.3.2. Retrofitting
- 5.4. Market Analysis, Insights and Forecast - by Region
- 5.4.1. North America
- 5.4.2. Europe
- 5.4.3. Asia Pacific
- 5.4.4. Rest of the World
- 5.1. Market Analysis, Insights and Forecast - by Fuel Type
- 6. Global CNG and LPG Vehicle Market Analysis, Insights and Forecast, 2021-2033
- 6.1. Market Analysis, Insights and Forecast - by Fuel Type
- 6.1.1. Compressed Natural Gas (CNG)
- 6.1.2. Liquefied Petroleum Gas (LPG)
- 6.2. Market Analysis, Insights and Forecast - by Vehicle Type
- 6.2.1. Passenger Cars
- 6.2.2. Commercial Vehicles
- 6.3. Market Analysis, Insights and Forecast - by Sales Channel
- 6.3.1. OEM
- 6.3.2. Retrofitting
- 6.1. Market Analysis, Insights and Forecast - by Fuel Type
- 7. North America CNG and LPG Vehicle Market Analysis, Insights and Forecast, 2020-2032
- 7.1. Market Analysis, Insights and Forecast - by Fuel Type
- 7.1.1. Compressed Natural Gas (CNG)
- 7.1.2. Liquefied Petroleum Gas (LPG)
- 7.2. Market Analysis, Insights and Forecast - by Vehicle Type
- 7.2.1. Passenger Cars
- 7.2.2. Commercial Vehicles
- 7.3. Market Analysis, Insights and Forecast - by Sales Channel
- 7.3.1. OEM
- 7.3.2. Retrofitting
- 7.1. Market Analysis, Insights and Forecast - by Fuel Type
- 8. Europe CNG and LPG Vehicle Market Analysis, Insights and Forecast, 2020-2032
- 8.1. Market Analysis, Insights and Forecast - by Fuel Type
- 8.1.1. Compressed Natural Gas (CNG)
- 8.1.2. Liquefied Petroleum Gas (LPG)
- 8.2. Market Analysis, Insights and Forecast - by Vehicle Type
- 8.2.1. Passenger Cars
- 8.2.2. Commercial Vehicles
- 8.3. Market Analysis, Insights and Forecast - by Sales Channel
- 8.3.1. OEM
- 8.3.2. Retrofitting
- 8.1. Market Analysis, Insights and Forecast - by Fuel Type
- 9. Asia Pacific CNG and LPG Vehicle Market Analysis, Insights and Forecast, 2020-2032
- 9.1. Market Analysis, Insights and Forecast - by Fuel Type
- 9.1.1. Compressed Natural Gas (CNG)
- 9.1.2. Liquefied Petroleum Gas (LPG)
- 9.2. Market Analysis, Insights and Forecast - by Vehicle Type
- 9.2.1. Passenger Cars
- 9.2.2. Commercial Vehicles
- 9.3. Market Analysis, Insights and Forecast - by Sales Channel
- 9.3.1. OEM
- 9.3.2. Retrofitting
- 9.1. Market Analysis, Insights and Forecast - by Fuel Type
- 10. Rest of the World CNG and LPG Vehicle Market Analysis, Insights and Forecast, 2020-2032
- 10.1. Market Analysis, Insights and Forecast - by Fuel Type
- 10.1.1. Compressed Natural Gas (CNG)
- 10.1.2. Liquefied Petroleum Gas (LPG)
- 10.2. Market Analysis, Insights and Forecast - by Vehicle Type
- 10.2.1. Passenger Cars
- 10.2.2. Commercial Vehicles
- 10.3. Market Analysis, Insights and Forecast - by Sales Channel
- 10.3.1. OEM
- 10.3.2. Retrofitting
- 10.1. Market Analysis, Insights and Forecast - by Fuel Type
- 11. Competitive Analysis
- 11.1. Company Profiles
- 11.1.1 Nissan Motor Co Ltd
- 11.1.1.1. Company Overview
- 11.1.1.2. Products
- 11.1.1.3. Company Financials
- 11.1.1.4. SWOT Analysis
- 11.1.2 Volkswagen AG
- 11.1.2.1. Company Overview
- 11.1.2.2. Products
- 11.1.2.3. Company Financials
- 11.1.2.4. SWOT Analysis
- 11.1.3 Tata Motors Limited
- 11.1.3.1. Company Overview
- 11.1.3.2. Products
- 11.1.3.3. Company Financials
- 11.1.3.4. SWOT Analysis
- 11.1.4 Honda Motor Company
- 11.1.4.1. Company Overview
- 11.1.4.2. Products
- 11.1.4.3. Company Financials
- 11.1.4.4. SWOT Analysis
- 11.1.5 AB VOLVO
- 11.1.5.1. Company Overview
- 11.1.5.2. Products
- 11.1.5.3. Company Financials
- 11.1.5.4. SWOT Analysis
- 11.1.6 Hyundai Motor Company
- 11.1.6.1. Company Overview
- 11.1.6.2. Products
- 11.1.6.3. Company Financials
- 11.1.6.4. SWOT Analysis
- 11.1.7 Traton SE*List Not Exhaustive
- 11.1.7.1. Company Overview
- 11.1.7.2. Products
- 11.1.7.3. Company Financials
- 11.1.7.4. SWOT Analysis
- 11.1.8 Suzuki Motor Corporation
- 11.1.8.1. Company Overview
- 11.1.8.2. Products
- 11.1.8.3. Company Financials
- 11.1.8.4. SWOT Analysis
- 11.1.9 IVECO SpA
- 11.1.9.1. Company Overview
- 11.1.9.2. Products
- 11.1.9.3. Company Financials
- 11.1.9.4. SWOT Analysis
- 11.1.10 Ford Motor Company
- 11.1.10.1. Company Overview
- 11.1.10.2. Products
- 11.1.10.3. Company Financials
- 11.1.10.4. SWOT Analysis
- 11.1.1 Nissan Motor Co Ltd
- 11.2. Market Entropy
- 11.2.1 Company's Key Areas Served
- 11.2.2 Recent Developments
- 11.3. Company Market Share Analysis 2025
- 11.3.1 Top 5 Companies Market Share Analysis
- 11.3.2 Top 3 Companies Market Share Analysis
- 11.4. List of Potential Customers
- 12. Research Methodology
List of Figures
- Figure 1: Global CNG and LPG Vehicle Market Revenue Breakdown (billion, %) by Region 2025 & 2033
- Figure 2: North America CNG and LPG Vehicle Market Revenue (billion), by Fuel Type 2025 & 2033
- Figure 3: North America CNG and LPG Vehicle Market Revenue Share (%), by Fuel Type 2025 & 2033
- Figure 4: North America CNG and LPG Vehicle Market Revenue (billion), by Vehicle Type 2025 & 2033
- Figure 5: North America CNG and LPG Vehicle Market Revenue Share (%), by Vehicle Type 2025 & 2033
- Figure 6: North America CNG and LPG Vehicle Market Revenue (billion), by Sales Channel 2025 & 2033
- Figure 7: North America CNG and LPG Vehicle Market Revenue Share (%), by Sales Channel 2025 & 2033
- Figure 8: North America CNG and LPG Vehicle Market Revenue (billion), by Country 2025 & 2033
- Figure 9: North America CNG and LPG Vehicle Market Revenue Share (%), by Country 2025 & 2033
- Figure 10: Europe CNG and LPG Vehicle Market Revenue (billion), by Fuel Type 2025 & 2033
- Figure 11: Europe CNG and LPG Vehicle Market Revenue Share (%), by Fuel Type 2025 & 2033
- Figure 12: Europe CNG and LPG Vehicle Market Revenue (billion), by Vehicle Type 2025 & 2033
- Figure 13: Europe CNG and LPG Vehicle Market Revenue Share (%), by Vehicle Type 2025 & 2033
- Figure 14: Europe CNG and LPG Vehicle Market Revenue (billion), by Sales Channel 2025 & 2033
- Figure 15: Europe CNG and LPG Vehicle Market Revenue Share (%), by Sales Channel 2025 & 2033
- Figure 16: Europe CNG and LPG Vehicle Market Revenue (billion), by Country 2025 & 2033
- Figure 17: Europe CNG and LPG Vehicle Market Revenue Share (%), by Country 2025 & 2033
- Figure 18: Asia Pacific CNG and LPG Vehicle Market Revenue (billion), by Fuel Type 2025 & 2033
- Figure 19: Asia Pacific CNG and LPG Vehicle Market Revenue Share (%), by Fuel Type 2025 & 2033
- Figure 20: Asia Pacific CNG and LPG Vehicle Market Revenue (billion), by Vehicle Type 2025 & 2033
- Figure 21: Asia Pacific CNG and LPG Vehicle Market Revenue Share (%), by Vehicle Type 2025 & 2033
- Figure 22: Asia Pacific CNG and LPG Vehicle Market Revenue (billion), by Sales Channel 2025 & 2033
- Figure 23: Asia Pacific CNG and LPG Vehicle Market Revenue Share (%), by Sales Channel 2025 & 2033
- Figure 24: Asia Pacific CNG and LPG Vehicle Market Revenue (billion), by Country 2025 & 2033
- Figure 25: Asia Pacific CNG and LPG Vehicle Market Revenue Share (%), by Country 2025 & 2033
- Figure 26: Rest of the World CNG and LPG Vehicle Market Revenue (billion), by Fuel Type 2025 & 2033
- Figure 27: Rest of the World CNG and LPG Vehicle Market Revenue Share (%), by Fuel Type 2025 & 2033
- Figure 28: Rest of the World CNG and LPG Vehicle Market Revenue (billion), by Vehicle Type 2025 & 2033
- Figure 29: Rest of the World CNG and LPG Vehicle Market Revenue Share (%), by Vehicle Type 2025 & 2033
- Figure 30: Rest of the World CNG and LPG Vehicle Market Revenue (billion), by Sales Channel 2025 & 2033
- Figure 31: Rest of the World CNG and LPG Vehicle Market Revenue Share (%), by Sales Channel 2025 & 2033
- Figure 32: Rest of the World CNG and LPG Vehicle Market Revenue (billion), by Country 2025 & 2033
- Figure 33: Rest of the World CNG and LPG Vehicle Market Revenue Share (%), by Country 2025 & 2033
List of Tables
- Table 1: Global CNG and LPG Vehicle Market Revenue billion Forecast, by Fuel Type 2020 & 2033
- Table 2: Global CNG and LPG Vehicle Market Revenue billion Forecast, by Vehicle Type 2020 & 2033
- Table 3: Global CNG and LPG Vehicle Market Revenue billion Forecast, by Sales Channel 2020 & 2033
- Table 4: Global CNG and LPG Vehicle Market Revenue billion Forecast, by Region 2020 & 2033
- Table 5: Global CNG and LPG Vehicle Market Revenue billion Forecast, by Fuel Type 2020 & 2033
- Table 6: Global CNG and LPG Vehicle Market Revenue billion Forecast, by Vehicle Type 2020 & 2033
- Table 7: Global CNG and LPG Vehicle Market Revenue billion Forecast, by Sales Channel 2020 & 2033
- Table 8: Global CNG and LPG Vehicle Market Revenue billion Forecast, by Country 2020 & 2033
- Table 9: United States CNG and LPG Vehicle Market Revenue (billion) Forecast, by Application 2020 & 2033
- Table 10: Canada CNG and LPG Vehicle Market Revenue (billion) Forecast, by Application 2020 & 2033
- Table 11: Rest of North America CNG and LPG Vehicle Market Revenue (billion) Forecast, by Application 2020 & 2033
- Table 12: Global CNG and LPG Vehicle Market Revenue billion Forecast, by Fuel Type 2020 & 2033
- Table 13: Global CNG and LPG Vehicle Market Revenue billion Forecast, by Vehicle Type 2020 & 2033
- Table 14: Global CNG and LPG Vehicle Market Revenue billion Forecast, by Sales Channel 2020 & 2033
- Table 15: Global CNG and LPG Vehicle Market Revenue billion Forecast, by Country 2020 & 2033
- Table 16: Germany CNG and LPG Vehicle Market Revenue (billion) Forecast, by Application 2020 & 2033
- Table 17: United Kingdom CNG and LPG Vehicle Market Revenue (billion) Forecast, by Application 2020 & 2033
- Table 18: France CNG and LPG Vehicle Market Revenue (billion) Forecast, by Application 2020 & 2033
- Table 19: Italy CNG and LPG Vehicle Market Revenue (billion) Forecast, by Application 2020 & 2033
- Table 20: Spain CNG and LPG Vehicle Market Revenue (billion) Forecast, by Application 2020 & 2033
- Table 21: Rest of Europe CNG and LPG Vehicle Market Revenue (billion) Forecast, by Application 2020 & 2033
- Table 22: Global CNG and LPG Vehicle Market Revenue billion Forecast, by Fuel Type 2020 & 2033
- Table 23: Global CNG and LPG Vehicle Market Revenue billion Forecast, by Vehicle Type 2020 & 2033
- Table 24: Global CNG and LPG Vehicle Market Revenue billion Forecast, by Sales Channel 2020 & 2033
- Table 25: Global CNG and LPG Vehicle Market Revenue billion Forecast, by Country 2020 & 2033
- Table 26: India CNG and LPG Vehicle Market Revenue (billion) Forecast, by Application 2020 & 2033
- Table 27: China CNG and LPG Vehicle Market Revenue (billion) Forecast, by Application 2020 & 2033
- Table 28: Japan CNG and LPG Vehicle Market Revenue (billion) Forecast, by Application 2020 & 2033
- Table 29: South Korea CNG and LPG Vehicle Market Revenue (billion) Forecast, by Application 2020 & 2033
- Table 30: Rest of Asia Pacific CNG and LPG Vehicle Market Revenue (billion) Forecast, by Application 2020 & 2033
- Table 31: Global CNG and LPG Vehicle Market Revenue billion Forecast, by Fuel Type 2020 & 2033
- Table 32: Global CNG and LPG Vehicle Market Revenue billion Forecast, by Vehicle Type 2020 & 2033
- Table 33: Global CNG and LPG Vehicle Market Revenue billion Forecast, by Sales Channel 2020 & 2033
- Table 34: Global CNG and LPG Vehicle Market Revenue billion Forecast, by Country 2020 & 2033
- Table 35: South America CNG and LPG Vehicle Market Revenue (billion) Forecast, by Application 2020 & 2033
- Table 36: Middle East and Africa CNG and LPG Vehicle Market Revenue (billion) Forecast, by Application 2020 & 2033
Frequently Asked Questions
1. What is the projected Compound Annual Growth Rate (CAGR) of the CNG and LPG Vehicle Market?
The projected CAGR is approximately 4.75%.
2. Which companies are prominent players in the CNG and LPG Vehicle Market?
Key companies in the market include Nissan Motor Co Ltd, Volkswagen AG, Tata Motors Limited, Honda Motor Company, AB VOLVO, Hyundai Motor Company, Traton SE*List Not Exhaustive, Suzuki Motor Corporation, IVECO SpA, Ford Motor Company.
3. What are the main segments of the CNG and LPG Vehicle Market?
The market segments include Fuel Type, Vehicle Type, Sales Channel.
4. Can you provide details about the market size?
The market size is estimated to be USD 6.05 billion as of 2022.
5. What are some drivers contributing to market growth?
Increase in Demand for Clean Energy Driving the Market.
6. What are the notable trends driving market growth?
Commercial Vehicles Fueling the Demand for CNG and LPG Vehicle.
7. Are there any restraints impacting market growth?
Rising Safety Concerns is Antcipated to Restrain the Market.
8. Can you provide examples of recent developments in the market?
November 2023: The government of India committed to significantly expanding the network of CNG stations, setting an ambitious target to increase the count from 6,000 to 17,700 by 2030. In October, this initiative gained further momentum with the launch of the 12th City Gas Distribution (CGD) bidding round. This strategic move is aimed at closing the gaps in the existing gas infrastructure, a step that is expected to substantially drive the growth of the CNG vehicle market.
9. What pricing options are available for accessing the report?
Pricing options include single-user, multi-user, and enterprise licenses priced at USD 4750, USD 5250, and USD 8750 respectively.
10. Is the market size provided in terms of value or volume?
The market size is provided in terms of value, measured in billion.
11. Are there any specific market keywords associated with the report?
Yes, the market keyword associated with the report is "CNG and LPG Vehicle Market," which aids in identifying and referencing the specific market segment covered.
12. How do I determine which pricing option suits my needs best?
The pricing options vary based on user requirements and access needs. Individual users may opt for single-user licenses, while businesses requiring broader access may choose multi-user or enterprise licenses for cost-effective access to the report.
13. Are there any additional resources or data provided in the CNG and LPG Vehicle Market report?
While the report offers comprehensive insights, it's advisable to review the specific contents or supplementary materials provided to ascertain if additional resources or data are available.
14. How can I stay updated on further developments or reports in the CNG and LPG Vehicle Market?
To stay informed about further developments, trends, and reports in the CNG and LPG Vehicle Market, consider subscribing to industry newsletters, following relevant companies and organizations, or regularly checking reputable industry news sources and publications.
Methodology
Step 1 - Identification of Relevant Samples Size from Population Database


Step 2 - Approaches for Defining Global Market Size (Value, Volume* & Price*)

Note*: In applicable scenarios
Step 3 - Data Sources
Primary Research
- Web Analytics
- Survey Reports
- Research Institute
- Latest Research Reports
- Opinion Leaders
Secondary Research
- Annual Reports
- White Paper
- Latest Press Release
- Industry Association
- Paid Database
- Investor Presentations

Step 4 - Data Triangulation
Involves using different sources of information in order to increase the validity of a study
These sources are likely to be stakeholders in a program - participants, other researchers, program staff, other community members, and so on.
Then we put all data in single framework & apply various statistical tools to find out the dynamic on the market.
During the analysis stage, feedback from the stakeholder groups would be compared to determine areas of agreement as well as areas of divergence