

Key Insights
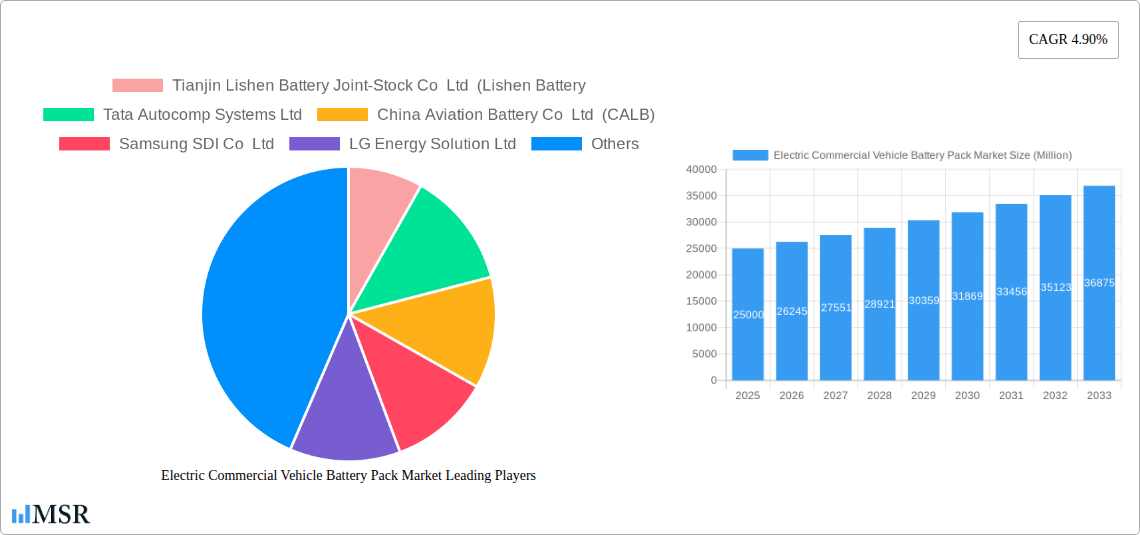
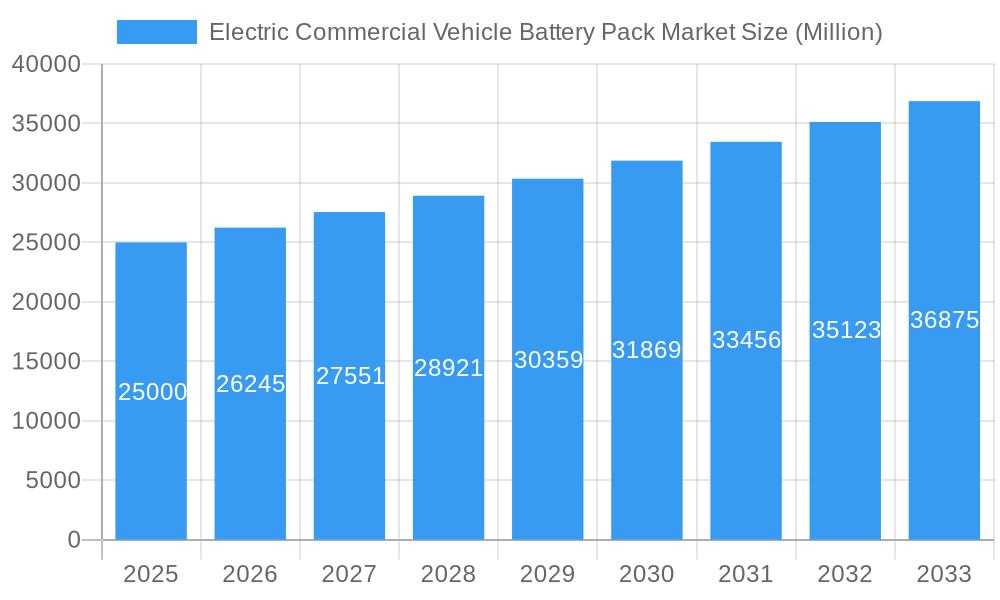
The Electric Commercial Vehicle Battery Pack Market is poised for substantial expansion, driven by a confluence of accelerating decarbonization efforts, government incentives, and advancements in battery technology. With a current market size estimated at approximately USD 25,000 million, the sector is projected to witness a robust Compound Annual Growth Rate (CAGR) of 4.90% from 2025 to 2033. This growth is underpinned by the increasing adoption of electric buses, light commercial vehicles (LCVs), and medium and heavy-duty trucks (M&HDTs) globally. Key market drivers include stringent emission regulations, rising fuel costs, and the growing demand for sustainable logistics solutions. The evolution of battery chemistries, particularly the prevalence of LFP (Lithium Iron Phosphate) and NCM (Nickel Cobalt Manganese), alongside advancements in battery form factors like prismatic and pouch cells, are contributing to improved energy density, safety, and cost-effectiveness, further fueling market penetration. The expansion of charging infrastructure and the continuous innovation in battery management systems are also critical factors supporting this upward trajectory.
Electric Commercial Vehicle Battery Pack Market Market Size (In Billion)
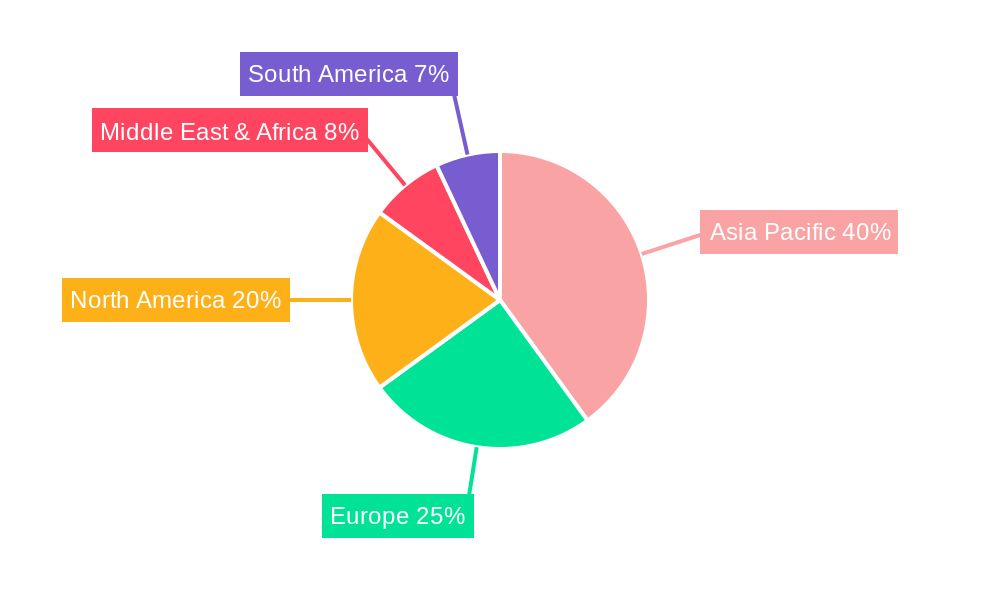
The market landscape is characterized by intense competition and significant investments from leading players such as CATL, BYD, LG Energy Solution, and Samsung SDI. These companies are at the forefront of developing battery packs with varying capacities, ranging from less than 15 kWh to above 80 kWh, catering to the diverse operational needs of commercial vehicles. The increasing focus on reducing the reliance on cobalt in battery materials and the exploration of nickel and natural graphite are key trends shaping the competitive environment. Restraints such as the high initial cost of electric commercial vehicles and the limited availability of charging infrastructure in certain regions are being addressed through policy support and technological advancements. Geographically, the Asia Pacific region, led by China, is expected to dominate the market, followed by Europe and North America, owing to strong government support for EV adoption and a well-established automotive manufacturing base.
Electric Commercial Vehicle Battery Pack Market Company Market Share
This in-depth report provides a detailed analysis of the global Electric Commercial Vehicle Battery Pack Market. Covering the historical period from 2019 to 2024, a base year of 2025, and a forecast period extending to 2033, this study offers critical insights into market dynamics, growth drivers, challenges, and emerging opportunities. With an estimated market size of $XX Billion in 2025, this report is an indispensable resource for battery manufacturers, automotive OEMs, component suppliers, investors, and policymakers seeking to navigate the rapidly evolving landscape of electric commercial vehicle (eCV) battery technology.
Electric Commercial Vehicle Battery Pack Market Market Concentration & Dynamics
The Electric Commercial Vehicle Battery Pack Market is characterized by a moderate to high concentration, with leading players like Contemporary Amperex Technology Co Ltd (CATL) and BYD Company Ltd holding significant market share. The innovation ecosystem is driven by intense R&D in battery chemistry, cell design, and thermal management systems to enhance energy density, safety, and lifespan. Regulatory frameworks globally are increasingly supportive of eCV adoption, incentivizing manufacturers and fleet operators through subsidies and emission standards. Substitute products, primarily internal combustion engine (ICE) vehicles, are facing mounting pressure due to stricter environmental regulations and the rising total cost of ownership (TCO) of electric alternatives. End-user trends indicate a strong preference for longer range, faster charging capabilities, and robust battery performance, particularly for LCV and M&HDT segments. M&A activities are on the rise as companies seek to consolidate supply chains, acquire advanced technologies, and expand their global manufacturing footprint. For instance, we've observed XX M&A deals in the historical period (2019-2024). Key market share players in the eCV battery pack sector include:
- Contemporary Amperex Technology Co Ltd (CATL)
- BYD Company Ltd
- LG Energy Solution Ltd
- SK Innovation Co Ltd
- Samsung SDI Co Ltd
Electric Commercial Vehicle Battery Pack Market Industry Insights & Trends
The Electric Commercial Vehicle Battery Pack Market is experiencing exponential growth, projected to reach an estimated $XXX Billion by 2025 and achieve a robust CAGR of XX% from 2025 to 2033. This surge is primarily fueled by global decarbonization initiatives, stringent emission norms, and the increasing operational efficiency offered by electric powertrains for commercial fleets. Technological advancements in battery chemistry, particularly the widespread adoption of Lithium Iron Phosphate (LFP) and Nickel Cobalt Manganese (NCM) chemistries, are enhancing energy density and reducing costs. The development of faster charging technologies and improved battery management systems (BMS) are addressing range anxiety and operational downtime concerns for fleet operators. Evolving consumer behaviors, driven by a growing awareness of sustainability and the economic benefits of lower operating costs, are accelerating the transition to eCVs across various applications, including last-mile delivery, public transportation, and long-haul logistics. The market is witnessing a significant shift towards higher capacity battery packs (Above 80 kWh) to meet the demanding requirements of heavy-duty trucks and buses. The demand for battery packs with LFP chemistry is expected to grow at a CAGR of XX% during the forecast period, driven by its cost-effectiveness and enhanced safety features, making it a dominant force in the Battery Chemistry segment. Furthermore, the Propulsion Type segment is dominated by Battery Electric Vehicles (BEV), which are expected to account for over XX% of the market share by 2025, owing to their zero-emission capabilities. The Body Type segment is experiencing robust growth in LCVs and M&HDTs, with LCVs projected to grow at a CAGR of XX% due to their increasing use in urban logistics and last-mile delivery services. The Battery Form segment sees a growing preference for Prismatic and Pouch formats due to their superior volumetric energy density and ease of integration.
Key Markets & Segments Leading Electric Commercial Vehicle Battery Pack Market
The Asia Pacific region is the undisputed leader in the Electric Commercial Vehicle Battery Pack Market, driven by strong government support for electric mobility, a well-established manufacturing base, and a rapidly expanding eCV fleet. China, in particular, dominates this market due to its ambitious electrification targets and extensive investments in battery technology and charging infrastructure.
- Dominant Region: Asia Pacific, with an estimated market share of XX% in 2025.
- Dominant Country: China, expected to contribute over XX% to the global eCV battery pack market in 2025.
Within the segment breakdown, several areas exhibit significant dominance and growth potential:
- Body Type:
- M&HDT (Medium & Heavy-Duty Trucks): This segment is a major growth engine due to the increasing demand for electrification in freight transportation and the implementation of stringent emission regulations for commercial vehicles. Government mandates for zero-emission fleets in urban centers are further propelling this segment.
- LCV (Light Commercial Vehicles): The rise of e-commerce and last-mile delivery services is driving substantial demand for LCVs, making this segment a critical contributor to market growth.
- Propulsion Type:
- BEV (Battery Electric Vehicle): BEVs are overwhelmingly dominant across all commercial vehicle segments due to their zero-emission credentials and improving TCO compared to traditional powertrains.
- Battery Chemistry:
- LFP (Lithium Iron Phosphate): LFP is gaining significant traction due to its cost-effectiveness, improved safety, and longer cycle life, making it an attractive choice for many commercial applications, especially for LCVs and urban buses. Its market share is projected to grow from XX% in 2025 to XX% by 2033.
- NCM (Nickel Cobalt Manganese): NCM chemistries continue to be important for applications requiring higher energy density and longer ranges, such as long-haul trucks and intercity buses.
- Capacity:
- Above 80 kWh: This capacity range is crucial for M&HDTs and buses, offering the necessary range and power for demanding commercial operations. The demand for these higher capacity packs is expected to surge as electrification penetrates heavier vehicle classes.
- Battery Form:
- Prismatic & Pouch: These form factors offer advantages in terms of packaging efficiency and thermal management, making them increasingly preferred for integration into commercial vehicle chassis.
- Component:
- Cathode: The cathode material is a critical determinant of battery performance and cost. Advancements in cathode material technology are a key focus for market players.
- Material Type:
- Lithium: As the core element in all lithium-ion batteries, demand for lithium is intrinsically linked to the growth of the eCV battery market.
- Nickel: Nickel content in NCM batteries directly influences energy density, making it a vital material for performance-driven applications.
- Natural Graphite: This is a key material for anode production, and its availability and cost significantly impact battery pack pricing.
Electric Commercial Vehicle Battery Pack Market Product Developments
The Electric Commercial Vehicle Battery Pack Market is witnessing rapid product innovation focused on enhancing performance, safety, and cost-effectiveness. Developments include the integration of solid-state battery technologies, which promise higher energy densities and improved safety profiles. Advanced thermal management systems are being developed to ensure optimal battery operation in diverse environmental conditions, crucial for commercial applications. The focus is also on modular battery pack designs that allow for easier maintenance, repair, and scalability to meet varied vehicle requirements. Furthermore, innovations in battery management systems (BMS) are enabling more precise control over charging, discharging, and cell balancing, leading to extended battery life and improved overall vehicle efficiency. The development of battery packs with integrated cooling and heating functionalities is also a key trend, ensuring reliable performance across extreme temperatures.
Challenges in the Electric Commercial Vehicle Battery Pack Market Market
The Electric Commercial Vehicle Battery Pack Market faces several hurdles to widespread adoption. High upfront costs of battery packs remain a significant barrier for fleet operators, despite the potential for lower TCO. The current charging infrastructure, particularly for heavy-duty vehicles, is still developing and often insufficient to support large-scale fleet electrification. Battery degradation over time and the associated replacement costs present long-term concerns. Supply chain disruptions for critical raw materials like lithium, cobalt, and nickel, coupled with price volatility, pose significant risks. Furthermore, stringent safety regulations and the need for robust recycling processes for end-of-life batteries require continuous innovation and investment. The market faces an estimated deficit of XX% in charging infrastructure required to support current eCV adoption targets.
Forces Driving Electric Commercial Vehicle Battery Pack Market Growth
The growth of the Electric Commercial Vehicle Battery Pack Market is propelled by a confluence of powerful forces. Government incentives, including tax credits, subsidies, and favorable charging infrastructure policies, are significantly reducing the financial burden of eCV adoption. Stringent emission regulations and urban low-emission zones are compelling fleet operators to transition to zero-emission vehicles. Technological advancements in battery chemistry, such as the increasing adoption of LFP for cost and safety benefits, and improvements in energy density, are making electric powertrains more viable for commercial applications. The declining cost of battery packs, driven by economies of scale and manufacturing efficiencies, is making electric commercial vehicles more competitive on a total cost of ownership basis. The growing corporate sustainability mandates and the demand for greener supply chains from consumers are also acting as strong catalysts for eCV adoption.
Challenges in the Electric Commercial Vehicle Battery Pack Market Market
The long-term growth of the Electric Commercial Vehicle Battery Pack Market will be significantly influenced by the ongoing development and refinement of battery technologies and supporting ecosystems. Key growth catalysts include the advancement of solid-state battery technology, which holds the promise of substantially higher energy densities and enhanced safety, potentially enabling longer ranges and faster charging for commercial vehicles. The establishment of a robust and widespread charging infrastructure, particularly for high-power charging solutions required by heavy-duty trucks, is crucial for overcoming range anxiety and operational limitations. The development of efficient and scalable battery recycling processes will be vital for the circular economy of battery materials and to mitigate environmental concerns associated with battery disposal. Furthermore, strategic partnerships between battery manufacturers, automotive OEMs, and energy providers will foster innovation and accelerate market penetration. The growth of the battery-as-a-service (BaaS) model could also unlock new avenues for adoption by reducing the upfront capital expenditure for fleet operators.
Emerging Opportunities in Electric Commercial Vehicle Battery Pack Market
Emerging opportunities in the Electric Commercial Vehicle Battery Pack Market are vast and varied. The burgeoning demand for electric buses in public transportation networks worldwide presents a significant avenue for growth. The electrification of last-mile delivery services, driven by the e-commerce boom, offers substantial potential for LCV battery pack sales. Innovations in battery swapping technology could revolutionize operational efficiency for certain fleet types, reducing downtime and increasing vehicle utilization. The development of advanced battery materials, such as silicon anodes and next-generation cathode chemistries, offers the potential for higher energy density and faster charging capabilities. Furthermore, the increasing focus on vehicle-to-grid (V2G) technology presents an opportunity for commercial vehicles to act as mobile energy storage units, providing grid services and generating additional revenue streams for fleet operators. The growing demand for sustainable battery manufacturing processes and the traceability of battery materials are also creating opportunities for companies committed to environmental, social, and governance (ESG) principles.
Leading Players in the Electric Commercial Vehicle Battery Pack Market Sector
- Tianjin Lishen Battery Joint-Stock Co Ltd
- Tata Autocomp Systems Ltd
- China Aviation Battery Co Ltd (CALB)
- Samsung SDI Co Ltd
- LG Energy Solution Ltd
- A123 Systems LLC
- Guoxuan High-tech Co Ltd
- Farasis Energy (Ganzhou) Co Ltd
- Contemporary Amperex Technology Co Ltd (CATL)
- BYD Company Ltd
- Sunwoda Electric Vehicle Battery Co Ltd (Sunwoda)
- SK Innovation Co Ltd
- EVE Energy Co Ltd
- Panasonic Holdings Corporation
Key Milestones in Electric Commercial Vehicle Battery Pack Market Industry
- February 2023: LG Energy Solution announced an investment of 10 trillion won for the current year, a 50 percent increase from the previous year's 6.3 trillion won. This investment will fuel a 50 percent expansion of its global production capacity to 300 gigawatt hours (GWh), significantly impacting global battery supply.
- February 2023: LG Energy Solution pioneered the world's first battery passport, a significant step towards unlocking a more sustainable battery value chain and enhancing transparency in material sourcing and recycling.
- February 2023: LG Energy Solution secured a multi-year contract with Freudenberg e-Power Systems for the supply of lithium-ion battery cell modules totaling 19 GWh. This strategic partnership highlights the growing demand for high-capacity battery solutions and strengthens LG Energy Solution's market position.
Strategic Outlook for Electric Commercial Vehicle Battery Pack Market Market
The strategic outlook for the Electric Commercial Vehicle Battery Pack Market is highly positive, driven by strong governmental push for decarbonization, rapid technological advancements in battery performance, and an escalating demand for sustainable logistics solutions. Future growth will be accelerated by continued investments in R&D for next-generation battery chemistries like solid-state batteries, offering enhanced safety and energy density. The expansion and upgrading of charging infrastructure will be paramount, with a focus on high-speed charging solutions for commercial vehicles. Strategic collaborations between battery manufacturers, automotive OEMs, and technology providers will be crucial for innovation and supply chain optimization. The growing emphasis on battery recycling and circular economy principles will not only address environmental concerns but also create new business opportunities. Furthermore, the increasing adoption of Battery-as-a-Service (BaaS) models is expected to lower the upfront cost barrier for fleet operators, driving broader market penetration. The market is poised for substantial expansion, with companies focusing on cost reduction, performance enhancement, and sustainable practices to secure a competitive edge.
Electric Commercial Vehicle Battery Pack Market Segmentation
-
1. Body Type
- 1.1. Bus
- 1.2. LCV
- 1.3. M&HDT
-
2. Propulsion Type
- 2.1. BEV
- 2.2. PHEV
-
3. Battery Chemistry
- 3.1. LFP
- 3.2. NCA
- 3.3. NCM
- 3.4. NMC
- 3.5. Others
-
4. Capacity
- 4.1. 15 kWh to 40 kWh
- 4.2. 40 kWh to 80 kWh
- 4.3. Above 80 kWh
- 4.4. Less than 15 kWh
-
5. Battery Form
- 5.1. Cylindrical
- 5.2. Pouch
- 5.3. Prismatic
-
6. Method
- 6.1. Laser
- 6.2. Wire
-
7. Component
- 7.1. Anode
- 7.2. Cathode
- 7.3. Electrolyte
- 7.4. Separator
-
8. Material Type
- 8.1. Cobalt
- 8.2. Lithium
- 8.3. Manganese
- 8.4. Natural Graphite
- 8.5. Nickel
- 8.6. Other Materials
Electric Commercial Vehicle Battery Pack Market Segmentation By Geography
-
1. North America
- 1.1. United States
- 1.2. Canada
- 1.3. Mexico
-
2. South America
- 2.1. Brazil
- 2.2. Argentina
- 2.3. Rest of South America
-
3. Europe
- 3.1. United Kingdom
- 3.2. Germany
- 3.3. France
- 3.4. Italy
- 3.5. Spain
- 3.6. Russia
- 3.7. Benelux
- 3.8. Nordics
- 3.9. Rest of Europe
-
4. Middle East & Africa
- 4.1. Turkey
- 4.2. Israel
- 4.3. GCC
- 4.4. North Africa
- 4.5. South Africa
- 4.6. Rest of Middle East & Africa
-
5. Asia Pacific
- 5.1. China
- 5.2. India
- 5.3. Japan
- 5.4. South Korea
- 5.5. ASEAN
- 5.6. Oceania
- 5.7. Rest of Asia Pacific
Electric Commercial Vehicle Battery Pack Market Regional Market Share
Geographic Coverage of Electric Commercial Vehicle Battery Pack Market
Electric Commercial Vehicle Battery Pack Market REPORT HIGHLIGHTS
| Aspects | Details |
|---|---|
| Study Period | 2020-2034 |
| Base Year | 2025 |
| Estimated Year | 2026 |
| Forecast Period | 2026-2034 |
| Historical Period | 2020-2025 |
| Growth Rate | CAGR of 4.90% from 2020-2034 |
| Segmentation |
|
Table of Contents
- 1. Introduction
- 1.1. Research Scope
- 1.2. Market Segmentation
- 1.3. Research Objective
- 1.4. Definitions and Assumptions
- 2. Executive Summary
- 2.1. Market Snapshot
- 3. Market Dynamics
- 3.1. Market Drivers
- 3.2. Market Restrains
- 3.3. Market Trends
- 3.4. Market Opportunities
- 4. Market Factor Analysis
- 4.1. Porters Five Forces
- 4.1.1. Bargaining Power of Suppliers
- 4.1.2. Bargaining Power of Buyers
- 4.1.3. Threat of New Entrants
- 4.1.4. Threat of Substitutes
- 4.1.5. Competitive Rivalry
- 4.2. PESTEL analysis
- 4.3. BCG Analysis
- 4.3.1. Stars (High Growth, High Market Share)
- 4.3.2. Cash Cows (Low Growth, High Market Share)
- 4.3.3. Question Mark (High Growth, Low Market Share)
- 4.3.4. Dogs (Low Growth, Low Market Share)
- 4.4. Ansoff Matrix Analysis
- 4.5. Supply Chain Analysis
- 4.6. Regulatory Landscape
- 4.7. Current Market Potential and Opportunity Assessment (TAM–SAM–SOM Framework)
- 4.8. MSR Analyst Note
- 4.1. Porters Five Forces
- 5. Market Analysis, Insights and Forecast 2021-2033
- 5.1. Market Analysis, Insights and Forecast - by Body Type
- 5.1.1. Bus
- 5.1.2. LCV
- 5.1.3. M&HDT
- 5.2. Market Analysis, Insights and Forecast - by Propulsion Type
- 5.2.1. BEV
- 5.2.2. PHEV
- 5.3. Market Analysis, Insights and Forecast - by Battery Chemistry
- 5.3.1. LFP
- 5.3.2. NCA
- 5.3.3. NCM
- 5.3.4. NMC
- 5.3.5. Others
- 5.4. Market Analysis, Insights and Forecast - by Capacity
- 5.4.1. 15 kWh to 40 kWh
- 5.4.2. 40 kWh to 80 kWh
- 5.4.3. Above 80 kWh
- 5.4.4. Less than 15 kWh
- 5.5. Market Analysis, Insights and Forecast - by Battery Form
- 5.5.1. Cylindrical
- 5.5.2. Pouch
- 5.5.3. Prismatic
- 5.6. Market Analysis, Insights and Forecast - by Method
- 5.6.1. Laser
- 5.6.2. Wire
- 5.7. Market Analysis, Insights and Forecast - by Component
- 5.7.1. Anode
- 5.7.2. Cathode
- 5.7.3. Electrolyte
- 5.7.4. Separator
- 5.8. Market Analysis, Insights and Forecast - by Material Type
- 5.8.1. Cobalt
- 5.8.2. Lithium
- 5.8.3. Manganese
- 5.8.4. Natural Graphite
- 5.8.5. Nickel
- 5.8.6. Other Materials
- 5.9. Market Analysis, Insights and Forecast - by Region
- 5.9.1. North America
- 5.9.2. South America
- 5.9.3. Europe
- 5.9.4. Middle East & Africa
- 5.9.5. Asia Pacific
- 5.1. Market Analysis, Insights and Forecast - by Body Type
- 6. Global Electric Commercial Vehicle Battery Pack Market Analysis, Insights and Forecast, 2021-2033
- 6.1. Market Analysis, Insights and Forecast - by Body Type
- 6.1.1. Bus
- 6.1.2. LCV
- 6.1.3. M&HDT
- 6.2. Market Analysis, Insights and Forecast - by Propulsion Type
- 6.2.1. BEV
- 6.2.2. PHEV
- 6.3. Market Analysis, Insights and Forecast - by Battery Chemistry
- 6.3.1. LFP
- 6.3.2. NCA
- 6.3.3. NCM
- 6.3.4. NMC
- 6.3.5. Others
- 6.4. Market Analysis, Insights and Forecast - by Capacity
- 6.4.1. 15 kWh to 40 kWh
- 6.4.2. 40 kWh to 80 kWh
- 6.4.3. Above 80 kWh
- 6.4.4. Less than 15 kWh
- 6.5. Market Analysis, Insights and Forecast - by Battery Form
- 6.5.1. Cylindrical
- 6.5.2. Pouch
- 6.5.3. Prismatic
- 6.6. Market Analysis, Insights and Forecast - by Method
- 6.6.1. Laser
- 6.6.2. Wire
- 6.7. Market Analysis, Insights and Forecast - by Component
- 6.7.1. Anode
- 6.7.2. Cathode
- 6.7.3. Electrolyte
- 6.7.4. Separator
- 6.8. Market Analysis, Insights and Forecast - by Material Type
- 6.8.1. Cobalt
- 6.8.2. Lithium
- 6.8.3. Manganese
- 6.8.4. Natural Graphite
- 6.8.5. Nickel
- 6.8.6. Other Materials
- 6.1. Market Analysis, Insights and Forecast - by Body Type
- 7. North America Electric Commercial Vehicle Battery Pack Market Analysis, Insights and Forecast, 2020-2032
- 7.1. Market Analysis, Insights and Forecast - by Body Type
- 7.1.1. Bus
- 7.1.2. LCV
- 7.1.3. M&HDT
- 7.2. Market Analysis, Insights and Forecast - by Propulsion Type
- 7.2.1. BEV
- 7.2.2. PHEV
- 7.3. Market Analysis, Insights and Forecast - by Battery Chemistry
- 7.3.1. LFP
- 7.3.2. NCA
- 7.3.3. NCM
- 7.3.4. NMC
- 7.3.5. Others
- 7.4. Market Analysis, Insights and Forecast - by Capacity
- 7.4.1. 15 kWh to 40 kWh
- 7.4.2. 40 kWh to 80 kWh
- 7.4.3. Above 80 kWh
- 7.4.4. Less than 15 kWh
- 7.5. Market Analysis, Insights and Forecast - by Battery Form
- 7.5.1. Cylindrical
- 7.5.2. Pouch
- 7.5.3. Prismatic
- 7.6. Market Analysis, Insights and Forecast - by Method
- 7.6.1. Laser
- 7.6.2. Wire
- 7.7. Market Analysis, Insights and Forecast - by Component
- 7.7.1. Anode
- 7.7.2. Cathode
- 7.7.3. Electrolyte
- 7.7.4. Separator
- 7.8. Market Analysis, Insights and Forecast - by Material Type
- 7.8.1. Cobalt
- 7.8.2. Lithium
- 7.8.3. Manganese
- 7.8.4. Natural Graphite
- 7.8.5. Nickel
- 7.8.6. Other Materials
- 7.1. Market Analysis, Insights and Forecast - by Body Type
- 8. South America Electric Commercial Vehicle Battery Pack Market Analysis, Insights and Forecast, 2020-2032
- 8.1. Market Analysis, Insights and Forecast - by Body Type
- 8.1.1. Bus
- 8.1.2. LCV
- 8.1.3. M&HDT
- 8.2. Market Analysis, Insights and Forecast - by Propulsion Type
- 8.2.1. BEV
- 8.2.2. PHEV
- 8.3. Market Analysis, Insights and Forecast - by Battery Chemistry
- 8.3.1. LFP
- 8.3.2. NCA
- 8.3.3. NCM
- 8.3.4. NMC
- 8.3.5. Others
- 8.4. Market Analysis, Insights and Forecast - by Capacity
- 8.4.1. 15 kWh to 40 kWh
- 8.4.2. 40 kWh to 80 kWh
- 8.4.3. Above 80 kWh
- 8.4.4. Less than 15 kWh
- 8.5. Market Analysis, Insights and Forecast - by Battery Form
- 8.5.1. Cylindrical
- 8.5.2. Pouch
- 8.5.3. Prismatic
- 8.6. Market Analysis, Insights and Forecast - by Method
- 8.6.1. Laser
- 8.6.2. Wire
- 8.7. Market Analysis, Insights and Forecast - by Component
- 8.7.1. Anode
- 8.7.2. Cathode
- 8.7.3. Electrolyte
- 8.7.4. Separator
- 8.8. Market Analysis, Insights and Forecast - by Material Type
- 8.8.1. Cobalt
- 8.8.2. Lithium
- 8.8.3. Manganese
- 8.8.4. Natural Graphite
- 8.8.5. Nickel
- 8.8.6. Other Materials
- 8.1. Market Analysis, Insights and Forecast - by Body Type
- 9. Europe Electric Commercial Vehicle Battery Pack Market Analysis, Insights and Forecast, 2020-2032
- 9.1. Market Analysis, Insights and Forecast - by Body Type
- 9.1.1. Bus
- 9.1.2. LCV
- 9.1.3. M&HDT
- 9.2. Market Analysis, Insights and Forecast - by Propulsion Type
- 9.2.1. BEV
- 9.2.2. PHEV
- 9.3. Market Analysis, Insights and Forecast - by Battery Chemistry
- 9.3.1. LFP
- 9.3.2. NCA
- 9.3.3. NCM
- 9.3.4. NMC
- 9.3.5. Others
- 9.4. Market Analysis, Insights and Forecast - by Capacity
- 9.4.1. 15 kWh to 40 kWh
- 9.4.2. 40 kWh to 80 kWh
- 9.4.3. Above 80 kWh
- 9.4.4. Less than 15 kWh
- 9.5. Market Analysis, Insights and Forecast - by Battery Form
- 9.5.1. Cylindrical
- 9.5.2. Pouch
- 9.5.3. Prismatic
- 9.6. Market Analysis, Insights and Forecast - by Method
- 9.6.1. Laser
- 9.6.2. Wire
- 9.7. Market Analysis, Insights and Forecast - by Component
- 9.7.1. Anode
- 9.7.2. Cathode
- 9.7.3. Electrolyte
- 9.7.4. Separator
- 9.8. Market Analysis, Insights and Forecast - by Material Type
- 9.8.1. Cobalt
- 9.8.2. Lithium
- 9.8.3. Manganese
- 9.8.4. Natural Graphite
- 9.8.5. Nickel
- 9.8.6. Other Materials
- 9.1. Market Analysis, Insights and Forecast - by Body Type
- 10. Middle East & Africa Electric Commercial Vehicle Battery Pack Market Analysis, Insights and Forecast, 2020-2032
- 10.1. Market Analysis, Insights and Forecast - by Body Type
- 10.1.1. Bus
- 10.1.2. LCV
- 10.1.3. M&HDT
- 10.2. Market Analysis, Insights and Forecast - by Propulsion Type
- 10.2.1. BEV
- 10.2.2. PHEV
- 10.3. Market Analysis, Insights and Forecast - by Battery Chemistry
- 10.3.1. LFP
- 10.3.2. NCA
- 10.3.3. NCM
- 10.3.4. NMC
- 10.3.5. Others
- 10.4. Market Analysis, Insights and Forecast - by Capacity
- 10.4.1. 15 kWh to 40 kWh
- 10.4.2. 40 kWh to 80 kWh
- 10.4.3. Above 80 kWh
- 10.4.4. Less than 15 kWh
- 10.5. Market Analysis, Insights and Forecast - by Battery Form
- 10.5.1. Cylindrical
- 10.5.2. Pouch
- 10.5.3. Prismatic
- 10.6. Market Analysis, Insights and Forecast - by Method
- 10.6.1. Laser
- 10.6.2. Wire
- 10.7. Market Analysis, Insights and Forecast - by Component
- 10.7.1. Anode
- 10.7.2. Cathode
- 10.7.3. Electrolyte
- 10.7.4. Separator
- 10.8. Market Analysis, Insights and Forecast - by Material Type
- 10.8.1. Cobalt
- 10.8.2. Lithium
- 10.8.3. Manganese
- 10.8.4. Natural Graphite
- 10.8.5. Nickel
- 10.8.6. Other Materials
- 10.1. Market Analysis, Insights and Forecast - by Body Type
- 11. Asia Pacific Electric Commercial Vehicle Battery Pack Market Analysis, Insights and Forecast, 2020-2032
- 11.1. Market Analysis, Insights and Forecast - by Body Type
- 11.1.1. Bus
- 11.1.2. LCV
- 11.1.3. M&HDT
- 11.2. Market Analysis, Insights and Forecast - by Propulsion Type
- 11.2.1. BEV
- 11.2.2. PHEV
- 11.3. Market Analysis, Insights and Forecast - by Battery Chemistry
- 11.3.1. LFP
- 11.3.2. NCA
- 11.3.3. NCM
- 11.3.4. NMC
- 11.3.5. Others
- 11.4. Market Analysis, Insights and Forecast - by Capacity
- 11.4.1. 15 kWh to 40 kWh
- 11.4.2. 40 kWh to 80 kWh
- 11.4.3. Above 80 kWh
- 11.4.4. Less than 15 kWh
- 11.5. Market Analysis, Insights and Forecast - by Battery Form
- 11.5.1. Cylindrical
- 11.5.2. Pouch
- 11.5.3. Prismatic
- 11.6. Market Analysis, Insights and Forecast - by Method
- 11.6.1. Laser
- 11.6.2. Wire
- 11.7. Market Analysis, Insights and Forecast - by Component
- 11.7.1. Anode
- 11.7.2. Cathode
- 11.7.3. Electrolyte
- 11.7.4. Separator
- 11.8. Market Analysis, Insights and Forecast - by Material Type
- 11.8.1. Cobalt
- 11.8.2. Lithium
- 11.8.3. Manganese
- 11.8.4. Natural Graphite
- 11.8.5. Nickel
- 11.8.6. Other Materials
- 11.1. Market Analysis, Insights and Forecast - by Body Type
- 12. Competitive Analysis
- 12.1. Company Profiles
- 12.1.1 Tianjin Lishen Battery Joint-Stock Co Ltd (Lishen Battery
- 12.1.1.1. Company Overview
- 12.1.1.2. Products
- 12.1.1.3. Company Financials
- 12.1.1.4. SWOT Analysis
- 12.1.2 Tata Autocomp Systems Ltd
- 12.1.2.1. Company Overview
- 12.1.2.2. Products
- 12.1.2.3. Company Financials
- 12.1.2.4. SWOT Analysis
- 12.1.3 China Aviation Battery Co Ltd (CALB)
- 12.1.3.1. Company Overview
- 12.1.3.2. Products
- 12.1.3.3. Company Financials
- 12.1.3.4. SWOT Analysis
- 12.1.4 Samsung SDI Co Ltd
- 12.1.4.1. Company Overview
- 12.1.4.2. Products
- 12.1.4.3. Company Financials
- 12.1.4.4. SWOT Analysis
- 12.1.5 LG Energy Solution Ltd
- 12.1.5.1. Company Overview
- 12.1.5.2. Products
- 12.1.5.3. Company Financials
- 12.1.5.4. SWOT Analysis
- 12.1.6 A123 Systems LLC
- 12.1.6.1. Company Overview
- 12.1.6.2. Products
- 12.1.6.3. Company Financials
- 12.1.6.4. SWOT Analysis
- 12.1.7 Guoxuan High-tech Co Ltd
- 12.1.7.1. Company Overview
- 12.1.7.2. Products
- 12.1.7.3. Company Financials
- 12.1.7.4. SWOT Analysis
- 12.1.8 Farasis Energy (Ganzhou) Co Ltd
- 12.1.8.1. Company Overview
- 12.1.8.2. Products
- 12.1.8.3. Company Financials
- 12.1.8.4. SWOT Analysis
- 12.1.9 Contemporary Amperex Technology Co Ltd (CATL)
- 12.1.9.1. Company Overview
- 12.1.9.2. Products
- 12.1.9.3. Company Financials
- 12.1.9.4. SWOT Analysis
- 12.1.10 BYD Company Ltd
- 12.1.10.1. Company Overview
- 12.1.10.2. Products
- 12.1.10.3. Company Financials
- 12.1.10.4. SWOT Analysis
- 12.1.11 Sunwoda Electric Vehicle Battery Co Ltd (Sunwoda)
- 12.1.11.1. Company Overview
- 12.1.11.2. Products
- 12.1.11.3. Company Financials
- 12.1.11.4. SWOT Analysis
- 12.1.12 SK Innovation Co Ltd
- 12.1.12.1. Company Overview
- 12.1.12.2. Products
- 12.1.12.3. Company Financials
- 12.1.12.4. SWOT Analysis
- 12.1.13 EVE Energy Co Ltd
- 12.1.13.1. Company Overview
- 12.1.13.2. Products
- 12.1.13.3. Company Financials
- 12.1.13.4. SWOT Analysis
- 12.1.14 Panasonic Holdings Corporation
- 12.1.14.1. Company Overview
- 12.1.14.2. Products
- 12.1.14.3. Company Financials
- 12.1.14.4. SWOT Analysis
- 12.1.1 Tianjin Lishen Battery Joint-Stock Co Ltd (Lishen Battery
- 12.2. Market Entropy
- 12.2.1 Company's Key Areas Served
- 12.2.2 Recent Developments
- 12.3. Company Market Share Analysis 2025
- 12.3.1 Top 5 Companies Market Share Analysis
- 12.3.2 Top 3 Companies Market Share Analysis
- 12.4. List of Potential Customers
- 13. Research Methodology
List of Figures
- Figure 1: Global Electric Commercial Vehicle Battery Pack Market Revenue Breakdown (Million, %) by Region 2025 & 2033
- Figure 2: North America Electric Commercial Vehicle Battery Pack Market Revenue (Million), by Body Type 2025 & 2033
- Figure 3: North America Electric Commercial Vehicle Battery Pack Market Revenue Share (%), by Body Type 2025 & 2033
- Figure 4: North America Electric Commercial Vehicle Battery Pack Market Revenue (Million), by Propulsion Type 2025 & 2033
- Figure 5: North America Electric Commercial Vehicle Battery Pack Market Revenue Share (%), by Propulsion Type 2025 & 2033
- Figure 6: North America Electric Commercial Vehicle Battery Pack Market Revenue (Million), by Battery Chemistry 2025 & 2033
- Figure 7: North America Electric Commercial Vehicle Battery Pack Market Revenue Share (%), by Battery Chemistry 2025 & 2033
- Figure 8: North America Electric Commercial Vehicle Battery Pack Market Revenue (Million), by Capacity 2025 & 2033
- Figure 9: North America Electric Commercial Vehicle Battery Pack Market Revenue Share (%), by Capacity 2025 & 2033
- Figure 10: North America Electric Commercial Vehicle Battery Pack Market Revenue (Million), by Battery Form 2025 & 2033
- Figure 11: North America Electric Commercial Vehicle Battery Pack Market Revenue Share (%), by Battery Form 2025 & 2033
- Figure 12: North America Electric Commercial Vehicle Battery Pack Market Revenue (Million), by Method 2025 & 2033
- Figure 13: North America Electric Commercial Vehicle Battery Pack Market Revenue Share (%), by Method 2025 & 2033
- Figure 14: North America Electric Commercial Vehicle Battery Pack Market Revenue (Million), by Component 2025 & 2033
- Figure 15: North America Electric Commercial Vehicle Battery Pack Market Revenue Share (%), by Component 2025 & 2033
- Figure 16: North America Electric Commercial Vehicle Battery Pack Market Revenue (Million), by Material Type 2025 & 2033
- Figure 17: North America Electric Commercial Vehicle Battery Pack Market Revenue Share (%), by Material Type 2025 & 2033
- Figure 18: North America Electric Commercial Vehicle Battery Pack Market Revenue (Million), by Country 2025 & 2033
- Figure 19: North America Electric Commercial Vehicle Battery Pack Market Revenue Share (%), by Country 2025 & 2033
- Figure 20: South America Electric Commercial Vehicle Battery Pack Market Revenue (Million), by Body Type 2025 & 2033
- Figure 21: South America Electric Commercial Vehicle Battery Pack Market Revenue Share (%), by Body Type 2025 & 2033
- Figure 22: South America Electric Commercial Vehicle Battery Pack Market Revenue (Million), by Propulsion Type 2025 & 2033
- Figure 23: South America Electric Commercial Vehicle Battery Pack Market Revenue Share (%), by Propulsion Type 2025 & 2033
- Figure 24: South America Electric Commercial Vehicle Battery Pack Market Revenue (Million), by Battery Chemistry 2025 & 2033
- Figure 25: South America Electric Commercial Vehicle Battery Pack Market Revenue Share (%), by Battery Chemistry 2025 & 2033
- Figure 26: South America Electric Commercial Vehicle Battery Pack Market Revenue (Million), by Capacity 2025 & 2033
- Figure 27: South America Electric Commercial Vehicle Battery Pack Market Revenue Share (%), by Capacity 2025 & 2033
- Figure 28: South America Electric Commercial Vehicle Battery Pack Market Revenue (Million), by Battery Form 2025 & 2033
- Figure 29: South America Electric Commercial Vehicle Battery Pack Market Revenue Share (%), by Battery Form 2025 & 2033
- Figure 30: South America Electric Commercial Vehicle Battery Pack Market Revenue (Million), by Method 2025 & 2033
- Figure 31: South America Electric Commercial Vehicle Battery Pack Market Revenue Share (%), by Method 2025 & 2033
- Figure 32: South America Electric Commercial Vehicle Battery Pack Market Revenue (Million), by Component 2025 & 2033
- Figure 33: South America Electric Commercial Vehicle Battery Pack Market Revenue Share (%), by Component 2025 & 2033
- Figure 34: South America Electric Commercial Vehicle Battery Pack Market Revenue (Million), by Material Type 2025 & 2033
- Figure 35: South America Electric Commercial Vehicle Battery Pack Market Revenue Share (%), by Material Type 2025 & 2033
- Figure 36: South America Electric Commercial Vehicle Battery Pack Market Revenue (Million), by Country 2025 & 2033
- Figure 37: South America Electric Commercial Vehicle Battery Pack Market Revenue Share (%), by Country 2025 & 2033
- Figure 38: Europe Electric Commercial Vehicle Battery Pack Market Revenue (Million), by Body Type 2025 & 2033
- Figure 39: Europe Electric Commercial Vehicle Battery Pack Market Revenue Share (%), by Body Type 2025 & 2033
- Figure 40: Europe Electric Commercial Vehicle Battery Pack Market Revenue (Million), by Propulsion Type 2025 & 2033
- Figure 41: Europe Electric Commercial Vehicle Battery Pack Market Revenue Share (%), by Propulsion Type 2025 & 2033
- Figure 42: Europe Electric Commercial Vehicle Battery Pack Market Revenue (Million), by Battery Chemistry 2025 & 2033
- Figure 43: Europe Electric Commercial Vehicle Battery Pack Market Revenue Share (%), by Battery Chemistry 2025 & 2033
- Figure 44: Europe Electric Commercial Vehicle Battery Pack Market Revenue (Million), by Capacity 2025 & 2033
- Figure 45: Europe Electric Commercial Vehicle Battery Pack Market Revenue Share (%), by Capacity 2025 & 2033
- Figure 46: Europe Electric Commercial Vehicle Battery Pack Market Revenue (Million), by Battery Form 2025 & 2033
- Figure 47: Europe Electric Commercial Vehicle Battery Pack Market Revenue Share (%), by Battery Form 2025 & 2033
- Figure 48: Europe Electric Commercial Vehicle Battery Pack Market Revenue (Million), by Method 2025 & 2033
- Figure 49: Europe Electric Commercial Vehicle Battery Pack Market Revenue Share (%), by Method 2025 & 2033
- Figure 50: Europe Electric Commercial Vehicle Battery Pack Market Revenue (Million), by Component 2025 & 2033
- Figure 51: Europe Electric Commercial Vehicle Battery Pack Market Revenue Share (%), by Component 2025 & 2033
- Figure 52: Europe Electric Commercial Vehicle Battery Pack Market Revenue (Million), by Material Type 2025 & 2033
- Figure 53: Europe Electric Commercial Vehicle Battery Pack Market Revenue Share (%), by Material Type 2025 & 2033
- Figure 54: Europe Electric Commercial Vehicle Battery Pack Market Revenue (Million), by Country 2025 & 2033
- Figure 55: Europe Electric Commercial Vehicle Battery Pack Market Revenue Share (%), by Country 2025 & 2033
- Figure 56: Middle East & Africa Electric Commercial Vehicle Battery Pack Market Revenue (Million), by Body Type 2025 & 2033
- Figure 57: Middle East & Africa Electric Commercial Vehicle Battery Pack Market Revenue Share (%), by Body Type 2025 & 2033
- Figure 58: Middle East & Africa Electric Commercial Vehicle Battery Pack Market Revenue (Million), by Propulsion Type 2025 & 2033
- Figure 59: Middle East & Africa Electric Commercial Vehicle Battery Pack Market Revenue Share (%), by Propulsion Type 2025 & 2033
- Figure 60: Middle East & Africa Electric Commercial Vehicle Battery Pack Market Revenue (Million), by Battery Chemistry 2025 & 2033
- Figure 61: Middle East & Africa Electric Commercial Vehicle Battery Pack Market Revenue Share (%), by Battery Chemistry 2025 & 2033
- Figure 62: Middle East & Africa Electric Commercial Vehicle Battery Pack Market Revenue (Million), by Capacity 2025 & 2033
- Figure 63: Middle East & Africa Electric Commercial Vehicle Battery Pack Market Revenue Share (%), by Capacity 2025 & 2033
- Figure 64: Middle East & Africa Electric Commercial Vehicle Battery Pack Market Revenue (Million), by Battery Form 2025 & 2033
- Figure 65: Middle East & Africa Electric Commercial Vehicle Battery Pack Market Revenue Share (%), by Battery Form 2025 & 2033
- Figure 66: Middle East & Africa Electric Commercial Vehicle Battery Pack Market Revenue (Million), by Method 2025 & 2033
- Figure 67: Middle East & Africa Electric Commercial Vehicle Battery Pack Market Revenue Share (%), by Method 2025 & 2033
- Figure 68: Middle East & Africa Electric Commercial Vehicle Battery Pack Market Revenue (Million), by Component 2025 & 2033
- Figure 69: Middle East & Africa Electric Commercial Vehicle Battery Pack Market Revenue Share (%), by Component 2025 & 2033
- Figure 70: Middle East & Africa Electric Commercial Vehicle Battery Pack Market Revenue (Million), by Material Type 2025 & 2033
- Figure 71: Middle East & Africa Electric Commercial Vehicle Battery Pack Market Revenue Share (%), by Material Type 2025 & 2033
- Figure 72: Middle East & Africa Electric Commercial Vehicle Battery Pack Market Revenue (Million), by Country 2025 & 2033
- Figure 73: Middle East & Africa Electric Commercial Vehicle Battery Pack Market Revenue Share (%), by Country 2025 & 2033
- Figure 74: Asia Pacific Electric Commercial Vehicle Battery Pack Market Revenue (Million), by Body Type 2025 & 2033
- Figure 75: Asia Pacific Electric Commercial Vehicle Battery Pack Market Revenue Share (%), by Body Type 2025 & 2033
- Figure 76: Asia Pacific Electric Commercial Vehicle Battery Pack Market Revenue (Million), by Propulsion Type 2025 & 2033
- Figure 77: Asia Pacific Electric Commercial Vehicle Battery Pack Market Revenue Share (%), by Propulsion Type 2025 & 2033
- Figure 78: Asia Pacific Electric Commercial Vehicle Battery Pack Market Revenue (Million), by Battery Chemistry 2025 & 2033
- Figure 79: Asia Pacific Electric Commercial Vehicle Battery Pack Market Revenue Share (%), by Battery Chemistry 2025 & 2033
- Figure 80: Asia Pacific Electric Commercial Vehicle Battery Pack Market Revenue (Million), by Capacity 2025 & 2033
- Figure 81: Asia Pacific Electric Commercial Vehicle Battery Pack Market Revenue Share (%), by Capacity 2025 & 2033
- Figure 82: Asia Pacific Electric Commercial Vehicle Battery Pack Market Revenue (Million), by Battery Form 2025 & 2033
- Figure 83: Asia Pacific Electric Commercial Vehicle Battery Pack Market Revenue Share (%), by Battery Form 2025 & 2033
- Figure 84: Asia Pacific Electric Commercial Vehicle Battery Pack Market Revenue (Million), by Method 2025 & 2033
- Figure 85: Asia Pacific Electric Commercial Vehicle Battery Pack Market Revenue Share (%), by Method 2025 & 2033
- Figure 86: Asia Pacific Electric Commercial Vehicle Battery Pack Market Revenue (Million), by Component 2025 & 2033
- Figure 87: Asia Pacific Electric Commercial Vehicle Battery Pack Market Revenue Share (%), by Component 2025 & 2033
- Figure 88: Asia Pacific Electric Commercial Vehicle Battery Pack Market Revenue (Million), by Material Type 2025 & 2033
- Figure 89: Asia Pacific Electric Commercial Vehicle Battery Pack Market Revenue Share (%), by Material Type 2025 & 2033
- Figure 90: Asia Pacific Electric Commercial Vehicle Battery Pack Market Revenue (Million), by Country 2025 & 2033
- Figure 91: Asia Pacific Electric Commercial Vehicle Battery Pack Market Revenue Share (%), by Country 2025 & 2033
List of Tables
- Table 1: Global Electric Commercial Vehicle Battery Pack Market Revenue Million Forecast, by Body Type 2020 & 2033
- Table 2: Global Electric Commercial Vehicle Battery Pack Market Revenue Million Forecast, by Propulsion Type 2020 & 2033
- Table 3: Global Electric Commercial Vehicle Battery Pack Market Revenue Million Forecast, by Battery Chemistry 2020 & 2033
- Table 4: Global Electric Commercial Vehicle Battery Pack Market Revenue Million Forecast, by Capacity 2020 & 2033
- Table 5: Global Electric Commercial Vehicle Battery Pack Market Revenue Million Forecast, by Battery Form 2020 & 2033
- Table 6: Global Electric Commercial Vehicle Battery Pack Market Revenue Million Forecast, by Method 2020 & 2033
- Table 7: Global Electric Commercial Vehicle Battery Pack Market Revenue Million Forecast, by Component 2020 & 2033
- Table 8: Global Electric Commercial Vehicle Battery Pack Market Revenue Million Forecast, by Material Type 2020 & 2033
- Table 9: Global Electric Commercial Vehicle Battery Pack Market Revenue Million Forecast, by Region 2020 & 2033
- Table 10: Global Electric Commercial Vehicle Battery Pack Market Revenue Million Forecast, by Body Type 2020 & 2033
- Table 11: Global Electric Commercial Vehicle Battery Pack Market Revenue Million Forecast, by Propulsion Type 2020 & 2033
- Table 12: Global Electric Commercial Vehicle Battery Pack Market Revenue Million Forecast, by Battery Chemistry 2020 & 2033
- Table 13: Global Electric Commercial Vehicle Battery Pack Market Revenue Million Forecast, by Capacity 2020 & 2033
- Table 14: Global Electric Commercial Vehicle Battery Pack Market Revenue Million Forecast, by Battery Form 2020 & 2033
- Table 15: Global Electric Commercial Vehicle Battery Pack Market Revenue Million Forecast, by Method 2020 & 2033
- Table 16: Global Electric Commercial Vehicle Battery Pack Market Revenue Million Forecast, by Component 2020 & 2033
- Table 17: Global Electric Commercial Vehicle Battery Pack Market Revenue Million Forecast, by Material Type 2020 & 2033
- Table 18: Global Electric Commercial Vehicle Battery Pack Market Revenue Million Forecast, by Country 2020 & 2033
- Table 19: United States Electric Commercial Vehicle Battery Pack Market Revenue (Million) Forecast, by Application 2020 & 2033
- Table 20: Canada Electric Commercial Vehicle Battery Pack Market Revenue (Million) Forecast, by Application 2020 & 2033
- Table 21: Mexico Electric Commercial Vehicle Battery Pack Market Revenue (Million) Forecast, by Application 2020 & 2033
- Table 22: Global Electric Commercial Vehicle Battery Pack Market Revenue Million Forecast, by Body Type 2020 & 2033
- Table 23: Global Electric Commercial Vehicle Battery Pack Market Revenue Million Forecast, by Propulsion Type 2020 & 2033
- Table 24: Global Electric Commercial Vehicle Battery Pack Market Revenue Million Forecast, by Battery Chemistry 2020 & 2033
- Table 25: Global Electric Commercial Vehicle Battery Pack Market Revenue Million Forecast, by Capacity 2020 & 2033
- Table 26: Global Electric Commercial Vehicle Battery Pack Market Revenue Million Forecast, by Battery Form 2020 & 2033
- Table 27: Global Electric Commercial Vehicle Battery Pack Market Revenue Million Forecast, by Method 2020 & 2033
- Table 28: Global Electric Commercial Vehicle Battery Pack Market Revenue Million Forecast, by Component 2020 & 2033
- Table 29: Global Electric Commercial Vehicle Battery Pack Market Revenue Million Forecast, by Material Type 2020 & 2033
- Table 30: Global Electric Commercial Vehicle Battery Pack Market Revenue Million Forecast, by Country 2020 & 2033
- Table 31: Brazil Electric Commercial Vehicle Battery Pack Market Revenue (Million) Forecast, by Application 2020 & 2033
- Table 32: Argentina Electric Commercial Vehicle Battery Pack Market Revenue (Million) Forecast, by Application 2020 & 2033
- Table 33: Rest of South America Electric Commercial Vehicle Battery Pack Market Revenue (Million) Forecast, by Application 2020 & 2033
- Table 34: Global Electric Commercial Vehicle Battery Pack Market Revenue Million Forecast, by Body Type 2020 & 2033
- Table 35: Global Electric Commercial Vehicle Battery Pack Market Revenue Million Forecast, by Propulsion Type 2020 & 2033
- Table 36: Global Electric Commercial Vehicle Battery Pack Market Revenue Million Forecast, by Battery Chemistry 2020 & 2033
- Table 37: Global Electric Commercial Vehicle Battery Pack Market Revenue Million Forecast, by Capacity 2020 & 2033
- Table 38: Global Electric Commercial Vehicle Battery Pack Market Revenue Million Forecast, by Battery Form 2020 & 2033
- Table 39: Global Electric Commercial Vehicle Battery Pack Market Revenue Million Forecast, by Method 2020 & 2033
- Table 40: Global Electric Commercial Vehicle Battery Pack Market Revenue Million Forecast, by Component 2020 & 2033
- Table 41: Global Electric Commercial Vehicle Battery Pack Market Revenue Million Forecast, by Material Type 2020 & 2033
- Table 42: Global Electric Commercial Vehicle Battery Pack Market Revenue Million Forecast, by Country 2020 & 2033
- Table 43: United Kingdom Electric Commercial Vehicle Battery Pack Market Revenue (Million) Forecast, by Application 2020 & 2033
- Table 44: Germany Electric Commercial Vehicle Battery Pack Market Revenue (Million) Forecast, by Application 2020 & 2033
- Table 45: France Electric Commercial Vehicle Battery Pack Market Revenue (Million) Forecast, by Application 2020 & 2033
- Table 46: Italy Electric Commercial Vehicle Battery Pack Market Revenue (Million) Forecast, by Application 2020 & 2033
- Table 47: Spain Electric Commercial Vehicle Battery Pack Market Revenue (Million) Forecast, by Application 2020 & 2033
- Table 48: Russia Electric Commercial Vehicle Battery Pack Market Revenue (Million) Forecast, by Application 2020 & 2033
- Table 49: Benelux Electric Commercial Vehicle Battery Pack Market Revenue (Million) Forecast, by Application 2020 & 2033
- Table 50: Nordics Electric Commercial Vehicle Battery Pack Market Revenue (Million) Forecast, by Application 2020 & 2033
- Table 51: Rest of Europe Electric Commercial Vehicle Battery Pack Market Revenue (Million) Forecast, by Application 2020 & 2033
- Table 52: Global Electric Commercial Vehicle Battery Pack Market Revenue Million Forecast, by Body Type 2020 & 2033
- Table 53: Global Electric Commercial Vehicle Battery Pack Market Revenue Million Forecast, by Propulsion Type 2020 & 2033
- Table 54: Global Electric Commercial Vehicle Battery Pack Market Revenue Million Forecast, by Battery Chemistry 2020 & 2033
- Table 55: Global Electric Commercial Vehicle Battery Pack Market Revenue Million Forecast, by Capacity 2020 & 2033
- Table 56: Global Electric Commercial Vehicle Battery Pack Market Revenue Million Forecast, by Battery Form 2020 & 2033
- Table 57: Global Electric Commercial Vehicle Battery Pack Market Revenue Million Forecast, by Method 2020 & 2033
- Table 58: Global Electric Commercial Vehicle Battery Pack Market Revenue Million Forecast, by Component 2020 & 2033
- Table 59: Global Electric Commercial Vehicle Battery Pack Market Revenue Million Forecast, by Material Type 2020 & 2033
- Table 60: Global Electric Commercial Vehicle Battery Pack Market Revenue Million Forecast, by Country 2020 & 2033
- Table 61: Turkey Electric Commercial Vehicle Battery Pack Market Revenue (Million) Forecast, by Application 2020 & 2033
- Table 62: Israel Electric Commercial Vehicle Battery Pack Market Revenue (Million) Forecast, by Application 2020 & 2033
- Table 63: GCC Electric Commercial Vehicle Battery Pack Market Revenue (Million) Forecast, by Application 2020 & 2033
- Table 64: North Africa Electric Commercial Vehicle Battery Pack Market Revenue (Million) Forecast, by Application 2020 & 2033
- Table 65: South Africa Electric Commercial Vehicle Battery Pack Market Revenue (Million) Forecast, by Application 2020 & 2033
- Table 66: Rest of Middle East & Africa Electric Commercial Vehicle Battery Pack Market Revenue (Million) Forecast, by Application 2020 & 2033
- Table 67: Global Electric Commercial Vehicle Battery Pack Market Revenue Million Forecast, by Body Type 2020 & 2033
- Table 68: Global Electric Commercial Vehicle Battery Pack Market Revenue Million Forecast, by Propulsion Type 2020 & 2033
- Table 69: Global Electric Commercial Vehicle Battery Pack Market Revenue Million Forecast, by Battery Chemistry 2020 & 2033
- Table 70: Global Electric Commercial Vehicle Battery Pack Market Revenue Million Forecast, by Capacity 2020 & 2033
- Table 71: Global Electric Commercial Vehicle Battery Pack Market Revenue Million Forecast, by Battery Form 2020 & 2033
- Table 72: Global Electric Commercial Vehicle Battery Pack Market Revenue Million Forecast, by Method 2020 & 2033
- Table 73: Global Electric Commercial Vehicle Battery Pack Market Revenue Million Forecast, by Component 2020 & 2033
- Table 74: Global Electric Commercial Vehicle Battery Pack Market Revenue Million Forecast, by Material Type 2020 & 2033
- Table 75: Global Electric Commercial Vehicle Battery Pack Market Revenue Million Forecast, by Country 2020 & 2033
- Table 76: China Electric Commercial Vehicle Battery Pack Market Revenue (Million) Forecast, by Application 2020 & 2033
- Table 77: India Electric Commercial Vehicle Battery Pack Market Revenue (Million) Forecast, by Application 2020 & 2033
- Table 78: Japan Electric Commercial Vehicle Battery Pack Market Revenue (Million) Forecast, by Application 2020 & 2033
- Table 79: South Korea Electric Commercial Vehicle Battery Pack Market Revenue (Million) Forecast, by Application 2020 & 2033
- Table 80: ASEAN Electric Commercial Vehicle Battery Pack Market Revenue (Million) Forecast, by Application 2020 & 2033
- Table 81: Oceania Electric Commercial Vehicle Battery Pack Market Revenue (Million) Forecast, by Application 2020 & 2033
- Table 82: Rest of Asia Pacific Electric Commercial Vehicle Battery Pack Market Revenue (Million) Forecast, by Application 2020 & 2033
Frequently Asked Questions
1. What is the projected Compound Annual Growth Rate (CAGR) of the Electric Commercial Vehicle Battery Pack Market?
The projected CAGR is approximately 4.90%.
2. Which companies are prominent players in the Electric Commercial Vehicle Battery Pack Market?
Key companies in the market include Tianjin Lishen Battery Joint-Stock Co Ltd (Lishen Battery, Tata Autocomp Systems Ltd, China Aviation Battery Co Ltd (CALB), Samsung SDI Co Ltd, LG Energy Solution Ltd, A123 Systems LLC, Guoxuan High-tech Co Ltd, Farasis Energy (Ganzhou) Co Ltd, Contemporary Amperex Technology Co Ltd (CATL), BYD Company Ltd, Sunwoda Electric Vehicle Battery Co Ltd (Sunwoda), SK Innovation Co Ltd, EVE Energy Co Ltd, Panasonic Holdings Corporation.
3. What are the main segments of the Electric Commercial Vehicle Battery Pack Market?
The market segments include Body Type, Propulsion Type, Battery Chemistry, Capacity, Battery Form, Method, Component, Material Type.
4. Can you provide details about the market size?
The market size is estimated to be USD XX Million as of 2022.
5. What are some drivers contributing to market growth?
The Rise of Trade Agreements Between Nations; Increasing Volume of International Trade.
6. What are the notable trends driving market growth?
OTHER KEY INDUSTRY TRENDS COVERED IN THE REPORT.
7. Are there any restraints impacting market growth?
Surge in Fuel Costs Affecting the Market.
8. Can you provide examples of recent developments in the market?
February 2023: LG Energy Solution will invest 10 trillion won this year, up 50 percent from 6.3 trillion won a year ago, and expand its global production capacity by 50 percent to 300 gigawatt hours (GWh).February 2023: LG Energy Solution is unlocking more sustainable battery value chain with the world's first battery passport.February 2023: LG Energy Solution and Freudenberg e-Power Systems have signed a multi-year contract for the supply of lithium-ion battery cell modules with a total capacity of 19 GWh.
9. What pricing options are available for accessing the report?
Pricing options include single-user, multi-user, and enterprise licenses priced at USD 3800, USD 4500, and USD 5800 respectively.
10. Is the market size provided in terms of value or volume?
The market size is provided in terms of value, measured in Million.
11. Are there any specific market keywords associated with the report?
Yes, the market keyword associated with the report is "Electric Commercial Vehicle Battery Pack Market," which aids in identifying and referencing the specific market segment covered.
12. How do I determine which pricing option suits my needs best?
The pricing options vary based on user requirements and access needs. Individual users may opt for single-user licenses, while businesses requiring broader access may choose multi-user or enterprise licenses for cost-effective access to the report.
13. Are there any additional resources or data provided in the Electric Commercial Vehicle Battery Pack Market report?
While the report offers comprehensive insights, it's advisable to review the specific contents or supplementary materials provided to ascertain if additional resources or data are available.
14. How can I stay updated on further developments or reports in the Electric Commercial Vehicle Battery Pack Market?
To stay informed about further developments, trends, and reports in the Electric Commercial Vehicle Battery Pack Market, consider subscribing to industry newsletters, following relevant companies and organizations, or regularly checking reputable industry news sources and publications.
Methodology
Step 1 - Identification of Relevant Samples Size from Population Database


Step 2 - Approaches for Defining Global Market Size (Value, Volume* & Price*)

Note*: In applicable scenarios
Step 3 - Data Sources
Primary Research
- Web Analytics
- Survey Reports
- Research Institute
- Latest Research Reports
- Opinion Leaders
Secondary Research
- Annual Reports
- White Paper
- Latest Press Release
- Industry Association
- Paid Database
- Investor Presentations

Step 4 - Data Triangulation
Involves using different sources of information in order to increase the validity of a study
These sources are likely to be stakeholders in a program - participants, other researchers, program staff, other community members, and so on.
Then we put all data in single framework & apply various statistical tools to find out the dynamic on the market.
During the analysis stage, feedback from the stakeholder groups would be compared to determine areas of agreement as well as areas of divergence