

Key Insights
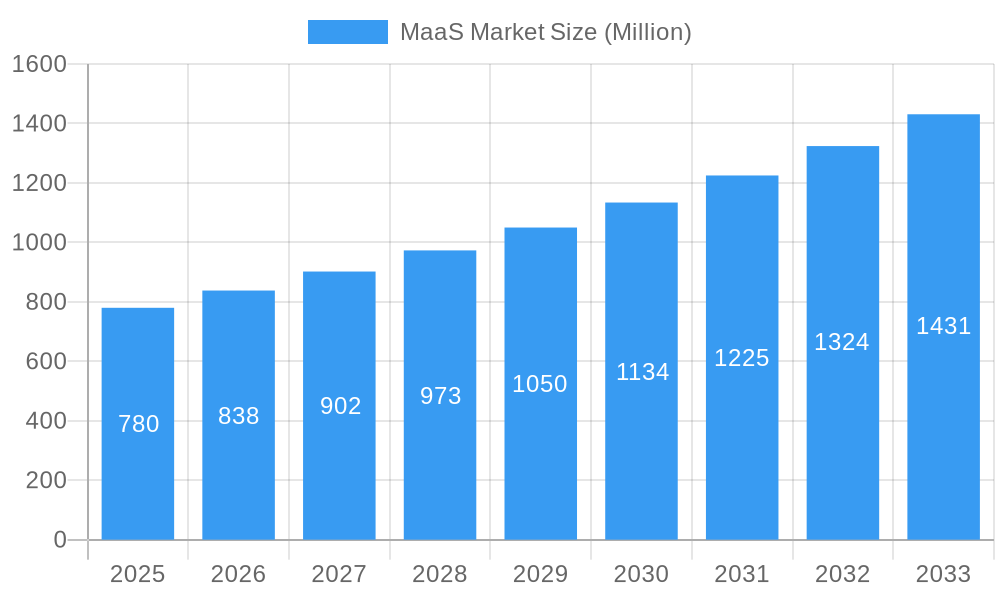
The Mobility as a Service (MaaS) market, valued at $0.78 billion in 2025, is projected to experience robust growth, driven by increasing urbanization, rising fuel prices, and a growing preference for sustainable transportation solutions. The market's Compound Annual Growth Rate (CAGR) of 7.43% from 2025 to 2033 indicates a significant expansion, with substantial opportunities across various segments. The car service segment currently dominates, but the increasing adoption of public transportation integrated within MaaS platforms is fueling growth in the public transportation segment. Technological advancements, such as improved app interfaces and seamless integration with various payment systems, are further driving market expansion. Furthermore, the rising adoption of electric vehicles and micromobility solutions within MaaS offerings are contributing to the market's sustainable growth trajectory.
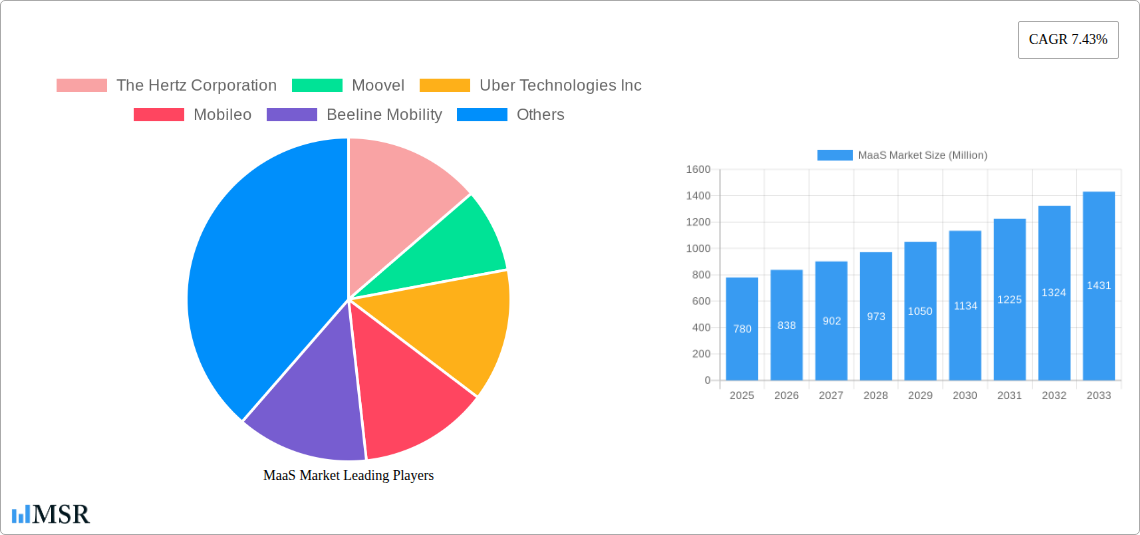
MaaS Market Market Size (In Million)
Key regional markets include North America and Europe, fueled by strong technological infrastructure and consumer adoption. However, the Asia-Pacific region is poised for substantial growth due to its rapidly expanding urban populations and increasing disposable incomes. Competitive pressures exist among established players like Hertz and Uber, along with emerging innovative companies. Challenges include the need for robust data security and privacy measures, efficient integration of diverse transportation modes, and addressing regulatory hurdles across different regions. Overcoming these challenges will be critical to unlocking the full potential of the MaaS market and achieving widespread adoption globally. Future growth will depend significantly on the expansion of integrated public transit options, the development of more comprehensive and user-friendly applications, and the addressing of sustainability concerns.
MaaS Market Company Market Share
MaaS Market: A Comprehensive Report (2019-2033)
This in-depth report provides a comprehensive analysis of the Mobility as a Service (MaaS) market, offering crucial insights for industry stakeholders, investors, and strategic decision-makers. Covering the period from 2019 to 2033, with a focus on 2025, this report delves into market dynamics, key trends, leading players, and future opportunities within the rapidly evolving MaaS landscape. The global MaaS market is projected to reach xx Million by 2033, exhibiting a CAGR of xx% during the forecast period (2025-2033).
MaaS Market Concentration & Dynamics
The MaaS market exhibits a moderately concentrated landscape, with a few dominant players and a growing number of niche players. Market share is largely dictated by technological capabilities, geographic reach, and strategic partnerships. The market is witnessing significant innovation, driven by technological advancements in areas such as AI, IoT, and big data analytics. Regulatory frameworks, varying considerably across different geographies, significantly impact market entry and growth. Substitute products, including traditional modes of transportation and ride-hailing services, exert competitive pressure. End-user trends, particularly towards sustainable and integrated transportation solutions, are fueling market demand. M&A activity is frequent, with a total of xx M&A deals recorded between 2019 and 2024, indicating a consolidation trend within the sector.
- Market Share (2024 Estimate): Uber Technologies Inc. (xx%), The Hertz Corporation (xx%), Enterprise Holdings Inc. (xx%), Others (xx%).
- M&A Deal Count (2019-2024): xx
- Key Innovation Areas: AI-powered route optimization, integrated payment solutions, real-time data analytics for service improvement.
MaaS Market Industry Insights & Trends
The MaaS market is experiencing rapid growth, driven by several key factors. Increasing urbanization and traffic congestion are pushing commuters towards more efficient and integrated transportation solutions. The rising adoption of smartphones and mobile applications has facilitated the seamless integration of various transportation modes into a single platform. Technological advancements, particularly in areas like AI and big data analytics, are enhancing the efficiency and personalization of MaaS services. Changing consumer preferences towards convenience, sustainability, and cost-effectiveness are further fueling market expansion. The global MaaS market size was valued at xx Million in 2024 and is expected to reach xx Million by 2033.
Key Markets & Segments Leading MaaS Market
North America currently dominates the MaaS market, driven by high levels of technological adoption, well-developed infrastructure, and supportive government policies. Within the market segmentation:
- By Service Type: The car segment holds the largest market share, followed by bus and bike services. This is primarily driven by the existing infrastructure and customer preference.
- By Transportation Type: The private transportation segment currently dominates, however, the public transportation segment is witnessing significant growth due to increasing integration of MaaS platforms with public transit systems.
Drivers for Market Dominance:
- North America: High technological adoption, robust infrastructure, substantial investments in smart city initiatives.
- Car Segment: Existing infrastructure, consumer preference, integration with existing ride-hailing services.
MaaS Market Product Developments
Recent product innovations in the MaaS sector include the development of sophisticated route optimization algorithms, integrated payment systems, and personalized travel recommendations. These advancements enhance the user experience and create competitive advantages for MaaS providers. The focus is on seamless integration of various transportation modes, real-time data analytics for improved service delivery, and enhanced personalization to cater to individual user needs.
Challenges in the MaaS Market
The MaaS market faces several challenges, including regulatory hurdles related to data privacy and interoperability between different transportation systems. Supply chain issues, particularly in the procurement of electric vehicles and charging infrastructure for electric-based MaaS services, can impact operational efficiency and profitability. Intense competition from established players and new entrants necessitates continuous innovation and strategic partnerships to maintain market share.
Forces Driving MaaS Market Growth
Key growth drivers include technological advancements in AI, IoT, and big data analytics; increasing urbanization and traffic congestion; rising adoption of smartphones and mobile applications; and supportive government policies promoting sustainable transportation. The increasing demand for convenient, cost-effective, and sustainable transportation solutions further fuels market expansion.
Long-Term Growth Catalysts in the MaaS Market
Long-term growth is expected to be driven by continued technological innovation, strategic partnerships between MaaS providers and transportation authorities, and the expansion of MaaS services into new geographical markets. The development of integrated multimodal platforms and the incorporation of emerging technologies, such as autonomous vehicles, will significantly shape the future of the MaaS market.
Emerging Opportunities in MaaS Market
Emerging opportunities include the integration of MaaS platforms with other smart city services, the development of personalized travel experiences, and the expansion of MaaS services into underserved markets. The rise of micromobility solutions and the growing adoption of electric vehicles present significant growth opportunities for MaaS providers.
Leading Players in the MaaS Market Sector
- The Hertz Corporation
- Moovel
- Uber Technologies Inc
- Mobileo
- Beeline Mobility
- Enterprise Holdings Inc
- Avis Budget Group
- Moovit Inc
- Whim (MaaS Global)
- Didi Chuxing
- Bridj Technology Pty Ltd
- Ubigo (via-id)
- Citymapper
Key Milestones in MaaS Market Industry
- February 2023: Uber partners with HSBC to launch a digital payment solution for drivers in Egypt, enhancing financial inclusion.
- January 2023: DiDi collaborates with Jordan Transfer Guidance for taxi dispatch services, supporting Jordan's MaaS and tourism initiatives.
- December 2022: Moovit launches a MaaS pilot program in Tampa, improving multimodal trip planning and transit access.
Strategic Outlook for MaaS Market
The MaaS market presents significant growth potential, driven by ongoing technological advancements, increasing demand for integrated transportation solutions, and supportive government policies. Strategic opportunities lie in the development of innovative MaaS platforms, expansion into new markets, and strategic partnerships with transportation authorities and technology companies. The future of MaaS is characterized by seamless integration, personalized experiences, and sustainable transportation options.
MaaS Market Segmentation
-
1. Service Type
- 1.1. Car
- 1.2. Bus
- 1.3. Bike
-
2. Transportation Type
- 2.1. Public
- 2.2. Private
MaaS Market Segmentation By Geography
-
1. North America
- 1.1. United States
- 1.2. Canada
- 1.3. Rest of North America
-
2. Europe
- 2.1. Germany
- 2.2. United Kingdom
- 2.3. France
- 2.4. Rest of Europe
-
3. Asia Pacific
- 3.1. India
- 3.2. China
- 3.3. Japan
- 3.4. South Korea
- 3.5. Rest of Asia Pacific
-
4. Rest of the World
- 4.1. South America
- 4.2. Middle East and Africa
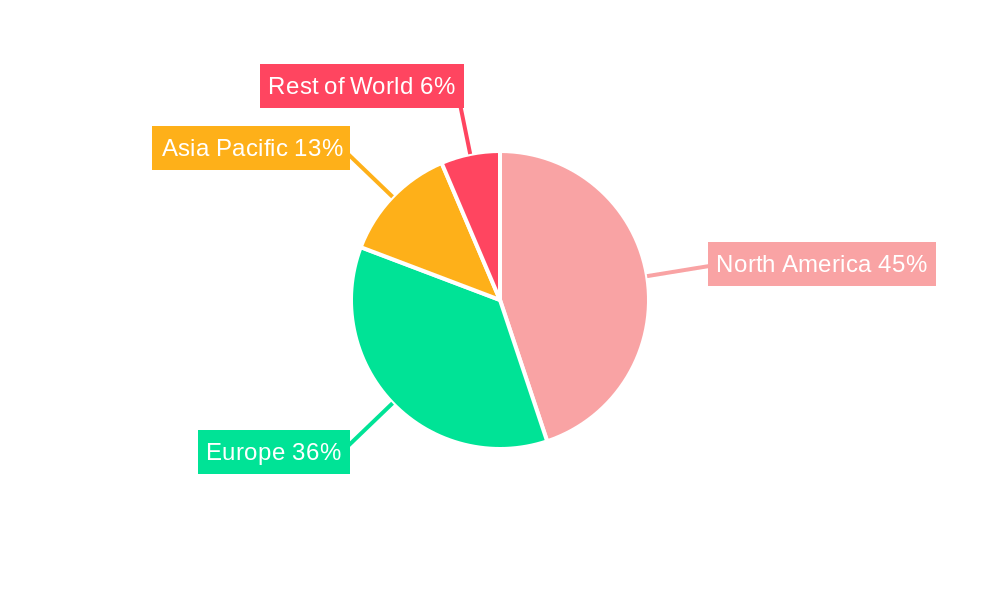
MaaS Market Regional Market Share
Geographic Coverage of MaaS Market
MaaS Market REPORT HIGHLIGHTS
| Aspects | Details |
|---|---|
| Study Period | 2020-2034 |
| Base Year | 2025 |
| Estimated Year | 2026 |
| Forecast Period | 2026-2034 |
| Historical Period | 2020-2025 |
| Growth Rate | CAGR of 7.43% from 2020-2034 |
| Segmentation |
|
Table of Contents
- 1. Introduction
- 1.1. Research Scope
- 1.2. Market Segmentation
- 1.3. Research Objective
- 1.4. Definitions and Assumptions
- 2. Executive Summary
- 2.1. Market Snapshot
- 3. Market Dynamics
- 3.1. Market Drivers
- 3.2. Market Restrains
- 3.3. Market Trends
- 3.4. Market Opportunities
- 4. Market Factor Analysis
- 4.1. Porters Five Forces
- 4.1.1. Bargaining Power of Suppliers
- 4.1.2. Bargaining Power of Buyers
- 4.1.3. Threat of New Entrants
- 4.1.4. Threat of Substitutes
- 4.1.5. Competitive Rivalry
- 4.2. PESTEL analysis
- 4.3. BCG Analysis
- 4.3.1. Stars (High Growth, High Market Share)
- 4.3.2. Cash Cows (Low Growth, High Market Share)
- 4.3.3. Question Mark (High Growth, Low Market Share)
- 4.3.4. Dogs (Low Growth, Low Market Share)
- 4.4. Ansoff Matrix Analysis
- 4.5. Supply Chain Analysis
- 4.6. Regulatory Landscape
- 4.7. Current Market Potential and Opportunity Assessment (TAM–SAM–SOM Framework)
- 4.8. MSR Analyst Note
- 4.1. Porters Five Forces
- 5. Market Analysis, Insights and Forecast 2021-2033
- 5.1. Market Analysis, Insights and Forecast - by Service Type
- 5.1.1. Car
- 5.1.2. Bus
- 5.1.3. Bike
- 5.2. Market Analysis, Insights and Forecast - by Transportation Type
- 5.2.1. Public
- 5.2.2. Private
- 5.3. Market Analysis, Insights and Forecast - by Region
- 5.3.1. North America
- 5.3.2. Europe
- 5.3.3. Asia Pacific
- 5.3.4. Rest of the World
- 5.1. Market Analysis, Insights and Forecast - by Service Type
- 6. Global MaaS Market Analysis, Insights and Forecast, 2021-2033
- 6.1. Market Analysis, Insights and Forecast - by Service Type
- 6.1.1. Car
- 6.1.2. Bus
- 6.1.3. Bike
- 6.2. Market Analysis, Insights and Forecast - by Transportation Type
- 6.2.1. Public
- 6.2.2. Private
- 6.1. Market Analysis, Insights and Forecast - by Service Type
- 7. North America MaaS Market Analysis, Insights and Forecast, 2020-2032
- 7.1. Market Analysis, Insights and Forecast - by Service Type
- 7.1.1. Car
- 7.1.2. Bus
- 7.1.3. Bike
- 7.2. Market Analysis, Insights and Forecast - by Transportation Type
- 7.2.1. Public
- 7.2.2. Private
- 7.1. Market Analysis, Insights and Forecast - by Service Type
- 8. Europe MaaS Market Analysis, Insights and Forecast, 2020-2032
- 8.1. Market Analysis, Insights and Forecast - by Service Type
- 8.1.1. Car
- 8.1.2. Bus
- 8.1.3. Bike
- 8.2. Market Analysis, Insights and Forecast - by Transportation Type
- 8.2.1. Public
- 8.2.2. Private
- 8.1. Market Analysis, Insights and Forecast - by Service Type
- 9. Asia Pacific MaaS Market Analysis, Insights and Forecast, 2020-2032
- 9.1. Market Analysis, Insights and Forecast - by Service Type
- 9.1.1. Car
- 9.1.2. Bus
- 9.1.3. Bike
- 9.2. Market Analysis, Insights and Forecast - by Transportation Type
- 9.2.1. Public
- 9.2.2. Private
- 9.1. Market Analysis, Insights and Forecast - by Service Type
- 10. Rest of the World MaaS Market Analysis, Insights and Forecast, 2020-2032
- 10.1. Market Analysis, Insights and Forecast - by Service Type
- 10.1.1. Car
- 10.1.2. Bus
- 10.1.3. Bike
- 10.2. Market Analysis, Insights and Forecast - by Transportation Type
- 10.2.1. Public
- 10.2.2. Private
- 10.1. Market Analysis, Insights and Forecast - by Service Type
- 11. Competitive Analysis
- 11.1. Company Profiles
- 11.1.1 The Hertz Corporation
- 11.1.1.1. Company Overview
- 11.1.1.2. Products
- 11.1.1.3. Company Financials
- 11.1.1.4. SWOT Analysis
- 11.1.2 Moovel
- 11.1.2.1. Company Overview
- 11.1.2.2. Products
- 11.1.2.3. Company Financials
- 11.1.2.4. SWOT Analysis
- 11.1.3 Uber Technologies Inc
- 11.1.3.1. Company Overview
- 11.1.3.2. Products
- 11.1.3.3. Company Financials
- 11.1.3.4. SWOT Analysis
- 11.1.4 Mobileo
- 11.1.4.1. Company Overview
- 11.1.4.2. Products
- 11.1.4.3. Company Financials
- 11.1.4.4. SWOT Analysis
- 11.1.5 Beeline Mobility
- 11.1.5.1. Company Overview
- 11.1.5.2. Products
- 11.1.5.3. Company Financials
- 11.1.5.4. SWOT Analysis
- 11.1.6 Enterprise Holdings Inc
- 11.1.6.1. Company Overview
- 11.1.6.2. Products
- 11.1.6.3. Company Financials
- 11.1.6.4. SWOT Analysis
- 11.1.7 Avis Budget Group
- 11.1.7.1. Company Overview
- 11.1.7.2. Products
- 11.1.7.3. Company Financials
- 11.1.7.4. SWOT Analysis
- 11.1.8 Moovit Inc
- 11.1.8.1. Company Overview
- 11.1.8.2. Products
- 11.1.8.3. Company Financials
- 11.1.8.4. SWOT Analysis
- 11.1.9 Whim (Maas Global)
- 11.1.9.1. Company Overview
- 11.1.9.2. Products
- 11.1.9.3. Company Financials
- 11.1.9.4. SWOT Analysis
- 11.1.10 Didi Chuxing
- 11.1.10.1. Company Overview
- 11.1.10.2. Products
- 11.1.10.3. Company Financials
- 11.1.10.4. SWOT Analysis
- 11.1.11 Bridj Technology Pty Ltd
- 11.1.11.1. Company Overview
- 11.1.11.2. Products
- 11.1.11.3. Company Financials
- 11.1.11.4. SWOT Analysis
- 11.1.12 Ubigo (via-id)
- 11.1.12.1. Company Overview
- 11.1.12.2. Products
- 11.1.12.3. Company Financials
- 11.1.12.4. SWOT Analysis
- 11.1.13 Citymapper
- 11.1.13.1. Company Overview
- 11.1.13.2. Products
- 11.1.13.3. Company Financials
- 11.1.13.4. SWOT Analysis
- 11.1.1 The Hertz Corporation
- 11.2. Market Entropy
- 11.2.1 Company's Key Areas Served
- 11.2.2 Recent Developments
- 11.3. Company Market Share Analysis 2025
- 11.3.1 Top 5 Companies Market Share Analysis
- 11.3.2 Top 3 Companies Market Share Analysis
- 11.4. List of Potential Customers
- 12. Research Methodology
List of Figures
- Figure 1: Global MaaS Market Revenue Breakdown (Million, %) by Region 2025 & 2033
- Figure 2: North America MaaS Market Revenue (Million), by Service Type 2025 & 2033
- Figure 3: North America MaaS Market Revenue Share (%), by Service Type 2025 & 2033
- Figure 4: North America MaaS Market Revenue (Million), by Transportation Type 2025 & 2033
- Figure 5: North America MaaS Market Revenue Share (%), by Transportation Type 2025 & 2033
- Figure 6: North America MaaS Market Revenue (Million), by Country 2025 & 2033
- Figure 7: North America MaaS Market Revenue Share (%), by Country 2025 & 2033
- Figure 8: Europe MaaS Market Revenue (Million), by Service Type 2025 & 2033
- Figure 9: Europe MaaS Market Revenue Share (%), by Service Type 2025 & 2033
- Figure 10: Europe MaaS Market Revenue (Million), by Transportation Type 2025 & 2033
- Figure 11: Europe MaaS Market Revenue Share (%), by Transportation Type 2025 & 2033
- Figure 12: Europe MaaS Market Revenue (Million), by Country 2025 & 2033
- Figure 13: Europe MaaS Market Revenue Share (%), by Country 2025 & 2033
- Figure 14: Asia Pacific MaaS Market Revenue (Million), by Service Type 2025 & 2033
- Figure 15: Asia Pacific MaaS Market Revenue Share (%), by Service Type 2025 & 2033
- Figure 16: Asia Pacific MaaS Market Revenue (Million), by Transportation Type 2025 & 2033
- Figure 17: Asia Pacific MaaS Market Revenue Share (%), by Transportation Type 2025 & 2033
- Figure 18: Asia Pacific MaaS Market Revenue (Million), by Country 2025 & 2033
- Figure 19: Asia Pacific MaaS Market Revenue Share (%), by Country 2025 & 2033
- Figure 20: Rest of the World MaaS Market Revenue (Million), by Service Type 2025 & 2033
- Figure 21: Rest of the World MaaS Market Revenue Share (%), by Service Type 2025 & 2033
- Figure 22: Rest of the World MaaS Market Revenue (Million), by Transportation Type 2025 & 2033
- Figure 23: Rest of the World MaaS Market Revenue Share (%), by Transportation Type 2025 & 2033
- Figure 24: Rest of the World MaaS Market Revenue (Million), by Country 2025 & 2033
- Figure 25: Rest of the World MaaS Market Revenue Share (%), by Country 2025 & 2033
List of Tables
- Table 1: Global MaaS Market Revenue Million Forecast, by Service Type 2020 & 2033
- Table 2: Global MaaS Market Revenue Million Forecast, by Transportation Type 2020 & 2033
- Table 3: Global MaaS Market Revenue Million Forecast, by Region 2020 & 2033
- Table 4: Global MaaS Market Revenue Million Forecast, by Service Type 2020 & 2033
- Table 5: Global MaaS Market Revenue Million Forecast, by Transportation Type 2020 & 2033
- Table 6: Global MaaS Market Revenue Million Forecast, by Country 2020 & 2033
- Table 7: United States MaaS Market Revenue (Million) Forecast, by Application 2020 & 2033
- Table 8: Canada MaaS Market Revenue (Million) Forecast, by Application 2020 & 2033
- Table 9: Rest of North America MaaS Market Revenue (Million) Forecast, by Application 2020 & 2033
- Table 10: Global MaaS Market Revenue Million Forecast, by Service Type 2020 & 2033
- Table 11: Global MaaS Market Revenue Million Forecast, by Transportation Type 2020 & 2033
- Table 12: Global MaaS Market Revenue Million Forecast, by Country 2020 & 2033
- Table 13: Germany MaaS Market Revenue (Million) Forecast, by Application 2020 & 2033
- Table 14: United Kingdom MaaS Market Revenue (Million) Forecast, by Application 2020 & 2033
- Table 15: France MaaS Market Revenue (Million) Forecast, by Application 2020 & 2033
- Table 16: Rest of Europe MaaS Market Revenue (Million) Forecast, by Application 2020 & 2033
- Table 17: Global MaaS Market Revenue Million Forecast, by Service Type 2020 & 2033
- Table 18: Global MaaS Market Revenue Million Forecast, by Transportation Type 2020 & 2033
- Table 19: Global MaaS Market Revenue Million Forecast, by Country 2020 & 2033
- Table 20: India MaaS Market Revenue (Million) Forecast, by Application 2020 & 2033
- Table 21: China MaaS Market Revenue (Million) Forecast, by Application 2020 & 2033
- Table 22: Japan MaaS Market Revenue (Million) Forecast, by Application 2020 & 2033
- Table 23: South Korea MaaS Market Revenue (Million) Forecast, by Application 2020 & 2033
- Table 24: Rest of Asia Pacific MaaS Market Revenue (Million) Forecast, by Application 2020 & 2033
- Table 25: Global MaaS Market Revenue Million Forecast, by Service Type 2020 & 2033
- Table 26: Global MaaS Market Revenue Million Forecast, by Transportation Type 2020 & 2033
- Table 27: Global MaaS Market Revenue Million Forecast, by Country 2020 & 2033
- Table 28: South America MaaS Market Revenue (Million) Forecast, by Application 2020 & 2033
- Table 29: Middle East and Africa MaaS Market Revenue (Million) Forecast, by Application 2020 & 2033
Frequently Asked Questions
1. What is the projected Compound Annual Growth Rate (CAGR) of the MaaS Market?
The projected CAGR is approximately 7.43%.
2. Which companies are prominent players in the MaaS Market?
Key companies in the market include The Hertz Corporation, Moovel, Uber Technologies Inc, Mobileo, Beeline Mobility, Enterprise Holdings Inc, Avis Budget Group, Moovit Inc, Whim (Maas Global), Didi Chuxing, Bridj Technology Pty Ltd, Ubigo (via-id), Citymapper.
3. What are the main segments of the MaaS Market?
The market segments include Service Type, Transportation Type.
4. Can you provide details about the market size?
The market size is estimated to be USD 0.78 Million as of 2022.
5. What are some drivers contributing to market growth?
Increasing Vehicle Production; Emphasis on Vehicle Comfort and NVH Reduction.
6. What are the notable trends driving market growth?
Increasing Traffic Congestion Drive the Demand in the Market.
7. Are there any restraints impacting market growth?
Economic Fluctuations And Uncertainties.
8. Can you provide examples of recent developments in the market?
In February 2023, Uber partnered with financial services firm HSBC to launch a digital payments solution that allows unbanked drivers in Egypt to receive on-demand cash outs into mobile wallets. Through this collaboration, the companies hope to provide Uber platform drivers with access to 100% of their earnings in a timely and convenient manner via HSBC Net's payment solution.
9. What pricing options are available for accessing the report?
Pricing options include single-user, multi-user, and enterprise licenses priced at USD 4750, USD 5250, and USD 8750 respectively.
10. Is the market size provided in terms of value or volume?
The market size is provided in terms of value, measured in Million.
11. Are there any specific market keywords associated with the report?
Yes, the market keyword associated with the report is "MaaS Market," which aids in identifying and referencing the specific market segment covered.
12. How do I determine which pricing option suits my needs best?
The pricing options vary based on user requirements and access needs. Individual users may opt for single-user licenses, while businesses requiring broader access may choose multi-user or enterprise licenses for cost-effective access to the report.
13. Are there any additional resources or data provided in the MaaS Market report?
While the report offers comprehensive insights, it's advisable to review the specific contents or supplementary materials provided to ascertain if additional resources or data are available.
14. How can I stay updated on further developments or reports in the MaaS Market?
To stay informed about further developments, trends, and reports in the MaaS Market, consider subscribing to industry newsletters, following relevant companies and organizations, or regularly checking reputable industry news sources and publications.
Methodology
Step 1 - Identification of Relevant Samples Size from Population Database


Step 2 - Approaches for Defining Global Market Size (Value, Volume* & Price*)

Note*: In applicable scenarios
Step 3 - Data Sources
Primary Research
- Web Analytics
- Survey Reports
- Research Institute
- Latest Research Reports
- Opinion Leaders
Secondary Research
- Annual Reports
- White Paper
- Latest Press Release
- Industry Association
- Paid Database
- Investor Presentations

Step 4 - Data Triangulation
Involves using different sources of information in order to increase the validity of a study
These sources are likely to be stakeholders in a program - participants, other researchers, program staff, other community members, and so on.
Then we put all data in single framework & apply various statistical tools to find out the dynamic on the market.
During the analysis stage, feedback from the stakeholder groups would be compared to determine areas of agreement as well as areas of divergence