

Key Insights
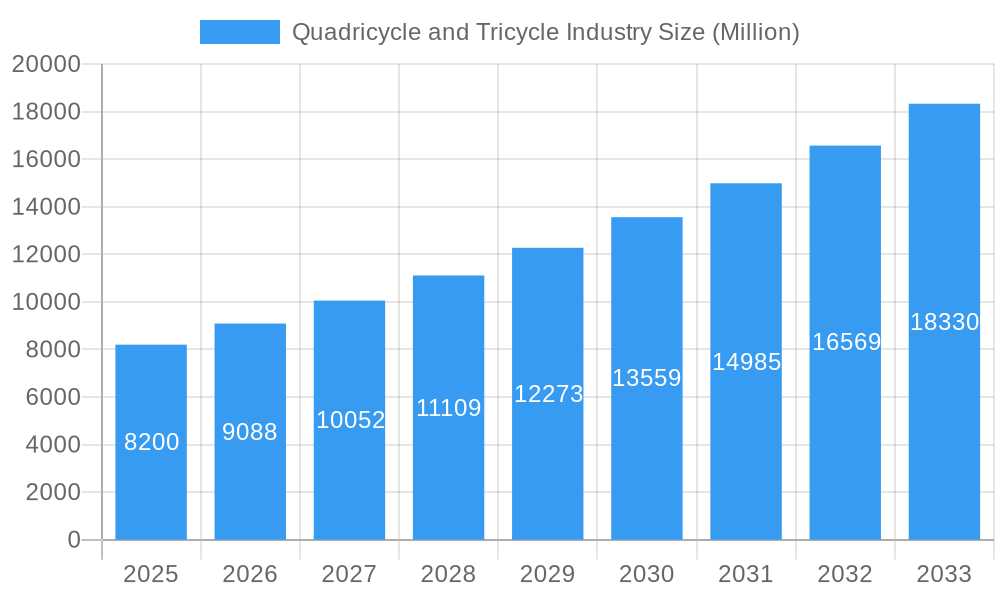
The global quadricycle and tricycle market, valued at $8.20 billion in 2025, is projected to experience robust growth, driven by increasing urbanization, rising demand for last-mile delivery solutions, and the growing popularity of eco-friendly transportation options, particularly electric models. The market's Compound Annual Growth Rate (CAGR) of 10.84% from 2025 to 2033 signifies substantial expansion opportunities. Several factors contribute to this growth. The personal segment is fueled by affordability and ease of maneuverability in congested urban areas, while the commercial sector benefits from cost-effective delivery and transportation solutions for businesses. Electric quadricycles and tricycles are gaining significant traction due to government incentives promoting sustainable transportation and growing environmental concerns. Technological advancements, including improved battery technology and enhanced safety features, are further boosting market appeal. However, challenges remain, including infrastructural limitations for electric vehicle charging and the potential for regulatory hurdles in different regions. Competition is fierce, with established players like Bajaj Auto and Mahindra & Mahindra competing with emerging electric vehicle manufacturers. The market segmentation by vehicle type (quadricycle vs. tricycle) and power source (electric, gasoline, solar) provides valuable insights for strategic investment and market penetration. Regional variations are expected, with Asia Pacific, particularly India and China, anticipated to dominate due to high population density and growing demand. North America and Europe are expected to exhibit steady growth, driven by the increasing adoption of electric models and supportive government policies.
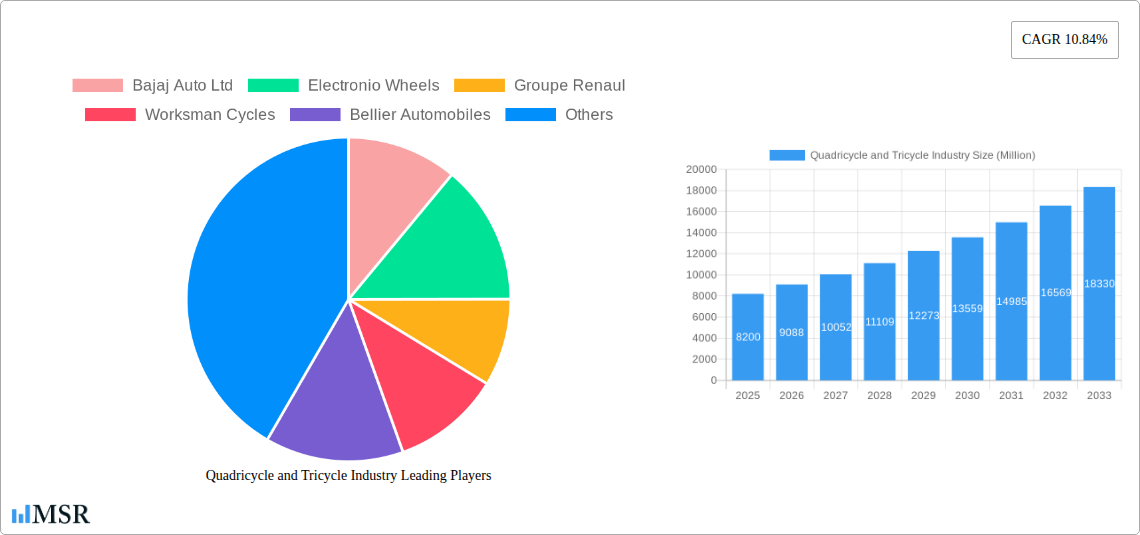
Quadricycle and Tricycle Industry Market Size (In Billion)
The forecast period (2025-2033) promises a dynamic landscape for quadricycle and tricycle manufacturers. Companies will need to focus on innovation, strategic partnerships, and aggressive marketing strategies to gain a competitive edge. The market’s success hinges on addressing infrastructural needs, regulatory compliance, and continued technological advancement in battery technology and vehicle safety. Focusing on niche markets, such as specialized delivery solutions or tourism, will also prove beneficial. Successful companies will be adept at catering to the diverse needs of individual consumers and businesses alike, leveraging the advantages of both conventional and electric power sources across varied vehicle types. The growing acceptance of electric options will necessitate investment in charging infrastructure and robust after-sales service to ensure customer satisfaction and build trust.
Quadricycle and Tricycle Industry Company Market Share
Quadricycle and Tricycle Industry Market Report: 2019-2033
This comprehensive report provides an in-depth analysis of the global Quadricycle and Tricycle Industry, offering invaluable insights for industry stakeholders, investors, and strategic decision-makers. Covering the period 2019-2033, with a focus on 2025, this report analyzes market dynamics, key segments, leading players, and future growth potential. The global market value is projected to reach xx Million by 2033, showcasing substantial growth opportunities.
Quadricycle and Tricycle Industry Market Concentration & Dynamics
This section assesses the competitive landscape of the Quadricycle and Tricycle industry, examining market concentration, innovation, regulations, and market dynamics. The study period (2019-2024) reveals a moderately concentrated market, with key players like Bajaj Auto Ltd, Mahindra and Mahindra, and Groupe Renault holding significant market share. However, the emergence of smaller, innovative players like Electronio Wheels and Estrima SRL is disrupting the status quo.
- Market Concentration: The Herfindahl-Hirschman Index (HHI) is estimated at xx in 2024, indicating a moderately concentrated market.
- Innovation Ecosystem: Significant investments in electric and solar-powered models are driving innovation. The industry is witnessing a rise in lightweight materials and advanced battery technologies.
- Regulatory Frameworks: Varying regulations across different regions impact market growth. Stringent emission standards and safety regulations are shaping product development strategies.
- Substitute Products: Competition from other personal transportation modes, such as motorcycles and scooters, influences market growth. However, the unique advantages of quadricycles and tricycles, especially in last-mile delivery and urban mobility, create a niche market.
- End-User Trends: Increasing urbanization and the need for affordable transportation solutions drive demand, particularly in developing economies. The growing preference for eco-friendly vehicles also boosts the electric and solar segment.
- M&A Activities: The historical period (2019-2024) saw approximately xx M&A deals, with a focus on consolidation and technology acquisition.
Quadricycle and Tricycle Industry Industry Insights & Trends
The global Quadricycle and Tricycle market is experiencing robust growth, driven by several factors. The market size was valued at xx Million in 2024 and is projected to reach xx Million by 2033, exhibiting a Compound Annual Growth Rate (CAGR) of xx% during the forecast period (2025-2033). This growth is fueled by increasing urbanization, rising disposable incomes, especially in emerging markets, and the growing preference for fuel-efficient and environmentally friendly vehicles. Technological advancements in battery technology, lightweight materials, and improved safety features are further enhancing the appeal of these vehicles. Consumer behavior is shifting towards convenient and affordable transportation options, making quadricycles and tricycles attractive alternatives to traditional vehicles. Government initiatives promoting sustainable transportation are also playing a crucial role. The shift toward electric and solar power sources is a key trend, driving innovation and creating new market opportunities. However, challenges remain, including infrastructure limitations and regulatory hurdles in some regions.
Key Markets & Segments Leading Quadricycle and Tricycle Industry
The Asia-Pacific region dominates the global market, driven by high population density, rapid urbanization, and increasing demand for affordable transportation. Within the segment breakdown:
- By Application Type: The commercial segment holds a larger market share, driven by the increasing demand for last-mile delivery solutions and urban logistics. The personal segment is growing steadily, primarily in developing countries.
- By Vehicle Type: Quadricycles currently hold a larger market share compared to tricycles due to their versatility and ability to accommodate more passengers.
- By Power Source Type: The gasoline-powered segment dominates currently, but the electric segment is exhibiting significant growth, fueled by environmental concerns and government incentives. The solar segment is still nascent but holds promising potential for future growth.
Drivers for dominant regions (Asia-Pacific):
- Rapid economic growth and rising disposable incomes.
- Growing urbanization and increasing traffic congestion.
- Supportive government policies promoting affordable transportation.
- Expanding last-mile delivery networks.
Quadricycle and Tricycle Industry Product Developments
Recent product innovations focus on enhanced safety features, improved fuel efficiency, and the integration of advanced technologies such as electric powertrains and telematics systems. Companies are focusing on lightweight designs and improved ergonomics to enhance user experience. The market is witnessing the introduction of electric and solar-powered models, catering to the growing demand for environmentally friendly transportation solutions. These developments are creating competitive advantages and shaping the future of the industry.
Challenges in the Quadricycle and Tricycle Industry Market
The Quadricycle and Tricycle industry faces several challenges including stringent emission regulations that increase manufacturing costs, fluctuating raw material prices impacting profitability, and intense competition from established automotive players and emerging startups. Supply chain disruptions and the need for robust charging infrastructure for electric models also pose significant challenges. Furthermore, varying safety standards across different regions add complexity to market entry. These factors, together, impact market growth and profitability.
Forces Driving Quadricycle and Tricycle Industry Growth
Key growth drivers include increasing urbanization and the need for affordable last-mile delivery solutions. Government incentives for electric vehicles and supportive policies promoting sustainable transport also fuel market expansion. Technological advancements, such as improved battery technology and lighter materials, are making these vehicles more efficient and attractive. Expanding infrastructure in developing countries creates new market opportunities.
Long-Term Growth Catalysts in the Quadricycle and Tricycle Industry
Long-term growth will be driven by strategic partnerships between manufacturers and battery technology providers, resulting in improved product performance and lower costs. Expansion into new markets, particularly in Africa and South America, presents significant potential. Continuous innovation in electric and solar technologies will lead to a greener and more sustainable industry.
Emerging Opportunities in Quadricycle and Tricycle Industry
Emerging opportunities lie in the development of specialized vehicles for specific applications, such as cargo delivery, tourism, and agricultural use. The integration of smart technologies, such as GPS tracking and connected vehicle features, offers significant potential. The growing adoption of shared mobility services presents new opportunities for fleet operators.
Leading Players in the Quadricycle and Tricycle Industry Sector
- Bajaj Auto Ltd
- Electronio Wheels
- Groupe Renault
- Worksman Cycles
- Bellier Automobiles
- Mahindra and Mahindra
- Light Foot Cycle
- Automobiles CHATENET
- Estrima SRL
- Daimus
- Ligier Group
- Aixam-Mega
Key Milestones in Quadricycle and Tricycle Industry Industry
- 2020: Bajaj Auto Ltd launched a new electric quadricycle model.
- 2021: Several key players announced investments in electric vehicle technology.
- 2022: New safety regulations were implemented in several key markets.
- 2023: Significant investments were made in the development of solar-powered quadricycles.
- 2024: Several mergers and acquisitions took place, leading to increased market consolidation.
Strategic Outlook for Quadricycle and Tricycle Industry Market
The future of the Quadricycle and Tricycle industry is bright, driven by strong growth in emerging markets and technological advancements. Strategic partnerships, focused on innovation and expanding into new segments, will be crucial for success. Companies that can adapt to evolving consumer preferences and regulatory changes will be well-positioned to capture significant market share. The industry is poised for considerable expansion, offering substantial opportunities for investors and industry participants.
Quadricycle and Tricycle Industry Segmentation
-
1. Power Source Type
- 1.1. Electric
- 1.2. Gasoline
- 1.3. Solar
-
2. Application Type
- 2.1. Personal
- 2.2. Commercial
-
3. Vehicle Type
- 3.1. Quadricycle
- 3.2. Tricycle
Quadricycle and Tricycle Industry Segmentation By Geography
-
1. North America
- 1.1. United States
- 1.2. Canada
- 1.3. Rest of North America
-
2. Europe
- 2.1. Germany
- 2.2. United Kingdom
- 2.3. France
- 2.4. Italy
- 2.5. Rest of Europe
-
3. Asia Pacific
- 3.1. China
- 3.2. Japan
- 3.3. India
- 3.4. South Korea
- 3.5. Rest of Asia Pacific
-
4. Rest of the World
- 4.1. Brazil
- 4.2. South Africa
- 4.3. United Arab Emirates
- 4.4. Other Countries
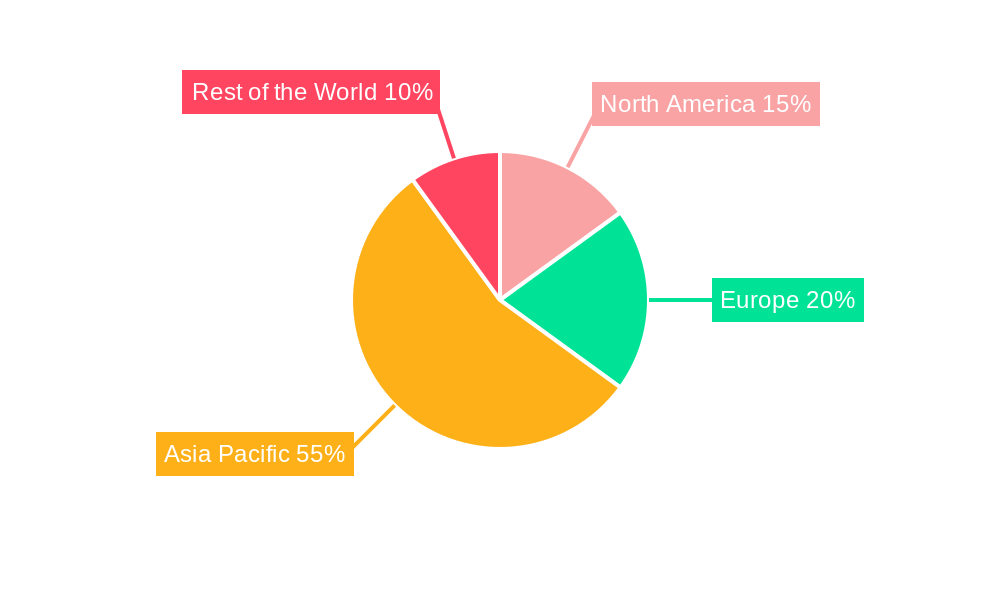
Quadricycle and Tricycle Industry Regional Market Share
Geographic Coverage of Quadricycle and Tricycle Industry
Quadricycle and Tricycle Industry REPORT HIGHLIGHTS
| Aspects | Details |
|---|---|
| Study Period | 2020-2034 |
| Base Year | 2025 |
| Estimated Year | 2026 |
| Forecast Period | 2026-2034 |
| Historical Period | 2020-2025 |
| Growth Rate | CAGR of 10.84% from 2020-2034 |
| Segmentation |
|
Table of Contents
- 1. Introduction
- 1.1. Research Scope
- 1.2. Market Segmentation
- 1.3. Research Objective
- 1.4. Definitions and Assumptions
- 2. Executive Summary
- 2.1. Market Snapshot
- 3. Market Dynamics
- 3.1. Market Drivers
- 3.2. Market Restrains
- 3.3. Market Trends
- 3.4. Market Opportunities
- 4. Market Factor Analysis
- 4.1. Porters Five Forces
- 4.1.1. Bargaining Power of Suppliers
- 4.1.2. Bargaining Power of Buyers
- 4.1.3. Threat of New Entrants
- 4.1.4. Threat of Substitutes
- 4.1.5. Competitive Rivalry
- 4.2. PESTEL analysis
- 4.3. BCG Analysis
- 4.3.1. Stars (High Growth, High Market Share)
- 4.3.2. Cash Cows (Low Growth, High Market Share)
- 4.3.3. Question Mark (High Growth, Low Market Share)
- 4.3.4. Dogs (Low Growth, Low Market Share)
- 4.4. Ansoff Matrix Analysis
- 4.5. Supply Chain Analysis
- 4.6. Regulatory Landscape
- 4.7. Current Market Potential and Opportunity Assessment (TAM–SAM–SOM Framework)
- 4.8. MSR Analyst Note
- 4.1. Porters Five Forces
- 5. Market Analysis, Insights and Forecast 2021-2033
- 5.1. Market Analysis, Insights and Forecast - by Power Source Type
- 5.1.1. Electric
- 5.1.2. Gasoline
- 5.1.3. Solar
- 5.2. Market Analysis, Insights and Forecast - by Application Type
- 5.2.1. Personal
- 5.2.2. Commercial
- 5.3. Market Analysis, Insights and Forecast - by Vehicle Type
- 5.3.1. Quadricycle
- 5.3.2. Tricycle
- 5.4. Market Analysis, Insights and Forecast - by Region
- 5.4.1. North America
- 5.4.2. Europe
- 5.4.3. Asia Pacific
- 5.4.4. Rest of the World
- 5.1. Market Analysis, Insights and Forecast - by Power Source Type
- 6. Global Quadricycle and Tricycle Industry Analysis, Insights and Forecast, 2021-2033
- 6.1. Market Analysis, Insights and Forecast - by Power Source Type
- 6.1.1. Electric
- 6.1.2. Gasoline
- 6.1.3. Solar
- 6.2. Market Analysis, Insights and Forecast - by Application Type
- 6.2.1. Personal
- 6.2.2. Commercial
- 6.3. Market Analysis, Insights and Forecast - by Vehicle Type
- 6.3.1. Quadricycle
- 6.3.2. Tricycle
- 6.1. Market Analysis, Insights and Forecast - by Power Source Type
- 7. North America Quadricycle and Tricycle Industry Analysis, Insights and Forecast, 2020-2032
- 7.1. Market Analysis, Insights and Forecast - by Power Source Type
- 7.1.1. Electric
- 7.1.2. Gasoline
- 7.1.3. Solar
- 7.2. Market Analysis, Insights and Forecast - by Application Type
- 7.2.1. Personal
- 7.2.2. Commercial
- 7.3. Market Analysis, Insights and Forecast - by Vehicle Type
- 7.3.1. Quadricycle
- 7.3.2. Tricycle
- 7.1. Market Analysis, Insights and Forecast - by Power Source Type
- 8. Europe Quadricycle and Tricycle Industry Analysis, Insights and Forecast, 2020-2032
- 8.1. Market Analysis, Insights and Forecast - by Power Source Type
- 8.1.1. Electric
- 8.1.2. Gasoline
- 8.1.3. Solar
- 8.2. Market Analysis, Insights and Forecast - by Application Type
- 8.2.1. Personal
- 8.2.2. Commercial
- 8.3. Market Analysis, Insights and Forecast - by Vehicle Type
- 8.3.1. Quadricycle
- 8.3.2. Tricycle
- 8.1. Market Analysis, Insights and Forecast - by Power Source Type
- 9. Asia Pacific Quadricycle and Tricycle Industry Analysis, Insights and Forecast, 2020-2032
- 9.1. Market Analysis, Insights and Forecast - by Power Source Type
- 9.1.1. Electric
- 9.1.2. Gasoline
- 9.1.3. Solar
- 9.2. Market Analysis, Insights and Forecast - by Application Type
- 9.2.1. Personal
- 9.2.2. Commercial
- 9.3. Market Analysis, Insights and Forecast - by Vehicle Type
- 9.3.1. Quadricycle
- 9.3.2. Tricycle
- 9.1. Market Analysis, Insights and Forecast - by Power Source Type
- 10. Rest of the World Quadricycle and Tricycle Industry Analysis, Insights and Forecast, 2020-2032
- 10.1. Market Analysis, Insights and Forecast - by Power Source Type
- 10.1.1. Electric
- 10.1.2. Gasoline
- 10.1.3. Solar
- 10.2. Market Analysis, Insights and Forecast - by Application Type
- 10.2.1. Personal
- 10.2.2. Commercial
- 10.3. Market Analysis, Insights and Forecast - by Vehicle Type
- 10.3.1. Quadricycle
- 10.3.2. Tricycle
- 10.1. Market Analysis, Insights and Forecast - by Power Source Type
- 11. Competitive Analysis
- 11.1. Company Profiles
- 11.1.1 Bajaj Auto Ltd
- 11.1.1.1. Company Overview
- 11.1.1.2. Products
- 11.1.1.3. Company Financials
- 11.1.1.4. SWOT Analysis
- 11.1.2 Electronio Wheels
- 11.1.2.1. Company Overview
- 11.1.2.2. Products
- 11.1.2.3. Company Financials
- 11.1.2.4. SWOT Analysis
- 11.1.3 Groupe Renaul
- 11.1.3.1. Company Overview
- 11.1.3.2. Products
- 11.1.3.3. Company Financials
- 11.1.3.4. SWOT Analysis
- 11.1.4 Worksman Cycles
- 11.1.4.1. Company Overview
- 11.1.4.2. Products
- 11.1.4.3. Company Financials
- 11.1.4.4. SWOT Analysis
- 11.1.5 Bellier Automobiles
- 11.1.5.1. Company Overview
- 11.1.5.2. Products
- 11.1.5.3. Company Financials
- 11.1.5.4. SWOT Analysis
- 11.1.6 Mahindra and Mahindra
- 11.1.6.1. Company Overview
- 11.1.6.2. Products
- 11.1.6.3. Company Financials
- 11.1.6.4. SWOT Analysis
- 11.1.7 Light Foot Cycle
- 11.1.7.1. Company Overview
- 11.1.7.2. Products
- 11.1.7.3. Company Financials
- 11.1.7.4. SWOT Analysis
- 11.1.8 Automobiles CHATENET
- 11.1.8.1. Company Overview
- 11.1.8.2. Products
- 11.1.8.3. Company Financials
- 11.1.8.4. SWOT Analysis
- 11.1.9 Estrima SRL
- 11.1.9.1. Company Overview
- 11.1.9.2. Products
- 11.1.9.3. Company Financials
- 11.1.9.4. SWOT Analysis
- 11.1.10 Daimus
- 11.1.10.1. Company Overview
- 11.1.10.2. Products
- 11.1.10.3. Company Financials
- 11.1.10.4. SWOT Analysis
- 11.1.11 Ligier Group
- 11.1.11.1. Company Overview
- 11.1.11.2. Products
- 11.1.11.3. Company Financials
- 11.1.11.4. SWOT Analysis
- 11.1.12 Aixam-Mega
- 11.1.12.1. Company Overview
- 11.1.12.2. Products
- 11.1.12.3. Company Financials
- 11.1.12.4. SWOT Analysis
- 11.1.1 Bajaj Auto Ltd
- 11.2. Market Entropy
- 11.2.1 Company's Key Areas Served
- 11.2.2 Recent Developments
- 11.3. Company Market Share Analysis 2025
- 11.3.1 Top 5 Companies Market Share Analysis
- 11.3.2 Top 3 Companies Market Share Analysis
- 11.4. List of Potential Customers
- 12. Research Methodology
List of Figures
- Figure 1: Global Quadricycle and Tricycle Industry Revenue Breakdown (Million, %) by Region 2025 & 2033
- Figure 2: North America Quadricycle and Tricycle Industry Revenue (Million), by Power Source Type 2025 & 2033
- Figure 3: North America Quadricycle and Tricycle Industry Revenue Share (%), by Power Source Type 2025 & 2033
- Figure 4: North America Quadricycle and Tricycle Industry Revenue (Million), by Application Type 2025 & 2033
- Figure 5: North America Quadricycle and Tricycle Industry Revenue Share (%), by Application Type 2025 & 2033
- Figure 6: North America Quadricycle and Tricycle Industry Revenue (Million), by Vehicle Type 2025 & 2033
- Figure 7: North America Quadricycle and Tricycle Industry Revenue Share (%), by Vehicle Type 2025 & 2033
- Figure 8: North America Quadricycle and Tricycle Industry Revenue (Million), by Country 2025 & 2033
- Figure 9: North America Quadricycle and Tricycle Industry Revenue Share (%), by Country 2025 & 2033
- Figure 10: Europe Quadricycle and Tricycle Industry Revenue (Million), by Power Source Type 2025 & 2033
- Figure 11: Europe Quadricycle and Tricycle Industry Revenue Share (%), by Power Source Type 2025 & 2033
- Figure 12: Europe Quadricycle and Tricycle Industry Revenue (Million), by Application Type 2025 & 2033
- Figure 13: Europe Quadricycle and Tricycle Industry Revenue Share (%), by Application Type 2025 & 2033
- Figure 14: Europe Quadricycle and Tricycle Industry Revenue (Million), by Vehicle Type 2025 & 2033
- Figure 15: Europe Quadricycle and Tricycle Industry Revenue Share (%), by Vehicle Type 2025 & 2033
- Figure 16: Europe Quadricycle and Tricycle Industry Revenue (Million), by Country 2025 & 2033
- Figure 17: Europe Quadricycle and Tricycle Industry Revenue Share (%), by Country 2025 & 2033
- Figure 18: Asia Pacific Quadricycle and Tricycle Industry Revenue (Million), by Power Source Type 2025 & 2033
- Figure 19: Asia Pacific Quadricycle and Tricycle Industry Revenue Share (%), by Power Source Type 2025 & 2033
- Figure 20: Asia Pacific Quadricycle and Tricycle Industry Revenue (Million), by Application Type 2025 & 2033
- Figure 21: Asia Pacific Quadricycle and Tricycle Industry Revenue Share (%), by Application Type 2025 & 2033
- Figure 22: Asia Pacific Quadricycle and Tricycle Industry Revenue (Million), by Vehicle Type 2025 & 2033
- Figure 23: Asia Pacific Quadricycle and Tricycle Industry Revenue Share (%), by Vehicle Type 2025 & 2033
- Figure 24: Asia Pacific Quadricycle and Tricycle Industry Revenue (Million), by Country 2025 & 2033
- Figure 25: Asia Pacific Quadricycle and Tricycle Industry Revenue Share (%), by Country 2025 & 2033
- Figure 26: Rest of the World Quadricycle and Tricycle Industry Revenue (Million), by Power Source Type 2025 & 2033
- Figure 27: Rest of the World Quadricycle and Tricycle Industry Revenue Share (%), by Power Source Type 2025 & 2033
- Figure 28: Rest of the World Quadricycle and Tricycle Industry Revenue (Million), by Application Type 2025 & 2033
- Figure 29: Rest of the World Quadricycle and Tricycle Industry Revenue Share (%), by Application Type 2025 & 2033
- Figure 30: Rest of the World Quadricycle and Tricycle Industry Revenue (Million), by Vehicle Type 2025 & 2033
- Figure 31: Rest of the World Quadricycle and Tricycle Industry Revenue Share (%), by Vehicle Type 2025 & 2033
- Figure 32: Rest of the World Quadricycle and Tricycle Industry Revenue (Million), by Country 2025 & 2033
- Figure 33: Rest of the World Quadricycle and Tricycle Industry Revenue Share (%), by Country 2025 & 2033
List of Tables
- Table 1: Global Quadricycle and Tricycle Industry Revenue Million Forecast, by Power Source Type 2020 & 2033
- Table 2: Global Quadricycle and Tricycle Industry Revenue Million Forecast, by Application Type 2020 & 2033
- Table 3: Global Quadricycle and Tricycle Industry Revenue Million Forecast, by Vehicle Type 2020 & 2033
- Table 4: Global Quadricycle and Tricycle Industry Revenue Million Forecast, by Region 2020 & 2033
- Table 5: Global Quadricycle and Tricycle Industry Revenue Million Forecast, by Power Source Type 2020 & 2033
- Table 6: Global Quadricycle and Tricycle Industry Revenue Million Forecast, by Application Type 2020 & 2033
- Table 7: Global Quadricycle and Tricycle Industry Revenue Million Forecast, by Vehicle Type 2020 & 2033
- Table 8: Global Quadricycle and Tricycle Industry Revenue Million Forecast, by Country 2020 & 2033
- Table 9: United States Quadricycle and Tricycle Industry Revenue (Million) Forecast, by Application 2020 & 2033
- Table 10: Canada Quadricycle and Tricycle Industry Revenue (Million) Forecast, by Application 2020 & 2033
- Table 11: Rest of North America Quadricycle and Tricycle Industry Revenue (Million) Forecast, by Application 2020 & 2033
- Table 12: Global Quadricycle and Tricycle Industry Revenue Million Forecast, by Power Source Type 2020 & 2033
- Table 13: Global Quadricycle and Tricycle Industry Revenue Million Forecast, by Application Type 2020 & 2033
- Table 14: Global Quadricycle and Tricycle Industry Revenue Million Forecast, by Vehicle Type 2020 & 2033
- Table 15: Global Quadricycle and Tricycle Industry Revenue Million Forecast, by Country 2020 & 2033
- Table 16: Germany Quadricycle and Tricycle Industry Revenue (Million) Forecast, by Application 2020 & 2033
- Table 17: United Kingdom Quadricycle and Tricycle Industry Revenue (Million) Forecast, by Application 2020 & 2033
- Table 18: France Quadricycle and Tricycle Industry Revenue (Million) Forecast, by Application 2020 & 2033
- Table 19: Italy Quadricycle and Tricycle Industry Revenue (Million) Forecast, by Application 2020 & 2033
- Table 20: Rest of Europe Quadricycle and Tricycle Industry Revenue (Million) Forecast, by Application 2020 & 2033
- Table 21: Global Quadricycle and Tricycle Industry Revenue Million Forecast, by Power Source Type 2020 & 2033
- Table 22: Global Quadricycle and Tricycle Industry Revenue Million Forecast, by Application Type 2020 & 2033
- Table 23: Global Quadricycle and Tricycle Industry Revenue Million Forecast, by Vehicle Type 2020 & 2033
- Table 24: Global Quadricycle and Tricycle Industry Revenue Million Forecast, by Country 2020 & 2033
- Table 25: China Quadricycle and Tricycle Industry Revenue (Million) Forecast, by Application 2020 & 2033
- Table 26: Japan Quadricycle and Tricycle Industry Revenue (Million) Forecast, by Application 2020 & 2033
- Table 27: India Quadricycle and Tricycle Industry Revenue (Million) Forecast, by Application 2020 & 2033
- Table 28: South Korea Quadricycle and Tricycle Industry Revenue (Million) Forecast, by Application 2020 & 2033
- Table 29: Rest of Asia Pacific Quadricycle and Tricycle Industry Revenue (Million) Forecast, by Application 2020 & 2033
- Table 30: Global Quadricycle and Tricycle Industry Revenue Million Forecast, by Power Source Type 2020 & 2033
- Table 31: Global Quadricycle and Tricycle Industry Revenue Million Forecast, by Application Type 2020 & 2033
- Table 32: Global Quadricycle and Tricycle Industry Revenue Million Forecast, by Vehicle Type 2020 & 2033
- Table 33: Global Quadricycle and Tricycle Industry Revenue Million Forecast, by Country 2020 & 2033
- Table 34: Brazil Quadricycle and Tricycle Industry Revenue (Million) Forecast, by Application 2020 & 2033
- Table 35: South Africa Quadricycle and Tricycle Industry Revenue (Million) Forecast, by Application 2020 & 2033
- Table 36: United Arab Emirates Quadricycle and Tricycle Industry Revenue (Million) Forecast, by Application 2020 & 2033
- Table 37: Other Countries Quadricycle and Tricycle Industry Revenue (Million) Forecast, by Application 2020 & 2033
Frequently Asked Questions
1. What is the projected Compound Annual Growth Rate (CAGR) of the Quadricycle and Tricycle Industry?
The projected CAGR is approximately 10.84%.
2. Which companies are prominent players in the Quadricycle and Tricycle Industry?
Key companies in the market include Bajaj Auto Ltd, Electronio Wheels, Groupe Renaul, Worksman Cycles, Bellier Automobiles, Mahindra and Mahindra, Light Foot Cycle, Automobiles CHATENET, Estrima SRL, Daimus, Ligier Group, Aixam-Mega.
3. What are the main segments of the Quadricycle and Tricycle Industry?
The market segments include Power Source Type, Application Type, Vehicle Type.
4. Can you provide details about the market size?
The market size is estimated to be USD 8.20 Million as of 2022.
5. What are some drivers contributing to market growth?
Integration With Telematics And Fleet Management Systems; Others.
6. What are the notable trends driving market growth?
Growing Adoption of Quadricycles Expected to Enhance Demand in the Market.
7. Are there any restraints impacting market growth?
The Initial Costs Associated With Purchasing And Installing ELD Systems is High; Others.
8. Can you provide examples of recent developments in the market?
N/A
9. What pricing options are available for accessing the report?
Pricing options include single-user, multi-user, and enterprise licenses priced at USD 4750, USD 5250, and USD 8750 respectively.
10. Is the market size provided in terms of value or volume?
The market size is provided in terms of value, measured in Million.
11. Are there any specific market keywords associated with the report?
Yes, the market keyword associated with the report is "Quadricycle and Tricycle Industry," which aids in identifying and referencing the specific market segment covered.
12. How do I determine which pricing option suits my needs best?
The pricing options vary based on user requirements and access needs. Individual users may opt for single-user licenses, while businesses requiring broader access may choose multi-user or enterprise licenses for cost-effective access to the report.
13. Are there any additional resources or data provided in the Quadricycle and Tricycle Industry report?
While the report offers comprehensive insights, it's advisable to review the specific contents or supplementary materials provided to ascertain if additional resources or data are available.
14. How can I stay updated on further developments or reports in the Quadricycle and Tricycle Industry?
To stay informed about further developments, trends, and reports in the Quadricycle and Tricycle Industry, consider subscribing to industry newsletters, following relevant companies and organizations, or regularly checking reputable industry news sources and publications.
Methodology
Step 1 - Identification of Relevant Samples Size from Population Database


Step 2 - Approaches for Defining Global Market Size (Value, Volume* & Price*)

Note*: In applicable scenarios
Step 3 - Data Sources
Primary Research
- Web Analytics
- Survey Reports
- Research Institute
- Latest Research Reports
- Opinion Leaders
Secondary Research
- Annual Reports
- White Paper
- Latest Press Release
- Industry Association
- Paid Database
- Investor Presentations

Step 4 - Data Triangulation
Involves using different sources of information in order to increase the validity of a study
These sources are likely to be stakeholders in a program - participants, other researchers, program staff, other community members, and so on.
Then we put all data in single framework & apply various statistical tools to find out the dynamic on the market.
During the analysis stage, feedback from the stakeholder groups would be compared to determine areas of agreement as well as areas of divergence