

Key Insights
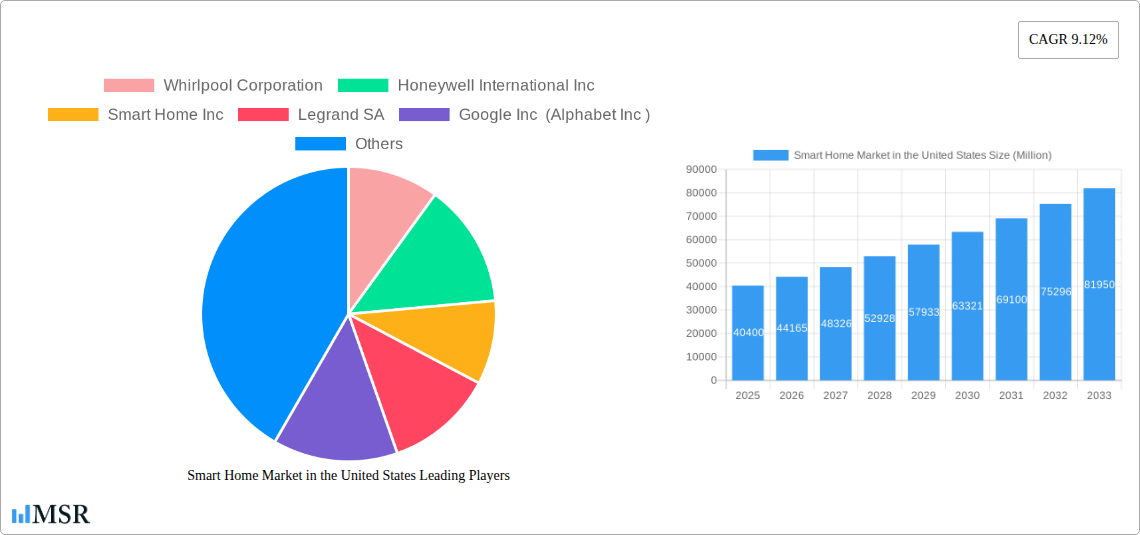
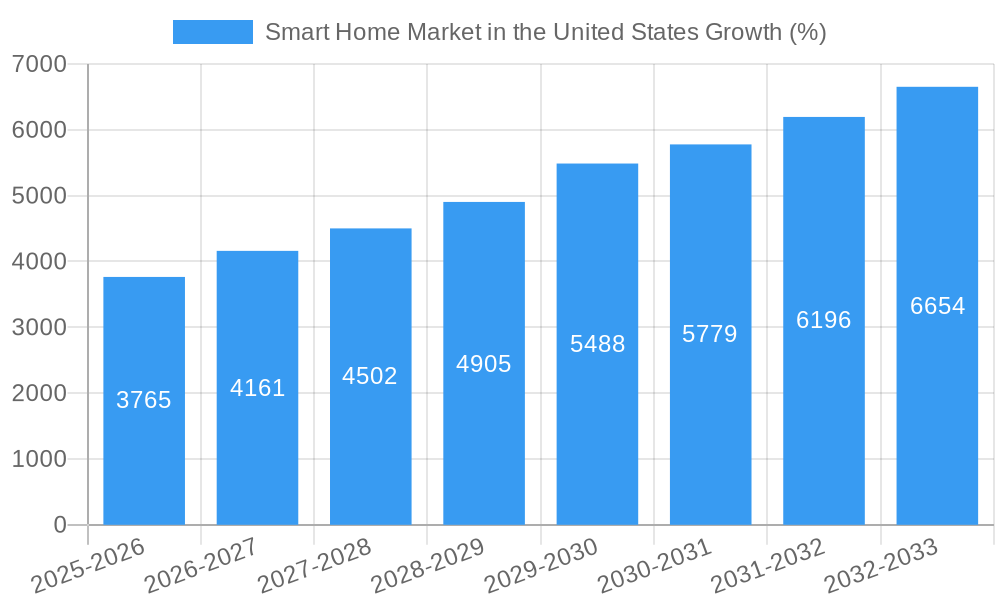
The U.S. smart home market is experiencing robust growth, driven by increasing consumer adoption of connected devices and a rising demand for enhanced home security, convenience, and energy efficiency. The market, valued at approximately $40.4 billion in 2025, is projected to maintain a Compound Annual Growth Rate (CAGR) of 9.12% from 2025 to 2033, indicating significant expansion opportunities. Key growth drivers include the increasing affordability of smart home devices, improved internet connectivity (particularly with the expansion of 5G), and the proliferation of voice-activated assistants like Alexa and Google Assistant. Furthermore, advancements in artificial intelligence (AI) and the Internet of Things (IoT) are fueling innovation, leading to more sophisticated and integrated smart home systems. Consumers are increasingly drawn to the convenience and personalization offered by features like automated lighting, remote appliance control, and integrated security systems. While data privacy concerns and the complexity of integrating various devices represent potential restraints, the market's overall trajectory remains positive, indicating a substantial increase in market value over the forecast period.
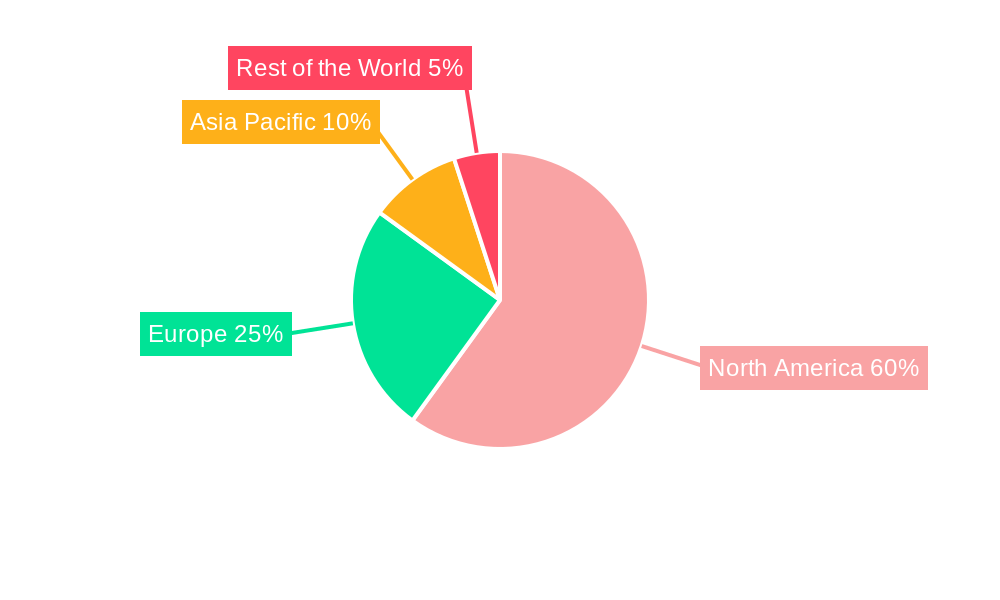
The segmentation of the U.S. smart home market reveals strong performance across various product types. Comfort and lighting solutions, including smart thermostats and lighting systems, continue to dominate the market due to their relatively low cost and immediate consumer benefits. However, the segments of control and connectivity, energy management, and home entertainment are also experiencing substantial growth, fueled by increasing consumer demand for seamless integration and advanced functionalities. The security segment benefits from heightened awareness regarding home safety and the increasing adoption of smart security cameras and alarm systems. The leading companies in this dynamic market, including industry giants like Google, Honeywell, and Whirlpool, are constantly innovating and expanding their product portfolios to cater to the evolving needs and preferences of U.S. consumers. Competition is intense, focusing on user experience, device integration, and the development of robust and secure platforms. The North American region, and specifically the United States, represents a significant market share due to high disposable income levels, technological advancement, and early adoption of smart home technologies.
Smart Home Market in the United States: A Comprehensive Report (2019-2033)
This in-depth report provides a comprehensive analysis of the burgeoning Smart Home Market in the United States, covering market size, key players, segment performance, and future growth projections. The study period spans from 2019 to 2033, with 2025 serving as the base and estimated year. This report is essential for industry stakeholders, investors, and anyone seeking to understand the dynamics of this rapidly evolving market. The report leverages extensive data analysis to provide actionable insights, empowering informed decision-making.
Smart Home Market in the United States Market Concentration & Dynamics
The U.S. smart home market exhibits a moderately concentrated landscape, with a few major players holding significant market share, while numerous smaller companies compete in niche segments. Market concentration is influenced by factors such as economies of scale, brand recognition, and technological leadership. Key players like Whirlpool Corporation, Honeywell International Inc, and Google Inc (Alphabet Inc) dominate specific segments, while others focus on specialized solutions.
Innovation Ecosystems: The U.S. smart home market thrives on a robust innovation ecosystem, fueled by ongoing R&D investments from both established players and startups. Collaborative partnerships, strategic alliances, and open-source initiatives accelerate technological advancements and integration.
Regulatory Frameworks: Government regulations concerning data privacy, security, and interoperability significantly influence market dynamics. Compliance requirements and evolving standards necessitate ongoing adaptation from market participants.
Substitute Products: Traditional home automation systems and standalone appliances pose some competitive pressure; however, the integrated nature and enhanced capabilities of smart home systems continue to drive market growth.
End-User Trends: Growing consumer adoption of smart home technology, driven by factors such as convenience, enhanced security, and energy efficiency, fuels market expansion. Demand for seamless integration, user-friendly interfaces, and personalized experiences are prominent trends.
M&A Activities: The past five years have witnessed a significant number of mergers and acquisitions (M&A) within the U.S. smart home industry. Approximately xx M&A deals occurred between 2019 and 2024, indicating consolidation and expansion strategies amongst industry players. Major players are actively acquiring smaller companies to expand their product portfolios and enhance their technological capabilities. Market share for the top 5 companies is estimated at 65% in 2025.
Smart Home Market in the United States Industry Insights & Trends
The U.S. smart home market is experiencing robust growth, with a Compound Annual Growth Rate (CAGR) of xx% projected from 2025 to 2033. The market size is estimated to reach $xx Million in 2025 and is projected to surpass $xx Million by 2033. This growth is driven by several key factors. Increasing consumer awareness regarding smart home technology's benefits (convenience, energy efficiency, security) contributes significantly to market expansion.
Technological advancements, particularly in areas such as AI, IoT, and cloud computing, propel innovation and create opportunities for new and improved products and services. The rising adoption of smart speakers, smart displays, and voice assistants plays a key role in enhancing the user experience and overall market penetration. Evolving consumer behaviors, emphasizing seamless connectivity, personalization, and integration of various smart home devices, further fuel market demand. The integration of smart home technologies with existing home infrastructure also facilitates adoption. Furthermore, the increasing affordability of smart home devices makes them more accessible to a broader consumer base.
Key Markets & Segments Leading Smart Home Market in the United States
The U.S. smart home market demonstrates strong growth across various segments, with significant regional variations. While data on specific regional dominance is limited, the national market demonstrates robust growth.
Dominant Segments:
- Comfort and Lighting: This segment dominates the market, driven by the high demand for smart lighting systems, smart thermostats, and other comfort-enhancing technologies.
- Security: Growing concerns about home security continue to drive demand for smart security systems, including security cameras, door locks, and alarm systems.
- Smart Appliances: The integration of smart features into appliances like refrigerators, washing machines, and ovens contributes to segment growth.
Drivers:
- Economic Growth: Rising disposable incomes empower consumers to invest in smart home technology.
- Infrastructure Development: Improved broadband infrastructure and greater internet accessibility facilitate the seamless operation of smart home devices.
Smart Home Market in the United States Product Developments
Recent years have witnessed significant advancements in smart home products, focusing on enhanced interoperability, improved user interfaces, and increased functionality. The introduction of the Matter standard promises to revolutionize interoperability among different smart home devices, fostering a more seamless and unified user experience. New product innovations continually enter the market, each offering unique features and enhancing the overall user experience. Competition drives ongoing refinements, resulting in cost-effective solutions and a wider choice for consumers.
Challenges in the Smart Home Market in the United States Market
The U.S. smart home market faces several challenges including data security and privacy concerns. These concerns impede wider adoption as consumers hesitate to integrate devices that collect large amounts of personal information. Supply chain disruptions and fluctuations in component costs also impact profitability and product availability. Intense competition amongst established and emerging players creates pricing pressures.
Forces Driving Smart Home Market in the United States Growth
Several key factors fuel the growth of the U.S. smart home market. Technological advancements, such as the development of AI-powered devices and the increasing adoption of IoT, enhance the capabilities and appeal of smart home solutions. Rising consumer disposable incomes enable greater investment in home improvement and smart technology. Government initiatives promoting energy efficiency and smart city development indirectly support market growth.
Long-Term Growth Catalysts in Smart Home Market in the United States
Long-term growth in the U.S. smart home market will be driven by ongoing innovation in areas such as AI, machine learning, and improved energy management. Strategic partnerships between technology companies and homebuilders will expand market reach. The increasing integration of smart home solutions into new construction projects further contributes to long-term growth.
Emerging Opportunities in Smart Home Market in the United States
Emerging opportunities include the integration of smart home technologies with health and wellness applications, such as monitoring elderly care. Growing adoption of voice assistants and AI-driven personalized experiences provides avenues for enhanced user interaction and customization. Expansion into the commercial sector presents significant potential for growth.
Leading Players in the Smart Home Market in the United States Sector
- Whirlpool Corporation
- Honeywell International Inc
- Smart Home Inc
- Legrand SA
- Google Inc (Alphabet Inc)
- LG Electronics Inc
- Savant Systems Inc (GE Lighting)
- Emerson Electric Co
- Cisco Systems Inc
- Lutron Electronics Co Inc
- Siemens AG
- Microsoft Corporation
- Schneider Electric SE
- Control4 Corporation
- ABB Limited
- GE Appliances (Haier Group)
Key Milestones in Smart Home Market in the United States Industry
- October 2022: Roku Inc. launched a new line of smart home products, expanding its ecosystem and offering affordable options.
- October 2022: Google Nest introduced a redesigned app, a wired doorbell, and Nest Wifi Pro, improving user experience and connectivity.
- November 2022: The Matter standard gained momentum with Amazon's commitment to scaling it out, enhancing interoperability across devices.
Strategic Outlook for Smart Home Market in the United States Market
The future of the U.S. smart home market is bright. Continued technological innovation, increasing consumer adoption, and strategic partnerships will drive substantial growth. Companies focusing on user experience, seamless integration, and robust security will gain a competitive edge. The market is poised for significant expansion in the coming years.
Smart Home Market in the United States Segmentation
-
1. Product Type
- 1.1. Comfort and Lighting
- 1.2. Control and Connectivity
- 1.3. Energy Management
- 1.4. Home Entertainment
- 1.5. Security
- 1.6. Smart Appliances
Smart Home Market in the United States Segmentation By Geography
-
1. North America
- 1.1. United States
- 1.2. Canada
- 1.3. Mexico
-
2. South America
- 2.1. Brazil
- 2.2. Argentina
- 2.3. Rest of South America
-
3. Europe
- 3.1. United Kingdom
- 3.2. Germany
- 3.3. France
- 3.4. Italy
- 3.5. Spain
- 3.6. Russia
- 3.7. Benelux
- 3.8. Nordics
- 3.9. Rest of Europe
-
4. Middle East & Africa
- 4.1. Turkey
- 4.2. Israel
- 4.3. GCC
- 4.4. North Africa
- 4.5. South Africa
- 4.6. Rest of Middle East & Africa
-
5. Asia Pacific
- 5.1. China
- 5.2. India
- 5.3. Japan
- 5.4. South Korea
- 5.5. ASEAN
- 5.6. Oceania
- 5.7. Rest of Asia Pacific
Smart Home Market in the United States REPORT HIGHLIGHTS
| Aspects | Details |
|---|---|
| Study Period | 2019-2033 |
| Base Year | 2024 |
| Estimated Year | 2025 |
| Forecast Period | 2025-2033 |
| Historical Period | 2019-2024 |
| Growth Rate | CAGR of 9.12% from 2019-2033 |
| Segmentation |
|
Table of Contents
- 1. Introduction
- 1.1. Research Scope
- 1.2. Market Segmentation
- 1.3. Research Methodology
- 1.4. Definitions and Assumptions
- 2. Executive Summary
- 2.1. Introduction
- 3. Market Dynamics
- 3.1. Introduction
- 3.2. Market Drivers
- 3.2.1. Increasing Demand for Energy-efficient Solutions; Growing Need for Automation of Security Systems
- 3.3. Market Restrains
- 3.3.1 High Installation and Replacement Costs
- 3.3.2 along with Privacy Concerns
- 3.4. Market Trends
- 3.4.1. Smart Appliances Accounted for the Highest Market Share
- 4. Market Factor Analysis
- 4.1. Porters Five Forces
- 4.2. Supply/Value Chain
- 4.3. PESTEL analysis
- 4.4. Market Entropy
- 4.5. Patent/Trademark Analysis
- 5. Global Smart Home Market in the United States Analysis, Insights and Forecast, 2019-2031
- 5.1. Market Analysis, Insights and Forecast - by Product Type
- 5.1.1. Comfort and Lighting
- 5.1.2. Control and Connectivity
- 5.1.3. Energy Management
- 5.1.4. Home Entertainment
- 5.1.5. Security
- 5.1.6. Smart Appliances
- 5.2. Market Analysis, Insights and Forecast - by Region
- 5.2.1. North America
- 5.2.2. South America
- 5.2.3. Europe
- 5.2.4. Middle East & Africa
- 5.2.5. Asia Pacific
- 5.1. Market Analysis, Insights and Forecast - by Product Type
- 6. North America Smart Home Market in the United States Analysis, Insights and Forecast, 2019-2031
- 6.1. Market Analysis, Insights and Forecast - by Product Type
- 6.1.1. Comfort and Lighting
- 6.1.2. Control and Connectivity
- 6.1.3. Energy Management
- 6.1.4. Home Entertainment
- 6.1.5. Security
- 6.1.6. Smart Appliances
- 6.1. Market Analysis, Insights and Forecast - by Product Type
- 7. South America Smart Home Market in the United States Analysis, Insights and Forecast, 2019-2031
- 7.1. Market Analysis, Insights and Forecast - by Product Type
- 7.1.1. Comfort and Lighting
- 7.1.2. Control and Connectivity
- 7.1.3. Energy Management
- 7.1.4. Home Entertainment
- 7.1.5. Security
- 7.1.6. Smart Appliances
- 7.1. Market Analysis, Insights and Forecast - by Product Type
- 8. Europe Smart Home Market in the United States Analysis, Insights and Forecast, 2019-2031
- 8.1. Market Analysis, Insights and Forecast - by Product Type
- 8.1.1. Comfort and Lighting
- 8.1.2. Control and Connectivity
- 8.1.3. Energy Management
- 8.1.4. Home Entertainment
- 8.1.5. Security
- 8.1.6. Smart Appliances
- 8.1. Market Analysis, Insights and Forecast - by Product Type
- 9. Middle East & Africa Smart Home Market in the United States Analysis, Insights and Forecast, 2019-2031
- 9.1. Market Analysis, Insights and Forecast - by Product Type
- 9.1.1. Comfort and Lighting
- 9.1.2. Control and Connectivity
- 9.1.3. Energy Management
- 9.1.4. Home Entertainment
- 9.1.5. Security
- 9.1.6. Smart Appliances
- 9.1. Market Analysis, Insights and Forecast - by Product Type
- 10. Asia Pacific Smart Home Market in the United States Analysis, Insights and Forecast, 2019-2031
- 10.1. Market Analysis, Insights and Forecast - by Product Type
- 10.1.1. Comfort and Lighting
- 10.1.2. Control and Connectivity
- 10.1.3. Energy Management
- 10.1.4. Home Entertainment
- 10.1.5. Security
- 10.1.6. Smart Appliances
- 10.1. Market Analysis, Insights and Forecast - by Product Type
- 11. North America Smart Home Market in the United States Analysis, Insights and Forecast, 2019-2031
- 11.1. Market Analysis, Insights and Forecast - By Country/Sub-region
- 11.1.1. undefined
- 12. Europe Smart Home Market in the United States Analysis, Insights and Forecast, 2019-2031
- 12.1. Market Analysis, Insights and Forecast - By Country/Sub-region
- 12.1.1. undefined
- 13. Asia Pacific Smart Home Market in the United States Analysis, Insights and Forecast, 2019-2031
- 13.1. Market Analysis, Insights and Forecast - By Country/Sub-region
- 13.1.1. undefined
- 14. Rest of the World Smart Home Market in the United States Analysis, Insights and Forecast, 2019-2031
- 14.1. Market Analysis, Insights and Forecast - By Country/Sub-region
- 14.1.1. undefined
- 15. United States Smart Home Market in the United States Analysis, Insights and Forecast, 2019-2031
- 15.1. Market Analysis, Insights and Forecast - By Country/Sub-region
- 15.1.1. undefined
- 16. Competitive Analysis
- 16.1. Global Market Share Analysis 2024
- 16.2. Company Profiles
- 16.2.1 Whirlpool Corporation
- 16.2.1.1. Overview
- 16.2.1.2. Products
- 16.2.1.3. SWOT Analysis
- 16.2.1.4. Recent Developments
- 16.2.1.5. Financials (Based on Availability)
- 16.2.2 Honeywell International Inc
- 16.2.2.1. Overview
- 16.2.2.2. Products
- 16.2.2.3. SWOT Analysis
- 16.2.2.4. Recent Developments
- 16.2.2.5. Financials (Based on Availability)
- 16.2.3 Smart Home Inc
- 16.2.3.1. Overview
- 16.2.3.2. Products
- 16.2.3.3. SWOT Analysis
- 16.2.3.4. Recent Developments
- 16.2.3.5. Financials (Based on Availability)
- 16.2.4 Legrand SA
- 16.2.4.1. Overview
- 16.2.4.2. Products
- 16.2.4.3. SWOT Analysis
- 16.2.4.4. Recent Developments
- 16.2.4.5. Financials (Based on Availability)
- 16.2.5 Google Inc (Alphabet Inc )
- 16.2.5.1. Overview
- 16.2.5.2. Products
- 16.2.5.3. SWOT Analysis
- 16.2.5.4. Recent Developments
- 16.2.5.5. Financials (Based on Availability)
- 16.2.6 LG Electronics Inc
- 16.2.6.1. Overview
- 16.2.6.2. Products
- 16.2.6.3. SWOT Analysis
- 16.2.6.4. Recent Developments
- 16.2.6.5. Financials (Based on Availability)
- 16.2.7 Savant Systems Inc (GE Lighting)
- 16.2.7.1. Overview
- 16.2.7.2. Products
- 16.2.7.3. SWOT Analysis
- 16.2.7.4. Recent Developments
- 16.2.7.5. Financials (Based on Availability)
- 16.2.8 Emerson Electric Co
- 16.2.8.1. Overview
- 16.2.8.2. Products
- 16.2.8.3. SWOT Analysis
- 16.2.8.4. Recent Developments
- 16.2.8.5. Financials (Based on Availability)
- 16.2.9 Cisco Systems Inc
- 16.2.9.1. Overview
- 16.2.9.2. Products
- 16.2.9.3. SWOT Analysis
- 16.2.9.4. Recent Developments
- 16.2.9.5. Financials (Based on Availability)
- 16.2.10 Lutron Electronics Co Inc
- 16.2.10.1. Overview
- 16.2.10.2. Products
- 16.2.10.3. SWOT Analysis
- 16.2.10.4. Recent Developments
- 16.2.10.5. Financials (Based on Availability)
- 16.2.11 Siemens AG
- 16.2.11.1. Overview
- 16.2.11.2. Products
- 16.2.11.3. SWOT Analysis
- 16.2.11.4. Recent Developments
- 16.2.11.5. Financials (Based on Availability)
- 16.2.12 Microsoft Corporation
- 16.2.12.1. Overview
- 16.2.12.2. Products
- 16.2.12.3. SWOT Analysis
- 16.2.12.4. Recent Developments
- 16.2.12.5. Financials (Based on Availability)
- 16.2.13 Schneider Electric SE
- 16.2.13.1. Overview
- 16.2.13.2. Products
- 16.2.13.3. SWOT Analysis
- 16.2.13.4. Recent Developments
- 16.2.13.5. Financials (Based on Availability)
- 16.2.14 Control4 Corporation
- 16.2.14.1. Overview
- 16.2.14.2. Products
- 16.2.14.3. SWOT Analysis
- 16.2.14.4. Recent Developments
- 16.2.14.5. Financials (Based on Availability)
- 16.2.15 ABB Limited
- 16.2.15.1. Overview
- 16.2.15.2. Products
- 16.2.15.3. SWOT Analysis
- 16.2.15.4. Recent Developments
- 16.2.15.5. Financials (Based on Availability)
- 16.2.16 GE Appliances (Haier Group)
- 16.2.16.1. Overview
- 16.2.16.2. Products
- 16.2.16.3. SWOT Analysis
- 16.2.16.4. Recent Developments
- 16.2.16.5. Financials (Based on Availability)
- 16.2.1 Whirlpool Corporation
List of Figures
- Figure 1: Global Smart Home Market in the United States Revenue Breakdown (Million, %) by Region 2024 & 2032
- Figure 2: Global Smart Home Market in the United States Volume Breakdown (K Unit, %) by Region 2024 & 2032
- Figure 3: North America Smart Home Market in the United States Revenue (Million), by Country 2024 & 2032
- Figure 4: North America Smart Home Market in the United States Volume (K Unit), by Country 2024 & 2032
- Figure 5: North America Smart Home Market in the United States Revenue Share (%), by Country 2024 & 2032
- Figure 6: North America Smart Home Market in the United States Volume Share (%), by Country 2024 & 2032
- Figure 7: Europe Smart Home Market in the United States Revenue (Million), by Country 2024 & 2032
- Figure 8: Europe Smart Home Market in the United States Volume (K Unit), by Country 2024 & 2032
- Figure 9: Europe Smart Home Market in the United States Revenue Share (%), by Country 2024 & 2032
- Figure 10: Europe Smart Home Market in the United States Volume Share (%), by Country 2024 & 2032
- Figure 11: Asia Pacific Smart Home Market in the United States Revenue (Million), by Country 2024 & 2032
- Figure 12: Asia Pacific Smart Home Market in the United States Volume (K Unit), by Country 2024 & 2032
- Figure 13: Asia Pacific Smart Home Market in the United States Revenue Share (%), by Country 2024 & 2032
- Figure 14: Asia Pacific Smart Home Market in the United States Volume Share (%), by Country 2024 & 2032
- Figure 15: Rest of the World Smart Home Market in the United States Revenue (Million), by Country 2024 & 2032
- Figure 16: Rest of the World Smart Home Market in the United States Volume (K Unit), by Country 2024 & 2032
- Figure 17: Rest of the World Smart Home Market in the United States Revenue Share (%), by Country 2024 & 2032
- Figure 18: Rest of the World Smart Home Market in the United States Volume Share (%), by Country 2024 & 2032
- Figure 19: United States Smart Home Market in the United States Revenue (Million), by Country 2024 & 2032
- Figure 20: United States Smart Home Market in the United States Volume (K Unit), by Country 2024 & 2032
- Figure 21: United States Smart Home Market in the United States Revenue Share (%), by Country 2024 & 2032
- Figure 22: United States Smart Home Market in the United States Volume Share (%), by Country 2024 & 2032
- Figure 23: North America Smart Home Market in the United States Revenue (Million), by Product Type 2024 & 2032
- Figure 24: North America Smart Home Market in the United States Volume (K Unit), by Product Type 2024 & 2032
- Figure 25: North America Smart Home Market in the United States Revenue Share (%), by Product Type 2024 & 2032
- Figure 26: North America Smart Home Market in the United States Volume Share (%), by Product Type 2024 & 2032
- Figure 27: North America Smart Home Market in the United States Revenue (Million), by Country 2024 & 2032
- Figure 28: North America Smart Home Market in the United States Volume (K Unit), by Country 2024 & 2032
- Figure 29: North America Smart Home Market in the United States Revenue Share (%), by Country 2024 & 2032
- Figure 30: North America Smart Home Market in the United States Volume Share (%), by Country 2024 & 2032
- Figure 31: South America Smart Home Market in the United States Revenue (Million), by Product Type 2024 & 2032
- Figure 32: South America Smart Home Market in the United States Volume (K Unit), by Product Type 2024 & 2032
- Figure 33: South America Smart Home Market in the United States Revenue Share (%), by Product Type 2024 & 2032
- Figure 34: South America Smart Home Market in the United States Volume Share (%), by Product Type 2024 & 2032
- Figure 35: South America Smart Home Market in the United States Revenue (Million), by Country 2024 & 2032
- Figure 36: South America Smart Home Market in the United States Volume (K Unit), by Country 2024 & 2032
- Figure 37: South America Smart Home Market in the United States Revenue Share (%), by Country 2024 & 2032
- Figure 38: South America Smart Home Market in the United States Volume Share (%), by Country 2024 & 2032
- Figure 39: Europe Smart Home Market in the United States Revenue (Million), by Product Type 2024 & 2032
- Figure 40: Europe Smart Home Market in the United States Volume (K Unit), by Product Type 2024 & 2032
- Figure 41: Europe Smart Home Market in the United States Revenue Share (%), by Product Type 2024 & 2032
- Figure 42: Europe Smart Home Market in the United States Volume Share (%), by Product Type 2024 & 2032
- Figure 43: Europe Smart Home Market in the United States Revenue (Million), by Country 2024 & 2032
- Figure 44: Europe Smart Home Market in the United States Volume (K Unit), by Country 2024 & 2032
- Figure 45: Europe Smart Home Market in the United States Revenue Share (%), by Country 2024 & 2032
- Figure 46: Europe Smart Home Market in the United States Volume Share (%), by Country 2024 & 2032
- Figure 47: Middle East & Africa Smart Home Market in the United States Revenue (Million), by Product Type 2024 & 2032
- Figure 48: Middle East & Africa Smart Home Market in the United States Volume (K Unit), by Product Type 2024 & 2032
- Figure 49: Middle East & Africa Smart Home Market in the United States Revenue Share (%), by Product Type 2024 & 2032
- Figure 50: Middle East & Africa Smart Home Market in the United States Volume Share (%), by Product Type 2024 & 2032
- Figure 51: Middle East & Africa Smart Home Market in the United States Revenue (Million), by Country 2024 & 2032
- Figure 52: Middle East & Africa Smart Home Market in the United States Volume (K Unit), by Country 2024 & 2032
- Figure 53: Middle East & Africa Smart Home Market in the United States Revenue Share (%), by Country 2024 & 2032
- Figure 54: Middle East & Africa Smart Home Market in the United States Volume Share (%), by Country 2024 & 2032
- Figure 55: Asia Pacific Smart Home Market in the United States Revenue (Million), by Product Type 2024 & 2032
- Figure 56: Asia Pacific Smart Home Market in the United States Volume (K Unit), by Product Type 2024 & 2032
- Figure 57: Asia Pacific Smart Home Market in the United States Revenue Share (%), by Product Type 2024 & 2032
- Figure 58: Asia Pacific Smart Home Market in the United States Volume Share (%), by Product Type 2024 & 2032
- Figure 59: Asia Pacific Smart Home Market in the United States Revenue (Million), by Country 2024 & 2032
- Figure 60: Asia Pacific Smart Home Market in the United States Volume (K Unit), by Country 2024 & 2032
- Figure 61: Asia Pacific Smart Home Market in the United States Revenue Share (%), by Country 2024 & 2032
- Figure 62: Asia Pacific Smart Home Market in the United States Volume Share (%), by Country 2024 & 2032
List of Tables
- Table 1: Global Smart Home Market in the United States Revenue Million Forecast, by Region 2019 & 2032
- Table 2: Global Smart Home Market in the United States Volume K Unit Forecast, by Region 2019 & 2032
- Table 3: Global Smart Home Market in the United States Revenue Million Forecast, by Product Type 2019 & 2032
- Table 4: Global Smart Home Market in the United States Volume K Unit Forecast, by Product Type 2019 & 2032
- Table 5: Global Smart Home Market in the United States Revenue Million Forecast, by Region 2019 & 2032
- Table 6: Global Smart Home Market in the United States Volume K Unit Forecast, by Region 2019 & 2032
- Table 7: Global Smart Home Market in the United States Revenue Million Forecast, by Country 2019 & 2032
- Table 8: Global Smart Home Market in the United States Volume K Unit Forecast, by Country 2019 & 2032
- Table 9: Global Smart Home Market in the United States Revenue Million Forecast, by Country 2019 & 2032
- Table 10: Global Smart Home Market in the United States Volume K Unit Forecast, by Country 2019 & 2032
- Table 11: Global Smart Home Market in the United States Revenue Million Forecast, by Country 2019 & 2032
- Table 12: Global Smart Home Market in the United States Volume K Unit Forecast, by Country 2019 & 2032
- Table 13: Global Smart Home Market in the United States Revenue Million Forecast, by Country 2019 & 2032
- Table 14: Global Smart Home Market in the United States Volume K Unit Forecast, by Country 2019 & 2032
- Table 15: Global Smart Home Market in the United States Revenue Million Forecast, by Country 2019 & 2032
- Table 16: Global Smart Home Market in the United States Volume K Unit Forecast, by Country 2019 & 2032
- Table 17: Global Smart Home Market in the United States Revenue Million Forecast, by Product Type 2019 & 2032
- Table 18: Global Smart Home Market in the United States Volume K Unit Forecast, by Product Type 2019 & 2032
- Table 19: Global Smart Home Market in the United States Revenue Million Forecast, by Country 2019 & 2032
- Table 20: Global Smart Home Market in the United States Volume K Unit Forecast, by Country 2019 & 2032
- Table 21: United States Smart Home Market in the United States Revenue (Million) Forecast, by Application 2019 & 2032
- Table 22: United States Smart Home Market in the United States Volume (K Unit) Forecast, by Application 2019 & 2032
- Table 23: Canada Smart Home Market in the United States Revenue (Million) Forecast, by Application 2019 & 2032
- Table 24: Canada Smart Home Market in the United States Volume (K Unit) Forecast, by Application 2019 & 2032
- Table 25: Mexico Smart Home Market in the United States Revenue (Million) Forecast, by Application 2019 & 2032
- Table 26: Mexico Smart Home Market in the United States Volume (K Unit) Forecast, by Application 2019 & 2032
- Table 27: Global Smart Home Market in the United States Revenue Million Forecast, by Product Type 2019 & 2032
- Table 28: Global Smart Home Market in the United States Volume K Unit Forecast, by Product Type 2019 & 2032
- Table 29: Global Smart Home Market in the United States Revenue Million Forecast, by Country 2019 & 2032
- Table 30: Global Smart Home Market in the United States Volume K Unit Forecast, by Country 2019 & 2032
- Table 31: Brazil Smart Home Market in the United States Revenue (Million) Forecast, by Application 2019 & 2032
- Table 32: Brazil Smart Home Market in the United States Volume (K Unit) Forecast, by Application 2019 & 2032
- Table 33: Argentina Smart Home Market in the United States Revenue (Million) Forecast, by Application 2019 & 2032
- Table 34: Argentina Smart Home Market in the United States Volume (K Unit) Forecast, by Application 2019 & 2032
- Table 35: Rest of South America Smart Home Market in the United States Revenue (Million) Forecast, by Application 2019 & 2032
- Table 36: Rest of South America Smart Home Market in the United States Volume (K Unit) Forecast, by Application 2019 & 2032
- Table 37: Global Smart Home Market in the United States Revenue Million Forecast, by Product Type 2019 & 2032
- Table 38: Global Smart Home Market in the United States Volume K Unit Forecast, by Product Type 2019 & 2032
- Table 39: Global Smart Home Market in the United States Revenue Million Forecast, by Country 2019 & 2032
- Table 40: Global Smart Home Market in the United States Volume K Unit Forecast, by Country 2019 & 2032
- Table 41: United Kingdom Smart Home Market in the United States Revenue (Million) Forecast, by Application 2019 & 2032
- Table 42: United Kingdom Smart Home Market in the United States Volume (K Unit) Forecast, by Application 2019 & 2032
- Table 43: Germany Smart Home Market in the United States Revenue (Million) Forecast, by Application 2019 & 2032
- Table 44: Germany Smart Home Market in the United States Volume (K Unit) Forecast, by Application 2019 & 2032
- Table 45: France Smart Home Market in the United States Revenue (Million) Forecast, by Application 2019 & 2032
- Table 46: France Smart Home Market in the United States Volume (K Unit) Forecast, by Application 2019 & 2032
- Table 47: Italy Smart Home Market in the United States Revenue (Million) Forecast, by Application 2019 & 2032
- Table 48: Italy Smart Home Market in the United States Volume (K Unit) Forecast, by Application 2019 & 2032
- Table 49: Spain Smart Home Market in the United States Revenue (Million) Forecast, by Application 2019 & 2032
- Table 50: Spain Smart Home Market in the United States Volume (K Unit) Forecast, by Application 2019 & 2032
- Table 51: Russia Smart Home Market in the United States Revenue (Million) Forecast, by Application 2019 & 2032
- Table 52: Russia Smart Home Market in the United States Volume (K Unit) Forecast, by Application 2019 & 2032
- Table 53: Benelux Smart Home Market in the United States Revenue (Million) Forecast, by Application 2019 & 2032
- Table 54: Benelux Smart Home Market in the United States Volume (K Unit) Forecast, by Application 2019 & 2032
- Table 55: Nordics Smart Home Market in the United States Revenue (Million) Forecast, by Application 2019 & 2032
- Table 56: Nordics Smart Home Market in the United States Volume (K Unit) Forecast, by Application 2019 & 2032
- Table 57: Rest of Europe Smart Home Market in the United States Revenue (Million) Forecast, by Application 2019 & 2032
- Table 58: Rest of Europe Smart Home Market in the United States Volume (K Unit) Forecast, by Application 2019 & 2032
- Table 59: Global Smart Home Market in the United States Revenue Million Forecast, by Product Type 2019 & 2032
- Table 60: Global Smart Home Market in the United States Volume K Unit Forecast, by Product Type 2019 & 2032
- Table 61: Global Smart Home Market in the United States Revenue Million Forecast, by Country 2019 & 2032
- Table 62: Global Smart Home Market in the United States Volume K Unit Forecast, by Country 2019 & 2032
- Table 63: Turkey Smart Home Market in the United States Revenue (Million) Forecast, by Application 2019 & 2032
- Table 64: Turkey Smart Home Market in the United States Volume (K Unit) Forecast, by Application 2019 & 2032
- Table 65: Israel Smart Home Market in the United States Revenue (Million) Forecast, by Application 2019 & 2032
- Table 66: Israel Smart Home Market in the United States Volume (K Unit) Forecast, by Application 2019 & 2032
- Table 67: GCC Smart Home Market in the United States Revenue (Million) Forecast, by Application 2019 & 2032
- Table 68: GCC Smart Home Market in the United States Volume (K Unit) Forecast, by Application 2019 & 2032
- Table 69: North Africa Smart Home Market in the United States Revenue (Million) Forecast, by Application 2019 & 2032
- Table 70: North Africa Smart Home Market in the United States Volume (K Unit) Forecast, by Application 2019 & 2032
- Table 71: South Africa Smart Home Market in the United States Revenue (Million) Forecast, by Application 2019 & 2032
- Table 72: South Africa Smart Home Market in the United States Volume (K Unit) Forecast, by Application 2019 & 2032
- Table 73: Rest of Middle East & Africa Smart Home Market in the United States Revenue (Million) Forecast, by Application 2019 & 2032
- Table 74: Rest of Middle East & Africa Smart Home Market in the United States Volume (K Unit) Forecast, by Application 2019 & 2032
- Table 75: Global Smart Home Market in the United States Revenue Million Forecast, by Product Type 2019 & 2032
- Table 76: Global Smart Home Market in the United States Volume K Unit Forecast, by Product Type 2019 & 2032
- Table 77: Global Smart Home Market in the United States Revenue Million Forecast, by Country 2019 & 2032
- Table 78: Global Smart Home Market in the United States Volume K Unit Forecast, by Country 2019 & 2032
- Table 79: China Smart Home Market in the United States Revenue (Million) Forecast, by Application 2019 & 2032
- Table 80: China Smart Home Market in the United States Volume (K Unit) Forecast, by Application 2019 & 2032
- Table 81: India Smart Home Market in the United States Revenue (Million) Forecast, by Application 2019 & 2032
- Table 82: India Smart Home Market in the United States Volume (K Unit) Forecast, by Application 2019 & 2032
- Table 83: Japan Smart Home Market in the United States Revenue (Million) Forecast, by Application 2019 & 2032
- Table 84: Japan Smart Home Market in the United States Volume (K Unit) Forecast, by Application 2019 & 2032
- Table 85: South Korea Smart Home Market in the United States Revenue (Million) Forecast, by Application 2019 & 2032
- Table 86: South Korea Smart Home Market in the United States Volume (K Unit) Forecast, by Application 2019 & 2032
- Table 87: ASEAN Smart Home Market in the United States Revenue (Million) Forecast, by Application 2019 & 2032
- Table 88: ASEAN Smart Home Market in the United States Volume (K Unit) Forecast, by Application 2019 & 2032
- Table 89: Oceania Smart Home Market in the United States Revenue (Million) Forecast, by Application 2019 & 2032
- Table 90: Oceania Smart Home Market in the United States Volume (K Unit) Forecast, by Application 2019 & 2032
- Table 91: Rest of Asia Pacific Smart Home Market in the United States Revenue (Million) Forecast, by Application 2019 & 2032
- Table 92: Rest of Asia Pacific Smart Home Market in the United States Volume (K Unit) Forecast, by Application 2019 & 2032
Frequently Asked Questions
1. What is the projected Compound Annual Growth Rate (CAGR) of the Smart Home Market in the United States?
The projected CAGR is approximately 9.12%.
2. Which companies are prominent players in the Smart Home Market in the United States?
Key companies in the market include Whirlpool Corporation, Honeywell International Inc, Smart Home Inc, Legrand SA, Google Inc (Alphabet Inc ), LG Electronics Inc, Savant Systems Inc (GE Lighting), Emerson Electric Co, Cisco Systems Inc, Lutron Electronics Co Inc, Siemens AG, Microsoft Corporation, Schneider Electric SE, Control4 Corporation, ABB Limited, GE Appliances (Haier Group).
3. What are the main segments of the Smart Home Market in the United States?
The market segments include Product Type.
4. Can you provide details about the market size?
The market size is estimated to be USD 40.40 Million as of 2022.
5. What are some drivers contributing to market growth?
Increasing Demand for Energy-efficient Solutions; Growing Need for Automation of Security Systems.
6. What are the notable trends driving market growth?
Smart Appliances Accounted for the Highest Market Share.
7. Are there any restraints impacting market growth?
High Installation and Replacement Costs. along with Privacy Concerns.
8. Can you provide examples of recent developments in the market?
November 2022: Various products and smart home systems can collaborate according to the Matter standard, which Amazon had stated plans to scale out. New WWA certification standards for Matter devices were introduced by Amazon this year. As they increase the dependability and functionality of linked devices, they will also enable innovation and choice.
9. What pricing options are available for accessing the report?
Pricing options include single-user, multi-user, and enterprise licenses priced at USD 3800, USD 4500, and USD 5800 respectively.
10. Is the market size provided in terms of value or volume?
The market size is provided in terms of value, measured in Million and volume, measured in K Unit.
11. Are there any specific market keywords associated with the report?
Yes, the market keyword associated with the report is "Smart Home Market in the United States," which aids in identifying and referencing the specific market segment covered.
12. How do I determine which pricing option suits my needs best?
The pricing options vary based on user requirements and access needs. Individual users may opt for single-user licenses, while businesses requiring broader access may choose multi-user or enterprise licenses for cost-effective access to the report.
13. Are there any additional resources or data provided in the Smart Home Market in the United States report?
While the report offers comprehensive insights, it's advisable to review the specific contents or supplementary materials provided to ascertain if additional resources or data are available.
14. How can I stay updated on further developments or reports in the Smart Home Market in the United States?
To stay informed about further developments, trends, and reports in the Smart Home Market in the United States, consider subscribing to industry newsletters, following relevant companies and organizations, or regularly checking reputable industry news sources and publications.
Methodology
Step 1 - Identification of Relevant Samples Size from Population Database


Step 2 - Approaches for Defining Global Market Size (Value, Volume* & Price*)

Note*: In applicable scenarios
Step 3 - Data Sources
Primary Research
- Web Analytics
- Survey Reports
- Research Institute
- Latest Research Reports
- Opinion Leaders
Secondary Research
- Annual Reports
- White Paper
- Latest Press Release
- Industry Association
- Paid Database
- Investor Presentations

Step 4 - Data Triangulation
Involves using different sources of information in order to increase the validity of a study
These sources are likely to be stakeholders in a program - participants, other researchers, program staff, other community members, and so on.
Then we put all data in single framework & apply various statistical tools to find out the dynamic on the market.
During the analysis stage, feedback from the stakeholder groups would be compared to determine areas of agreement as well as areas of divergence
