

Key Insights
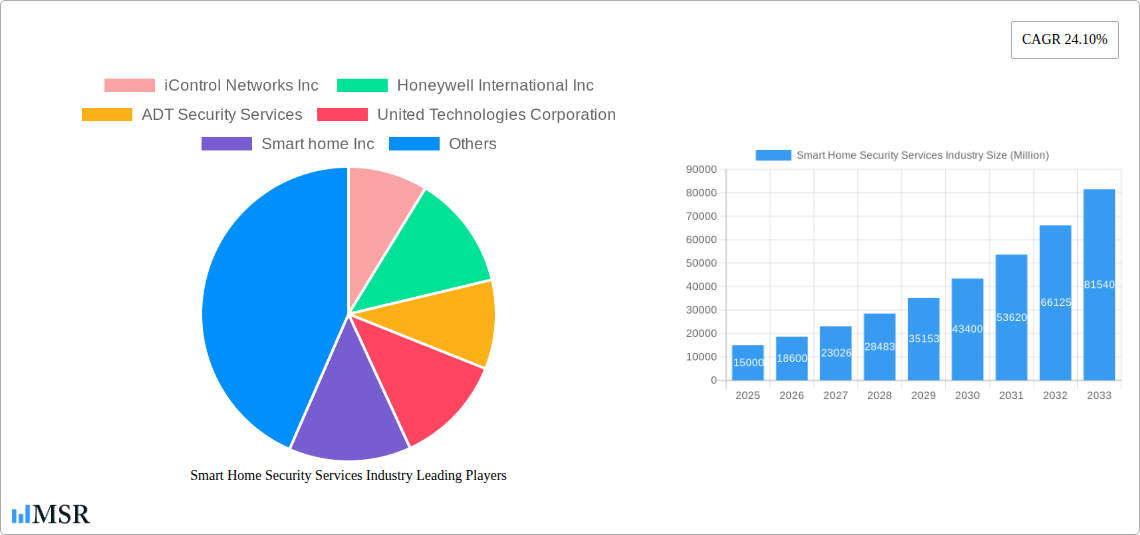
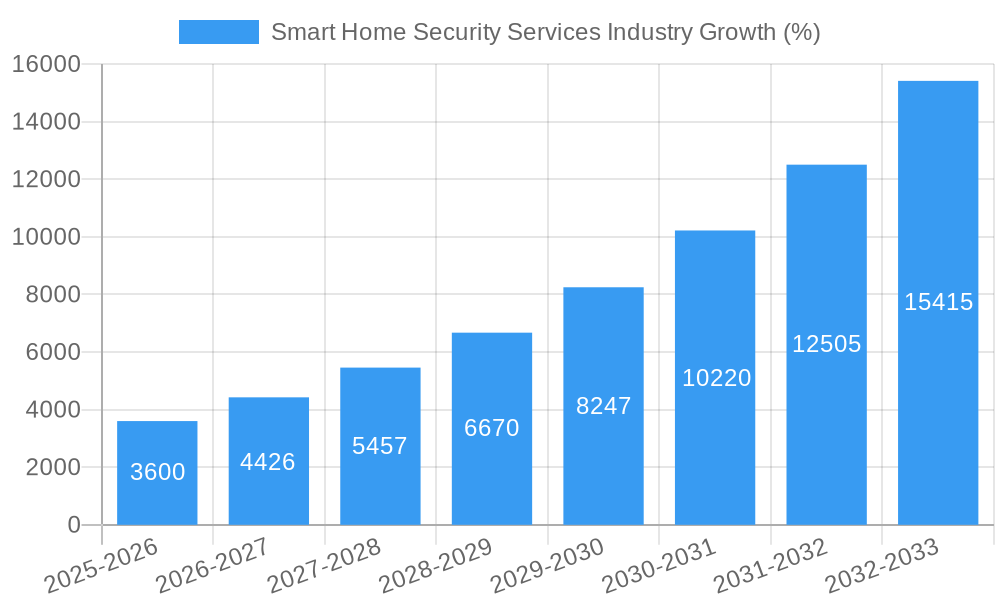
The smart home security services market is experiencing robust growth, projected to reach a substantial size driven by increasing demand for enhanced home security, technological advancements, and rising disposable incomes globally. The 24.10% CAGR from 2019 to 2024 suggests a rapidly expanding market, indicating a significant increase in both adoption and spending on smart home security solutions. Key drivers include the proliferation of connected devices, the integration of AI and machine learning for improved threat detection and response, and the rising popularity of convenient, subscription-based security services. Furthermore, the market's segmentation into professional and self-installation options caters to diverse consumer preferences and technical capabilities, fueling market expansion. The inclusion of various product types such as video surveillance and access control further contributes to the market's versatility and appeal. Major players, including iControl Networks, Honeywell, ADT, and others, are actively investing in innovation and expanding their service offerings to maintain a competitive edge in this dynamic landscape. Geographic expansion into emerging markets with growing internet penetration also contributes to the overall growth trajectory.
The market's continued growth is anticipated throughout the forecast period (2025-2033), though the CAGR might moderate slightly as the market matures. However, emerging trends such as the integration of smart home security systems with other smart home devices, the increased adoption of professional monitoring services, and the development of more sophisticated cybersecurity features are expected to sustain growth. Restraints to consider include the cost of initial setup and ongoing subscription fees, potential privacy concerns surrounding data collection, and the need for reliable internet connectivity for optimal functionality. Nevertheless, the overall market outlook remains positive, indicating substantial investment opportunities and continued innovation within the smart home security sector. The continued expansion of smart home technology across various demographics and geographic locations will be a crucial factor shaping the future of this sector.
Smart Home Security Services Industry Report: A Comprehensive Market Analysis (2019-2033)
This comprehensive report provides an in-depth analysis of the Smart Home Security Services industry, offering actionable insights for stakeholders across the value chain. With a study period spanning 2019-2033, a base year of 2025, and a forecast period of 2025-2033, this report leverages historical data (2019-2024) to predict future market trends and opportunities. The global market is projected to reach xx Million by 2033, exhibiting a compelling CAGR of xx%. This report examines key segments, including Video Surveillance, Access Control, Professional Installation, and Self-Installation, providing granular insights into market dynamics and growth drivers.
Smart Home Security Services Industry Market Concentration & Dynamics
The Smart Home Security Services market exhibits a moderately concentrated landscape, with key players like ADT Security Services, Honeywell International Inc, and Comcast Corporation holding significant market share. However, the emergence of smaller, innovative companies is increasing competition. The market is characterized by a dynamic innovation ecosystem, with continuous advancements in AI-powered surveillance, cloud-based security platforms, and integrated smart home solutions. Regulatory frameworks, varying across geographies, influence the adoption and deployment of smart home security systems. Substitute products, such as traditional security systems, pose a challenge, although the increasing preference for convenience and remote monitoring fuels the growth of smart home security. End-user trends showcase a preference for integrated solutions, user-friendly interfaces, and enhanced data privacy features. M&A activities have been significant, with xx major deals recorded in the past five years, reflecting consolidation and expansion strategies within the industry. The market share distribution is as follows (estimated 2025): ADT Security Services (xx%), Honeywell International Inc (xx%), Comcast Corporation (xx%), Others (xx%).
Smart Home Security Services Industry Industry Insights & Trends
The global smart home security services market is experiencing robust growth, driven by escalating consumer demand for enhanced home security, the increasing affordability of smart home devices, and the rising adoption of IoT technologies. Technological advancements, such as AI-powered video analytics, advanced threat detection, and seamless integration with other smart home systems, are revolutionizing the industry. The market is witnessing a shift towards cloud-based solutions, offering improved scalability, remote accessibility, and cost-effectiveness. Consumer behavior is evolving with a heightened emphasis on user-friendly interfaces, remote monitoring capabilities, and proactive security alerts. The market size in 2025 is estimated at $xx Million, expected to reach $xx Million by 2033.
Key Markets & Segments Leading Smart Home Security Services Industry
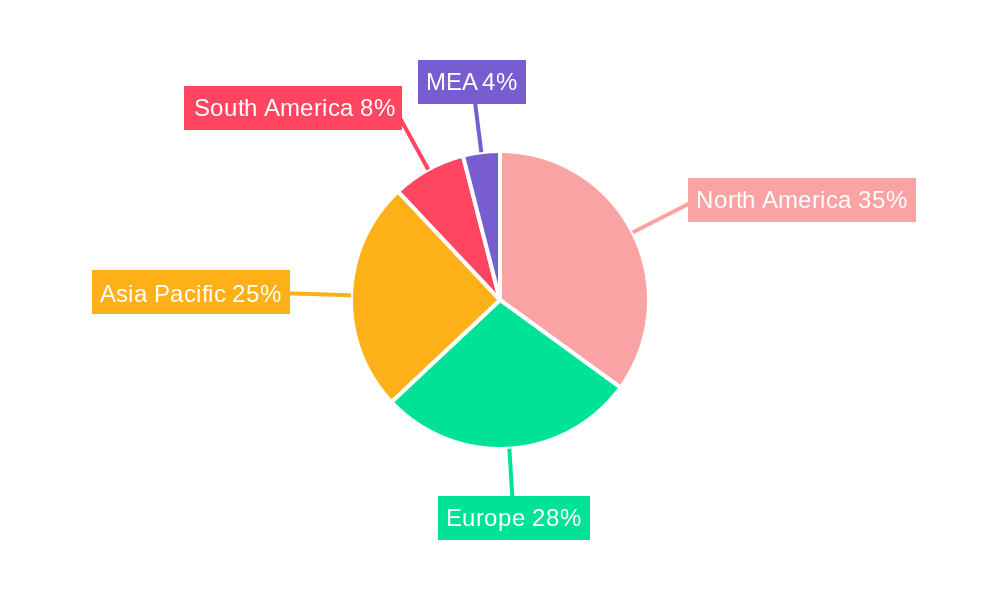
North America currently holds the dominant position in the smart home security services market, driven by high levels of disposable income, technological advancements, and early adoption of smart home technology. Within this region, the United States is the largest market. The key segments driving growth include:
- Video Surveillance: Growing demand for high-resolution cameras, advanced analytics, and remote monitoring capabilities fuels this segment's growth.
- Access Control: Smart locks, keypads, and biometric access systems are gaining traction, driven by enhanced convenience and security.
- Professional Installation: While self-installation offers cost savings, the complexity of integrating various systems drives demand for professional services.
Drivers for Market Dominance:
- High disposable incomes and technological proficiency in North America.
- Robust infrastructure supporting smart home technology adoption.
- Strong government support for cybersecurity and smart city initiatives.
Smart Home Security Services Industry Product Developments
Recent product innovations include AI-powered video analytics that provide intelligent alerts and threat detection, advanced cloud-based platforms for centralized management and remote access, and the integration of smart home security systems with other smart home devices, creating a cohesive and convenient experience for consumers. These advancements offer significant competitive advantages, enhancing market penetration and customer satisfaction. The introduction of DIY solutions like Swann's Wire-Free Security Camera further expands market reach.
Challenges in the Smart Home Security Services Industry Market
The industry faces challenges including cybersecurity vulnerabilities, data privacy concerns, and the high cost of implementation for some smart home security solutions. Supply chain disruptions and fierce competition from established players and new entrants also pose significant obstacles. These challenges collectively impact market growth and profitability by xx% annually.
Forces Driving Smart Home Security Services Industry Growth
Technological advancements, such as AI and IoT integration, are major growth catalysts. Rising consumer awareness of home security risks and increased affordability of smart home devices are driving adoption. Favorable regulatory environments in certain regions, coupled with government initiatives promoting smart cities, also boost market expansion. For instance, government subsidies for smart home security upgrades in certain regions have significantly impacted growth.
Long-Term Growth Catalysts in Smart Home Security Services Industry
Long-term growth is fueled by the continuous development of innovative technologies, strategic partnerships between technology providers and security companies, and expansions into emerging markets with high growth potential. This collaborative approach enhances product offerings, improves market reach, and accelerates the overall industry's advancement.
Emerging Opportunities in Smart Home Security Services Industry
Opportunities lie in expanding into developing markets with increasing internet penetration and growing middle classes. The integration of smart home security with other smart home ecosystems offers significant potential. New technologies, such as advanced facial recognition, behavioral analytics, and predictive threat detection, represent promising avenues for market growth. Moreover, personalized security packages catering to specific user needs present lucrative possibilities.
Leading Players in the Smart Home Security Services Industry Sector
- iControl Networks Inc
- Honeywell International Inc
- ADT Security Services
- United Technologies Corporation
- Smart home Inc
- Comcast Corporation
- Vivint Inc
- Tyco Security Products
- Control4 Corporation
- AT&T Inc
Key Milestones in Smart Home Security Services Industry Industry
- June 2020: Swann launched its Wire-Free Security Camera, a DIY solution boosting market accessibility.
- September 2020: Hangzhou Hikvision Digital Technology Co. Ltd introduced Hik-ProConnect, a cloud-based solution enhancing system management and service offerings.
Strategic Outlook for Smart Home Security Services Industry Market
The future of the Smart Home Security Services market is bright, driven by consistent technological innovation, evolving consumer preferences, and increasing adoption across diverse geographical regions. Strategic opportunities exist in developing tailored security solutions, expanding into underserved markets, and capitalizing on the convergence of smart home and security technologies. This presents significant potential for market expansion and profitability for industry players.
Smart Home Security Services Industry Segmentation
-
1. Product
-
1.1. Video Surveillance
- 1.1.1. Security Cameras
- 1.1.2. Monitors
- 1.1.3. Storage Devices
- 1.1.4. Others
-
1.2. Access Control
- 1.2.1. Facial Recognition
- 1.2.2. Fingerprint Recognition
- 1.2.3. Iris Recognition
-
1.1. Video Surveillance
-
2. Installation
- 2.1. Professional Installation
- 2.2. Self-installation
Smart Home Security Services Industry Segmentation By Geography
-
1. North America
- 1.1. United States
- 1.2. Canada
-
2. Europe
- 2.1. United Kingdom
- 2.2. Germany
- 2.3. France
- 2.4. Rest of Europe
-
3. Asia Pacific
- 3.1. China
- 3.2. Japan
- 3.3. India
- 3.4. Rest of Asia Pacific
-
4. Middle East and Africa
- 4.1. Saudi Arabia
- 4.2. United Arab Emirates
- 4.3. Rest of Middle East and Africa
-
5. Latin America
- 5.1. Brazil
- 5.2. Mexico
- 5.3. Rest of Latin America
Smart Home Security Services Industry REPORT HIGHLIGHTS
| Aspects | Details |
|---|---|
| Study Period | 2019-2033 |
| Base Year | 2024 |
| Estimated Year | 2025 |
| Forecast Period | 2025-2033 |
| Historical Period | 2019-2024 |
| Growth Rate | CAGR of 24.10% from 2019-2033 |
| Segmentation |
|
Table of Contents
- 1. Introduction
- 1.1. Research Scope
- 1.2. Market Segmentation
- 1.3. Research Methodology
- 1.4. Definitions and Assumptions
- 2. Executive Summary
- 2.1. Introduction
- 3. Market Dynamics
- 3.1. Introduction
- 3.2. Market Drivers
- 3.2.1. Growing Safety Concerns; Decreasing Costs of Sensors
- 3.3. Market Restrains
- 3.3.1. High Installation Costs
- 3.4. Market Trends
- 3.4.1. Video Surveillance systems are expected to register significant growth in forecasted period
- 4. Market Factor Analysis
- 4.1. Porters Five Forces
- 4.2. Supply/Value Chain
- 4.3. PESTEL analysis
- 4.4. Market Entropy
- 4.5. Patent/Trademark Analysis
- 5. Global Smart Home Security Services Industry Analysis, Insights and Forecast, 2019-2031
- 5.1. Market Analysis, Insights and Forecast - by Product
- 5.1.1. Video Surveillance
- 5.1.1.1. Security Cameras
- 5.1.1.2. Monitors
- 5.1.1.3. Storage Devices
- 5.1.1.4. Others
- 5.1.2. Access Control
- 5.1.2.1. Facial Recognition
- 5.1.2.2. Fingerprint Recognition
- 5.1.2.3. Iris Recognition
- 5.1.1. Video Surveillance
- 5.2. Market Analysis, Insights and Forecast - by Installation
- 5.2.1. Professional Installation
- 5.2.2. Self-installation
- 5.3. Market Analysis, Insights and Forecast - by Region
- 5.3.1. North America
- 5.3.2. Europe
- 5.3.3. Asia Pacific
- 5.3.4. Middle East and Africa
- 5.3.5. Latin America
- 5.1. Market Analysis, Insights and Forecast - by Product
- 6. North America Smart Home Security Services Industry Analysis, Insights and Forecast, 2019-2031
- 6.1. Market Analysis, Insights and Forecast - by Product
- 6.1.1. Video Surveillance
- 6.1.1.1. Security Cameras
- 6.1.1.2. Monitors
- 6.1.1.3. Storage Devices
- 6.1.1.4. Others
- 6.1.2. Access Control
- 6.1.2.1. Facial Recognition
- 6.1.2.2. Fingerprint Recognition
- 6.1.2.3. Iris Recognition
- 6.1.1. Video Surveillance
- 6.2. Market Analysis, Insights and Forecast - by Installation
- 6.2.1. Professional Installation
- 6.2.2. Self-installation
- 6.1. Market Analysis, Insights and Forecast - by Product
- 7. Europe Smart Home Security Services Industry Analysis, Insights and Forecast, 2019-2031
- 7.1. Market Analysis, Insights and Forecast - by Product
- 7.1.1. Video Surveillance
- 7.1.1.1. Security Cameras
- 7.1.1.2. Monitors
- 7.1.1.3. Storage Devices
- 7.1.1.4. Others
- 7.1.2. Access Control
- 7.1.2.1. Facial Recognition
- 7.1.2.2. Fingerprint Recognition
- 7.1.2.3. Iris Recognition
- 7.1.1. Video Surveillance
- 7.2. Market Analysis, Insights and Forecast - by Installation
- 7.2.1. Professional Installation
- 7.2.2. Self-installation
- 7.1. Market Analysis, Insights and Forecast - by Product
- 8. Asia Pacific Smart Home Security Services Industry Analysis, Insights and Forecast, 2019-2031
- 8.1. Market Analysis, Insights and Forecast - by Product
- 8.1.1. Video Surveillance
- 8.1.1.1. Security Cameras
- 8.1.1.2. Monitors
- 8.1.1.3. Storage Devices
- 8.1.1.4. Others
- 8.1.2. Access Control
- 8.1.2.1. Facial Recognition
- 8.1.2.2. Fingerprint Recognition
- 8.1.2.3. Iris Recognition
- 8.1.1. Video Surveillance
- 8.2. Market Analysis, Insights and Forecast - by Installation
- 8.2.1. Professional Installation
- 8.2.2. Self-installation
- 8.1. Market Analysis, Insights and Forecast - by Product
- 9. Middle East and Africa Smart Home Security Services Industry Analysis, Insights and Forecast, 2019-2031
- 9.1. Market Analysis, Insights and Forecast - by Product
- 9.1.1. Video Surveillance
- 9.1.1.1. Security Cameras
- 9.1.1.2. Monitors
- 9.1.1.3. Storage Devices
- 9.1.1.4. Others
- 9.1.2. Access Control
- 9.1.2.1. Facial Recognition
- 9.1.2.2. Fingerprint Recognition
- 9.1.2.3. Iris Recognition
- 9.1.1. Video Surveillance
- 9.2. Market Analysis, Insights and Forecast - by Installation
- 9.2.1. Professional Installation
- 9.2.2. Self-installation
- 9.1. Market Analysis, Insights and Forecast - by Product
- 10. Latin America Smart Home Security Services Industry Analysis, Insights and Forecast, 2019-2031
- 10.1. Market Analysis, Insights and Forecast - by Product
- 10.1.1. Video Surveillance
- 10.1.1.1. Security Cameras
- 10.1.1.2. Monitors
- 10.1.1.3. Storage Devices
- 10.1.1.4. Others
- 10.1.2. Access Control
- 10.1.2.1. Facial Recognition
- 10.1.2.2. Fingerprint Recognition
- 10.1.2.3. Iris Recognition
- 10.1.1. Video Surveillance
- 10.2. Market Analysis, Insights and Forecast - by Installation
- 10.2.1. Professional Installation
- 10.2.2. Self-installation
- 10.1. Market Analysis, Insights and Forecast - by Product
- 11. North America Smart Home Security Services Industry Analysis, Insights and Forecast, 2019-2031
- 11.1. Market Analysis, Insights and Forecast - By Country/Sub-region
- 11.1.1. undefined
- 12. Europe Smart Home Security Services Industry Analysis, Insights and Forecast, 2019-2031
- 12.1. Market Analysis, Insights and Forecast - By Country/Sub-region
- 12.1.1. undefined
- 13. Asia Pacific Smart Home Security Services Industry Analysis, Insights and Forecast, 2019-2031
- 13.1. Market Analysis, Insights and Forecast - By Country/Sub-region
- 13.1.1. undefined
- 14. South America Smart Home Security Services Industry Analysis, Insights and Forecast, 2019-2031
- 14.1. Market Analysis, Insights and Forecast - By Country/Sub-region
- 14.1.1. undefined
- 15. North America Smart Home Security Services Industry Analysis, Insights and Forecast, 2019-2031
- 15.1. Market Analysis, Insights and Forecast - By Country/Sub-region
- 15.1.1. undefined
- 16. MEA Smart Home Security Services Industry Analysis, Insights and Forecast, 2019-2031
- 16.1. Market Analysis, Insights and Forecast - By Country/Sub-region
- 16.1.1. undefined
- 17. Competitive Analysis
- 17.1. Global Market Share Analysis 2024
- 17.2. Company Profiles
- 17.2.1 iControl Networks Inc
- 17.2.1.1. Overview
- 17.2.1.2. Products
- 17.2.1.3. SWOT Analysis
- 17.2.1.4. Recent Developments
- 17.2.1.5. Financials (Based on Availability)
- 17.2.2 Honeywell International Inc
- 17.2.2.1. Overview
- 17.2.2.2. Products
- 17.2.2.3. SWOT Analysis
- 17.2.2.4. Recent Developments
- 17.2.2.5. Financials (Based on Availability)
- 17.2.3 ADT Security Services
- 17.2.3.1. Overview
- 17.2.3.2. Products
- 17.2.3.3. SWOT Analysis
- 17.2.3.4. Recent Developments
- 17.2.3.5. Financials (Based on Availability)
- 17.2.4 United Technologies Corporation
- 17.2.4.1. Overview
- 17.2.4.2. Products
- 17.2.4.3. SWOT Analysis
- 17.2.4.4. Recent Developments
- 17.2.4.5. Financials (Based on Availability)
- 17.2.5 Smart home Inc
- 17.2.5.1. Overview
- 17.2.5.2. Products
- 17.2.5.3. SWOT Analysis
- 17.2.5.4. Recent Developments
- 17.2.5.5. Financials (Based on Availability)
- 17.2.6 Comcast Corporation
- 17.2.6.1. Overview
- 17.2.6.2. Products
- 17.2.6.3. SWOT Analysis
- 17.2.6.4. Recent Developments
- 17.2.6.5. Financials (Based on Availability)
- 17.2.7 Vivint Inc
- 17.2.7.1. Overview
- 17.2.7.2. Products
- 17.2.7.3. SWOT Analysis
- 17.2.7.4. Recent Developments
- 17.2.7.5. Financials (Based on Availability)
- 17.2.8 Tyco Security Products
- 17.2.8.1. Overview
- 17.2.8.2. Products
- 17.2.8.3. SWOT Analysis
- 17.2.8.4. Recent Developments
- 17.2.8.5. Financials (Based on Availability)
- 17.2.9 Control4 Corporation
- 17.2.9.1. Overview
- 17.2.9.2. Products
- 17.2.9.3. SWOT Analysis
- 17.2.9.4. Recent Developments
- 17.2.9.5. Financials (Based on Availability)
- 17.2.10 AT&T Inc
- 17.2.10.1. Overview
- 17.2.10.2. Products
- 17.2.10.3. SWOT Analysis
- 17.2.10.4. Recent Developments
- 17.2.10.5. Financials (Based on Availability)
- 17.2.1 iControl Networks Inc
List of Figures
- Figure 1: Global Smart Home Security Services Industry Revenue Breakdown (Million, %) by Region 2024 & 2032
- Figure 2: Global Smart Home Security Services Industry Volume Breakdown (K Unit, %) by Region 2024 & 2032
- Figure 3: North America Smart Home Security Services Industry Revenue (Million), by Country 2024 & 2032
- Figure 4: North America Smart Home Security Services Industry Volume (K Unit), by Country 2024 & 2032
- Figure 5: North America Smart Home Security Services Industry Revenue Share (%), by Country 2024 & 2032
- Figure 6: North America Smart Home Security Services Industry Volume Share (%), by Country 2024 & 2032
- Figure 7: Europe Smart Home Security Services Industry Revenue (Million), by Country 2024 & 2032
- Figure 8: Europe Smart Home Security Services Industry Volume (K Unit), by Country 2024 & 2032
- Figure 9: Europe Smart Home Security Services Industry Revenue Share (%), by Country 2024 & 2032
- Figure 10: Europe Smart Home Security Services Industry Volume Share (%), by Country 2024 & 2032
- Figure 11: Asia Pacific Smart Home Security Services Industry Revenue (Million), by Country 2024 & 2032
- Figure 12: Asia Pacific Smart Home Security Services Industry Volume (K Unit), by Country 2024 & 2032
- Figure 13: Asia Pacific Smart Home Security Services Industry Revenue Share (%), by Country 2024 & 2032
- Figure 14: Asia Pacific Smart Home Security Services Industry Volume Share (%), by Country 2024 & 2032
- Figure 15: South America Smart Home Security Services Industry Revenue (Million), by Country 2024 & 2032
- Figure 16: South America Smart Home Security Services Industry Volume (K Unit), by Country 2024 & 2032
- Figure 17: South America Smart Home Security Services Industry Revenue Share (%), by Country 2024 & 2032
- Figure 18: South America Smart Home Security Services Industry Volume Share (%), by Country 2024 & 2032
- Figure 19: North America Smart Home Security Services Industry Revenue (Million), by Country 2024 & 2032
- Figure 20: North America Smart Home Security Services Industry Volume (K Unit), by Country 2024 & 2032
- Figure 21: North America Smart Home Security Services Industry Revenue Share (%), by Country 2024 & 2032
- Figure 22: North America Smart Home Security Services Industry Volume Share (%), by Country 2024 & 2032
- Figure 23: MEA Smart Home Security Services Industry Revenue (Million), by Country 2024 & 2032
- Figure 24: MEA Smart Home Security Services Industry Volume (K Unit), by Country 2024 & 2032
- Figure 25: MEA Smart Home Security Services Industry Revenue Share (%), by Country 2024 & 2032
- Figure 26: MEA Smart Home Security Services Industry Volume Share (%), by Country 2024 & 2032
- Figure 27: North America Smart Home Security Services Industry Revenue (Million), by Product 2024 & 2032
- Figure 28: North America Smart Home Security Services Industry Volume (K Unit), by Product 2024 & 2032
- Figure 29: North America Smart Home Security Services Industry Revenue Share (%), by Product 2024 & 2032
- Figure 30: North America Smart Home Security Services Industry Volume Share (%), by Product 2024 & 2032
- Figure 31: North America Smart Home Security Services Industry Revenue (Million), by Installation 2024 & 2032
- Figure 32: North America Smart Home Security Services Industry Volume (K Unit), by Installation 2024 & 2032
- Figure 33: North America Smart Home Security Services Industry Revenue Share (%), by Installation 2024 & 2032
- Figure 34: North America Smart Home Security Services Industry Volume Share (%), by Installation 2024 & 2032
- Figure 35: North America Smart Home Security Services Industry Revenue (Million), by Country 2024 & 2032
- Figure 36: North America Smart Home Security Services Industry Volume (K Unit), by Country 2024 & 2032
- Figure 37: North America Smart Home Security Services Industry Revenue Share (%), by Country 2024 & 2032
- Figure 38: North America Smart Home Security Services Industry Volume Share (%), by Country 2024 & 2032
- Figure 39: Europe Smart Home Security Services Industry Revenue (Million), by Product 2024 & 2032
- Figure 40: Europe Smart Home Security Services Industry Volume (K Unit), by Product 2024 & 2032
- Figure 41: Europe Smart Home Security Services Industry Revenue Share (%), by Product 2024 & 2032
- Figure 42: Europe Smart Home Security Services Industry Volume Share (%), by Product 2024 & 2032
- Figure 43: Europe Smart Home Security Services Industry Revenue (Million), by Installation 2024 & 2032
- Figure 44: Europe Smart Home Security Services Industry Volume (K Unit), by Installation 2024 & 2032
- Figure 45: Europe Smart Home Security Services Industry Revenue Share (%), by Installation 2024 & 2032
- Figure 46: Europe Smart Home Security Services Industry Volume Share (%), by Installation 2024 & 2032
- Figure 47: Europe Smart Home Security Services Industry Revenue (Million), by Country 2024 & 2032
- Figure 48: Europe Smart Home Security Services Industry Volume (K Unit), by Country 2024 & 2032
- Figure 49: Europe Smart Home Security Services Industry Revenue Share (%), by Country 2024 & 2032
- Figure 50: Europe Smart Home Security Services Industry Volume Share (%), by Country 2024 & 2032
- Figure 51: Asia Pacific Smart Home Security Services Industry Revenue (Million), by Product 2024 & 2032
- Figure 52: Asia Pacific Smart Home Security Services Industry Volume (K Unit), by Product 2024 & 2032
- Figure 53: Asia Pacific Smart Home Security Services Industry Revenue Share (%), by Product 2024 & 2032
- Figure 54: Asia Pacific Smart Home Security Services Industry Volume Share (%), by Product 2024 & 2032
- Figure 55: Asia Pacific Smart Home Security Services Industry Revenue (Million), by Installation 2024 & 2032
- Figure 56: Asia Pacific Smart Home Security Services Industry Volume (K Unit), by Installation 2024 & 2032
- Figure 57: Asia Pacific Smart Home Security Services Industry Revenue Share (%), by Installation 2024 & 2032
- Figure 58: Asia Pacific Smart Home Security Services Industry Volume Share (%), by Installation 2024 & 2032
- Figure 59: Asia Pacific Smart Home Security Services Industry Revenue (Million), by Country 2024 & 2032
- Figure 60: Asia Pacific Smart Home Security Services Industry Volume (K Unit), by Country 2024 & 2032
- Figure 61: Asia Pacific Smart Home Security Services Industry Revenue Share (%), by Country 2024 & 2032
- Figure 62: Asia Pacific Smart Home Security Services Industry Volume Share (%), by Country 2024 & 2032
- Figure 63: Middle East and Africa Smart Home Security Services Industry Revenue (Million), by Product 2024 & 2032
- Figure 64: Middle East and Africa Smart Home Security Services Industry Volume (K Unit), by Product 2024 & 2032
- Figure 65: Middle East and Africa Smart Home Security Services Industry Revenue Share (%), by Product 2024 & 2032
- Figure 66: Middle East and Africa Smart Home Security Services Industry Volume Share (%), by Product 2024 & 2032
- Figure 67: Middle East and Africa Smart Home Security Services Industry Revenue (Million), by Installation 2024 & 2032
- Figure 68: Middle East and Africa Smart Home Security Services Industry Volume (K Unit), by Installation 2024 & 2032
- Figure 69: Middle East and Africa Smart Home Security Services Industry Revenue Share (%), by Installation 2024 & 2032
- Figure 70: Middle East and Africa Smart Home Security Services Industry Volume Share (%), by Installation 2024 & 2032
- Figure 71: Middle East and Africa Smart Home Security Services Industry Revenue (Million), by Country 2024 & 2032
- Figure 72: Middle East and Africa Smart Home Security Services Industry Volume (K Unit), by Country 2024 & 2032
- Figure 73: Middle East and Africa Smart Home Security Services Industry Revenue Share (%), by Country 2024 & 2032
- Figure 74: Middle East and Africa Smart Home Security Services Industry Volume Share (%), by Country 2024 & 2032
- Figure 75: Latin America Smart Home Security Services Industry Revenue (Million), by Product 2024 & 2032
- Figure 76: Latin America Smart Home Security Services Industry Volume (K Unit), by Product 2024 & 2032
- Figure 77: Latin America Smart Home Security Services Industry Revenue Share (%), by Product 2024 & 2032
- Figure 78: Latin America Smart Home Security Services Industry Volume Share (%), by Product 2024 & 2032
- Figure 79: Latin America Smart Home Security Services Industry Revenue (Million), by Installation 2024 & 2032
- Figure 80: Latin America Smart Home Security Services Industry Volume (K Unit), by Installation 2024 & 2032
- Figure 81: Latin America Smart Home Security Services Industry Revenue Share (%), by Installation 2024 & 2032
- Figure 82: Latin America Smart Home Security Services Industry Volume Share (%), by Installation 2024 & 2032
- Figure 83: Latin America Smart Home Security Services Industry Revenue (Million), by Country 2024 & 2032
- Figure 84: Latin America Smart Home Security Services Industry Volume (K Unit), by Country 2024 & 2032
- Figure 85: Latin America Smart Home Security Services Industry Revenue Share (%), by Country 2024 & 2032
- Figure 86: Latin America Smart Home Security Services Industry Volume Share (%), by Country 2024 & 2032
List of Tables
- Table 1: Global Smart Home Security Services Industry Revenue Million Forecast, by Region 2019 & 2032
- Table 2: Global Smart Home Security Services Industry Volume K Unit Forecast, by Region 2019 & 2032
- Table 3: Global Smart Home Security Services Industry Revenue Million Forecast, by Product 2019 & 2032
- Table 4: Global Smart Home Security Services Industry Volume K Unit Forecast, by Product 2019 & 2032
- Table 5: Global Smart Home Security Services Industry Revenue Million Forecast, by Installation 2019 & 2032
- Table 6: Global Smart Home Security Services Industry Volume K Unit Forecast, by Installation 2019 & 2032
- Table 7: Global Smart Home Security Services Industry Revenue Million Forecast, by Region 2019 & 2032
- Table 8: Global Smart Home Security Services Industry Volume K Unit Forecast, by Region 2019 & 2032
- Table 9: Global Smart Home Security Services Industry Revenue Million Forecast, by Country 2019 & 2032
- Table 10: Global Smart Home Security Services Industry Volume K Unit Forecast, by Country 2019 & 2032
- Table 11: Global Smart Home Security Services Industry Revenue Million Forecast, by Country 2019 & 2032
- Table 12: Global Smart Home Security Services Industry Volume K Unit Forecast, by Country 2019 & 2032
- Table 13: Global Smart Home Security Services Industry Revenue Million Forecast, by Country 2019 & 2032
- Table 14: Global Smart Home Security Services Industry Volume K Unit Forecast, by Country 2019 & 2032
- Table 15: Global Smart Home Security Services Industry Revenue Million Forecast, by Country 2019 & 2032
- Table 16: Global Smart Home Security Services Industry Volume K Unit Forecast, by Country 2019 & 2032
- Table 17: Global Smart Home Security Services Industry Revenue Million Forecast, by Country 2019 & 2032
- Table 18: Global Smart Home Security Services Industry Volume K Unit Forecast, by Country 2019 & 2032
- Table 19: Global Smart Home Security Services Industry Revenue Million Forecast, by Country 2019 & 2032
- Table 20: Global Smart Home Security Services Industry Volume K Unit Forecast, by Country 2019 & 2032
- Table 21: Global Smart Home Security Services Industry Revenue Million Forecast, by Product 2019 & 2032
- Table 22: Global Smart Home Security Services Industry Volume K Unit Forecast, by Product 2019 & 2032
- Table 23: Global Smart Home Security Services Industry Revenue Million Forecast, by Installation 2019 & 2032
- Table 24: Global Smart Home Security Services Industry Volume K Unit Forecast, by Installation 2019 & 2032
- Table 25: Global Smart Home Security Services Industry Revenue Million Forecast, by Country 2019 & 2032
- Table 26: Global Smart Home Security Services Industry Volume K Unit Forecast, by Country 2019 & 2032
- Table 27: United States Smart Home Security Services Industry Revenue (Million) Forecast, by Application 2019 & 2032
- Table 28: United States Smart Home Security Services Industry Volume (K Unit) Forecast, by Application 2019 & 2032
- Table 29: Canada Smart Home Security Services Industry Revenue (Million) Forecast, by Application 2019 & 2032
- Table 30: Canada Smart Home Security Services Industry Volume (K Unit) Forecast, by Application 2019 & 2032
- Table 31: Global Smart Home Security Services Industry Revenue Million Forecast, by Product 2019 & 2032
- Table 32: Global Smart Home Security Services Industry Volume K Unit Forecast, by Product 2019 & 2032
- Table 33: Global Smart Home Security Services Industry Revenue Million Forecast, by Installation 2019 & 2032
- Table 34: Global Smart Home Security Services Industry Volume K Unit Forecast, by Installation 2019 & 2032
- Table 35: Global Smart Home Security Services Industry Revenue Million Forecast, by Country 2019 & 2032
- Table 36: Global Smart Home Security Services Industry Volume K Unit Forecast, by Country 2019 & 2032
- Table 37: United Kingdom Smart Home Security Services Industry Revenue (Million) Forecast, by Application 2019 & 2032
- Table 38: United Kingdom Smart Home Security Services Industry Volume (K Unit) Forecast, by Application 2019 & 2032
- Table 39: Germany Smart Home Security Services Industry Revenue (Million) Forecast, by Application 2019 & 2032
- Table 40: Germany Smart Home Security Services Industry Volume (K Unit) Forecast, by Application 2019 & 2032
- Table 41: France Smart Home Security Services Industry Revenue (Million) Forecast, by Application 2019 & 2032
- Table 42: France Smart Home Security Services Industry Volume (K Unit) Forecast, by Application 2019 & 2032
- Table 43: Rest of Europe Smart Home Security Services Industry Revenue (Million) Forecast, by Application 2019 & 2032
- Table 44: Rest of Europe Smart Home Security Services Industry Volume (K Unit) Forecast, by Application 2019 & 2032
- Table 45: Global Smart Home Security Services Industry Revenue Million Forecast, by Product 2019 & 2032
- Table 46: Global Smart Home Security Services Industry Volume K Unit Forecast, by Product 2019 & 2032
- Table 47: Global Smart Home Security Services Industry Revenue Million Forecast, by Installation 2019 & 2032
- Table 48: Global Smart Home Security Services Industry Volume K Unit Forecast, by Installation 2019 & 2032
- Table 49: Global Smart Home Security Services Industry Revenue Million Forecast, by Country 2019 & 2032
- Table 50: Global Smart Home Security Services Industry Volume K Unit Forecast, by Country 2019 & 2032
- Table 51: China Smart Home Security Services Industry Revenue (Million) Forecast, by Application 2019 & 2032
- Table 52: China Smart Home Security Services Industry Volume (K Unit) Forecast, by Application 2019 & 2032
- Table 53: Japan Smart Home Security Services Industry Revenue (Million) Forecast, by Application 2019 & 2032
- Table 54: Japan Smart Home Security Services Industry Volume (K Unit) Forecast, by Application 2019 & 2032
- Table 55: India Smart Home Security Services Industry Revenue (Million) Forecast, by Application 2019 & 2032
- Table 56: India Smart Home Security Services Industry Volume (K Unit) Forecast, by Application 2019 & 2032
- Table 57: Rest of Asia Pacific Smart Home Security Services Industry Revenue (Million) Forecast, by Application 2019 & 2032
- Table 58: Rest of Asia Pacific Smart Home Security Services Industry Volume (K Unit) Forecast, by Application 2019 & 2032
- Table 59: Global Smart Home Security Services Industry Revenue Million Forecast, by Product 2019 & 2032
- Table 60: Global Smart Home Security Services Industry Volume K Unit Forecast, by Product 2019 & 2032
- Table 61: Global Smart Home Security Services Industry Revenue Million Forecast, by Installation 2019 & 2032
- Table 62: Global Smart Home Security Services Industry Volume K Unit Forecast, by Installation 2019 & 2032
- Table 63: Global Smart Home Security Services Industry Revenue Million Forecast, by Country 2019 & 2032
- Table 64: Global Smart Home Security Services Industry Volume K Unit Forecast, by Country 2019 & 2032
- Table 65: Saudi Arabia Smart Home Security Services Industry Revenue (Million) Forecast, by Application 2019 & 2032
- Table 66: Saudi Arabia Smart Home Security Services Industry Volume (K Unit) Forecast, by Application 2019 & 2032
- Table 67: United Arab Emirates Smart Home Security Services Industry Revenue (Million) Forecast, by Application 2019 & 2032
- Table 68: United Arab Emirates Smart Home Security Services Industry Volume (K Unit) Forecast, by Application 2019 & 2032
- Table 69: Rest of Middle East and Africa Smart Home Security Services Industry Revenue (Million) Forecast, by Application 2019 & 2032
- Table 70: Rest of Middle East and Africa Smart Home Security Services Industry Volume (K Unit) Forecast, by Application 2019 & 2032
- Table 71: Global Smart Home Security Services Industry Revenue Million Forecast, by Product 2019 & 2032
- Table 72: Global Smart Home Security Services Industry Volume K Unit Forecast, by Product 2019 & 2032
- Table 73: Global Smart Home Security Services Industry Revenue Million Forecast, by Installation 2019 & 2032
- Table 74: Global Smart Home Security Services Industry Volume K Unit Forecast, by Installation 2019 & 2032
- Table 75: Global Smart Home Security Services Industry Revenue Million Forecast, by Country 2019 & 2032
- Table 76: Global Smart Home Security Services Industry Volume K Unit Forecast, by Country 2019 & 2032
- Table 77: Brazil Smart Home Security Services Industry Revenue (Million) Forecast, by Application 2019 & 2032
- Table 78: Brazil Smart Home Security Services Industry Volume (K Unit) Forecast, by Application 2019 & 2032
- Table 79: Mexico Smart Home Security Services Industry Revenue (Million) Forecast, by Application 2019 & 2032
- Table 80: Mexico Smart Home Security Services Industry Volume (K Unit) Forecast, by Application 2019 & 2032
- Table 81: Rest of Latin America Smart Home Security Services Industry Revenue (Million) Forecast, by Application 2019 & 2032
- Table 82: Rest of Latin America Smart Home Security Services Industry Volume (K Unit) Forecast, by Application 2019 & 2032
Frequently Asked Questions
1. What is the projected Compound Annual Growth Rate (CAGR) of the Smart Home Security Services Industry?
The projected CAGR is approximately 24.10%.
2. Which companies are prominent players in the Smart Home Security Services Industry?
Key companies in the market include iControl Networks Inc , Honeywell International Inc, ADT Security Services, United Technologies Corporation, Smart home Inc, Comcast Corporation, Vivint Inc, Tyco Security Products, Control4 Corporation, AT&T Inc.
3. What are the main segments of the Smart Home Security Services Industry?
The market segments include Product, Installation.
4. Can you provide details about the market size?
The market size is estimated to be USD XX Million as of 2022.
5. What are some drivers contributing to market growth?
Growing Safety Concerns; Decreasing Costs of Sensors.
6. What are the notable trends driving market growth?
Video Surveillance systems are expected to register significant growth in forecasted period.
7. Are there any restraints impacting market growth?
High Installation Costs.
8. Can you provide examples of recent developments in the market?
June 2020: Swann, engaged in providing do-it-yourself security solutions, announced the release of the Swann Wire-Free Security Camera, a new, completely wireless camera that can be set up in seconds and used for monitoring indoors or outdoors in homes. The camera is stocked with modern smart security features, including free face recognition and cloud or local storage.
9. What pricing options are available for accessing the report?
Pricing options include single-user, multi-user, and enterprise licenses priced at USD 4750, USD 5250, and USD 8750 respectively.
10. Is the market size provided in terms of value or volume?
The market size is provided in terms of value, measured in Million and volume, measured in K Unit.
11. Are there any specific market keywords associated with the report?
Yes, the market keyword associated with the report is "Smart Home Security Services Industry," which aids in identifying and referencing the specific market segment covered.
12. How do I determine which pricing option suits my needs best?
The pricing options vary based on user requirements and access needs. Individual users may opt for single-user licenses, while businesses requiring broader access may choose multi-user or enterprise licenses for cost-effective access to the report.
13. Are there any additional resources or data provided in the Smart Home Security Services Industry report?
While the report offers comprehensive insights, it's advisable to review the specific contents or supplementary materials provided to ascertain if additional resources or data are available.
14. How can I stay updated on further developments or reports in the Smart Home Security Services Industry?
To stay informed about further developments, trends, and reports in the Smart Home Security Services Industry, consider subscribing to industry newsletters, following relevant companies and organizations, or regularly checking reputable industry news sources and publications.
Methodology
Step 1 - Identification of Relevant Samples Size from Population Database


Step 2 - Approaches for Defining Global Market Size (Value, Volume* & Price*)

Note*: In applicable scenarios
Step 3 - Data Sources
Primary Research
- Web Analytics
- Survey Reports
- Research Institute
- Latest Research Reports
- Opinion Leaders
Secondary Research
- Annual Reports
- White Paper
- Latest Press Release
- Industry Association
- Paid Database
- Investor Presentations

Step 4 - Data Triangulation
Involves using different sources of information in order to increase the validity of a study
These sources are likely to be stakeholders in a program - participants, other researchers, program staff, other community members, and so on.
Then we put all data in single framework & apply various statistical tools to find out the dynamic on the market.
During the analysis stage, feedback from the stakeholder groups would be compared to determine areas of agreement as well as areas of divergence
