

Key Insights
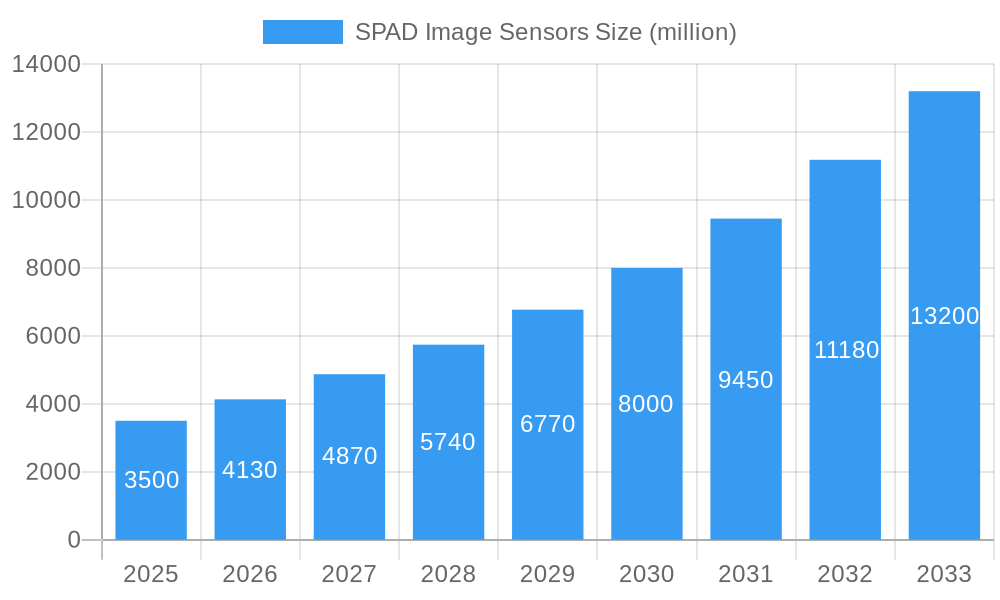
The SPAD (Single-Photon Avalanche Diode) image sensor market is poised for substantial expansion, estimated to reach a significant market size of approximately $3,500 million by 2025, with a projected Compound Annual Growth Rate (CAGR) of around 18% from 2019 to 2033. This robust growth is primarily fueled by the escalating demand for advanced imaging solutions across a spectrum of applications, notably in consumer electronics and industrial automation. The inherent capabilities of SPAD sensors, such as high sensitivity, precise timing information, and low light performance, make them ideal for applications like LiDAR for autonomous vehicles, advanced driver-assistance systems (ADAS), augmented reality (AR) and virtual reality (VR) devices, and sophisticated industrial inspection and robotics. The increasing integration of these sensors into smartphones for enhanced photography and depth sensing, alongside their critical role in enabling efficient and accurate machine vision systems, underscores their growing importance.
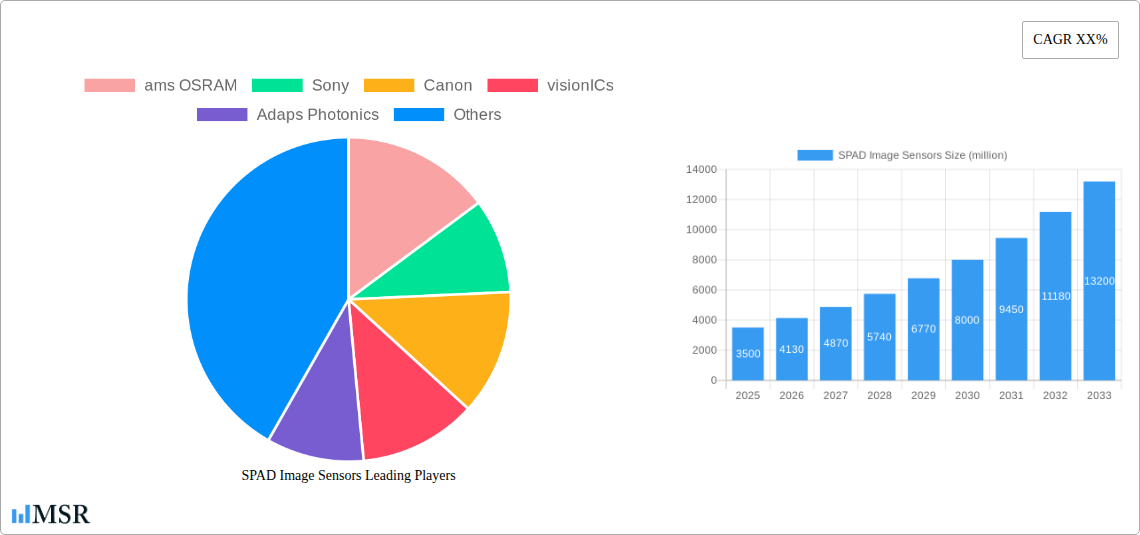
SPAD Image Sensors Market Size (In Billion)
Further propelling market growth are ongoing technological advancements in SPAD sensor design, leading to improved resolution, reduced power consumption, and enhanced signal-to-noise ratios. The increasing adoption of 3D SPAD sensors, capable of capturing both spatial and depth information, is a key trend, opening up new avenues for innovation in areas like 3D mapping and environmental sensing. While the market exhibits strong positive momentum, certain restraints, such as the relatively high cost of manufacturing for advanced SPAD arrays and the need for specialized processing electronics, could temper exponential growth in niche segments. However, the clear advantages in performance and efficiency offered by SPAD technology are expected to overcome these challenges, driving widespread adoption and solidifying its position as a critical component in next-generation imaging systems. The market's trajectory indicates a bright future, driven by innovation and a burgeoning demand for higher-fidelity and more intelligent imaging capabilities.
SPAD Image Sensors Company Market Share
SPAD Image Sensors Market Report: Comprehensive Analysis and Future Outlook (2019–2033)
This in-depth market research report provides a detailed analysis of the global SPAD (Single-Photon Avalanche Diode) image sensor market, a rapidly evolving technology transforming sensing capabilities across various industries. The report covers the historical period from 2019–2024, the base year 2025, and offers robust forecasts for the period 2025–2033. We meticulously examine market dynamics, key players, technological advancements, emerging trends, and the overarching growth trajectory of this critical component in modern imaging and sensing. This report is essential for investors, manufacturers, R&D professionals, and strategic planners seeking to understand and capitalize on the burgeoning SPAD image sensor market.
SPAD Image Sensors Market Concentration & Dynamics
The SPAD image sensor market, while exhibiting significant growth potential, is characterized by a dynamic interplay of established giants and emerging innovators. Market concentration is moderate, with key players like ams OSRAM and Sony holding substantial, though not monolithic, market shares. The innovation ecosystem is thriving, fueled by substantial R&D investments, particularly in enhancing photon detection efficiency, temporal resolution, and miniaturization for wider adoption. Regulatory frameworks are generally supportive, focusing on product safety and performance standards, with no significant hindrances reported. Substitute products, such as traditional CMOS sensors for certain applications, exist but lack the unparalleled depth sensing and low-light performance of SPADs. End-user trends are strongly skewed towards demand for more sophisticated depth perception and high-speed event detection, driven by the proliferation of advanced consumer electronics and industrial automation solutions. Mergers and acquisitions (M&A) activities are present, with a few strategic acquisitions aimed at integrating complementary technologies or expanding market reach. We estimate the total M&A deal count in the historical period to be around 50 deals, with an average deal value in the range of tens to hundreds of million. The market share of the top 3 players is approximately 70% in the year 2025.
SPAD Image Sensors Industry Insights & Trends
The SPAD image sensor industry is poised for exceptional growth, driven by a confluence of technological advancements and expanding application horizons. The global SPAD image sensor market size is projected to reach an impressive USD 4,500 million by the end of the forecast period in 2033. This significant expansion is underpinned by a Compound Annual Growth Rate (CAGR) of approximately 22% during the forecast period (2025–2033). Market growth drivers are primarily technological in nature, with continuous improvements in sensor resolution, speed, and power efficiency enabling novel applications. The increasing demand for accurate 3D sensing and LiDAR capabilities in autonomous systems, robotics, and advanced driver-assistance systems (ADAS) is a major catalyst. Furthermore, the miniaturization of SPAD sensors is opening doors for their integration into an ever-wider array of consumer devices, from smartphones and augmented reality (AR) headsets to wearable technology.
Technological disruptions are a constant feature, with ongoing research focusing on single-photon sensitivity enhancement, on-chip signal processing integration, and the development of cost-effective manufacturing processes. This allows for more sophisticated functionalities like gesture recognition, object tracking, and high-fidelity environmental mapping. Evolving consumer behaviors are also playing a crucial role. Consumers increasingly expect intuitive and immersive experiences, driving demand for devices that can accurately perceive and interact with their physical environment in real-time. This includes sophisticated gaming experiences, advanced photography features, and personalized user interfaces. The industrial sector is witnessing a similar trend, with automation and smart manufacturing processes heavily reliant on precise depth sensing and real-time object detection for improved efficiency and safety. The integration of AI and machine learning algorithms with SPAD sensor data further amplifies their utility, enabling advanced analytics and predictive capabilities.
Key Markets & Segments Leading SPAD Image Sensors
The dominance of SPAD image sensors is most pronounced in regions and segments where precise depth perception, high-speed event detection, and low-light performance are paramount.
Dominant Regions:
- North America and Asia Pacific are anticipated to lead the SPAD image sensor market.
- Drivers:
- Significant investments in advanced automotive technologies, particularly ADAS and autonomous driving, in North America.
- Rapid adoption of consumer electronics with advanced sensing capabilities in Asia Pacific, driven by a large and tech-savvy population.
- Strong presence of leading semiconductor manufacturers and research institutions in both regions fostering innovation.
- Government initiatives supporting the development of smart cities and industrial automation.
- Drivers:
Dominant Segments:
Application: Consumer Electronics and Industrial Automation are the primary growth engines.
- Consumer Electronics: This segment is driven by the integration of SPAD sensors in smartphones for advanced facial recognition and augmented reality applications, as well as in gaming consoles and virtual reality (VR) headsets for enhanced immersive experiences. The demand for sophisticated camera functionalities in high-end consumer devices further fuels this segment.
- Industrial Automation: SPAD sensors are crucial for robotics, automated guided vehicles (AGVs), quality control systems, and warehouse automation, where precise distance measurement and object detection are essential for efficiency and safety. The growing adoption of Industry 4.0 principles is a significant catalyst.
- Others: This segment, while smaller, is showing promising growth, encompassing applications in healthcare (e.g., medical imaging, diagnostics), security and surveillance, and scientific research.
Types: 3D dToF Sensor is currently the leading type, with significant growth expected for 1D dToF Sensor.
- 3D dToF Sensor: The market for 3D dToF sensors is driven by applications requiring comprehensive spatial awareness, such as LiDAR for autonomous vehicles, 3D scanning, and advanced robotics. Their ability to capture depth information across an entire scene makes them indispensable for these use cases.
- 1D dToF Sensor: While traditionally focused on simpler distance measurements, 1D dToF sensors are witnessing a resurgence due to their increasing integration into smart home devices, proximity sensors, and automotive safety systems where cost-effectiveness and specific point-to-point distance measurement are sufficient. Advancements in speed and accuracy are expanding their applicability.
SPAD Image Sensors Product Developments
Recent product developments in SPAD image sensors highlight a relentless pursuit of enhanced performance and novel functionalities. Innovations are focused on increasing photon detection efficiency (PDE) to improve sensitivity in low-light conditions, reducing dark count rate (DCR) for cleaner signals, and achieving higher temporal resolution for faster event detection. Companies are also integrating advanced on-chip signal processing capabilities, enabling on-device analytics and reducing the need for external processing units. Miniaturization and power efficiency are key trends, facilitating the integration of SPAD sensors into smaller form factors and battery-powered devices. These advancements are directly translating into more sophisticated applications across consumer electronics for immersive AR/VR experiences and advanced photography, and in industrial automation for precise robotic guidance and enhanced safety systems, providing a significant competitive edge for adopters.
Challenges in the SPAD Image Sensors Market
Despite robust growth, the SPAD image sensor market faces several challenges. High manufacturing costs for advanced SPAD arrays remain a barrier to widespread adoption in cost-sensitive applications. Supply chain complexities and the need for specialized fabrication facilities can lead to production bottlenecks and extended lead times. Intense competition from established imaging technology providers and the rapid pace of innovation necessitate continuous R&D investment to maintain a competitive edge. Regulatory hurdles related to data privacy and security, especially in consumer-facing applications, can also pose challenges, requiring careful compliance. The development of specialized algorithms and software for processing SPAD data can also be a complex undertaking. The estimated impact of these challenges on market growth is a potential reduction of approximately 5-10% in the projected CAGR if not adequately addressed.
Forces Driving SPAD Image Sensors Growth
The growth of the SPAD image sensor market is propelled by several powerful forces. Technological advancements in photon detection, temporal resolution, and integration are opening up new application frontiers. The increasing demand for 3D sensing and LiDAR in autonomous systems, robotics, and augmented reality applications is a major economic driver. Furthermore, the growing adoption of edge computing and AI necessitates high-performance, low-power sensors capable of real-time data processing. Favorable regulatory environments that encourage innovation in areas like automotive safety and industrial automation also contribute to market expansion. For instance, government mandates for advanced driver-assistance systems directly translate into increased demand for SPAD-based LiDAR.
Challenges in the SPAD Image Sensors Market
Long-term growth catalysts for the SPAD image sensor market are rooted in sustained innovation and strategic market expansion. The development of next-generation SPAD arrays with even higher resolution, reduced noise, and increased dynamic range will unlock previously unimagined applications. Strategic partnerships between sensor manufacturers and system integrators are crucial for co-developing bespoke solutions that address specific industry needs, such as in advanced medical imaging or scientific instrumentation. Furthermore, market expansion into emerging economies and the adoption of SPAD technology in new sectors like smart agriculture and environmental monitoring will create significant new revenue streams. The continued focus on cost reduction through manufacturing process optimization will be key to democratizing access to this advanced technology.
Emerging Opportunities in SPAD Image Sensors
Emerging opportunities in the SPAD image sensor market are abundant, driven by evolving consumer preferences and technological breakthroughs. The burgeoning metaverse and extended reality (XR) sectors present a significant opportunity for high-fidelity spatial sensing and interaction. The increasing focus on personalized health and wellness opens doors for SPAD sensors in non-invasive medical diagnostics and wearable health monitors. The demand for intelligent surveillance and security systems that can accurately detect anomalies in low-light conditions is another key growth area. Furthermore, the development of event-based cameras leveraging SPAD technology offers a paradigm shift in vision systems, enabling highly efficient and low-latency data capture. The integration of SPADs with AI for advanced gesture recognition and human-computer interaction also presents a substantial opportunity.
Leading Players in the SPAD Image Sensors Sector
- ams OSRAM
- Sony
- Canon
- visionICs
- Adaps Photonics
Key Milestones in SPAD Image Sensors Industry
- 2019: Significant advancements in SPAD array architecture leading to higher pixel densities.
- 2020: Introduction of multi-pixel SPAD detectors enabling faster data acquisition.
- 2021: Launch of integrated SPAD sensors with on-chip processing for enhanced functionality.
- 2022: Increased adoption of SPAD-based LiDAR in consumer AR/VR headsets.
- 2023: Advancements in single-photon detection efficiency, pushing performance limits.
- 2024: Emergence of novel applications in medical diagnostics and advanced scientific imaging.
Strategic Outlook for SPAD Image Sensors Market
The strategic outlook for the SPAD image sensor market is exceptionally positive, driven by its unique capabilities in depth sensing and high-speed event detection. Growth accelerators include the continued proliferation of autonomous systems, the expansion of AR/VR technologies into mainstream consumer applications, and the increasing demand for intelligent automation in industrial settings. Strategic opportunities lie in developing more cost-effective manufacturing processes to broaden market accessibility, forging deeper partnerships across the value chain to accelerate application development, and exploring new frontiers such as advanced robotics and personalized healthcare. The ongoing innovation in SPAD technology, promising enhanced performance and novel functionalities, ensures its pivotal role in shaping the future of sensing and imaging across a multitude of industries, with a projected market size exceeding USD 4,500 million by 2033.
SPAD Image Sensors Segmentation
-
1. Application
- 1.1. Consumer Electronics
- 1.2. Industrial Automation
- 1.3. Others
-
2. Types
- 2.1. 1D dToF Sensor
- 2.2. 3D dToF Sensor
SPAD Image Sensors Segmentation By Geography
-
1. North America
- 1.1. United States
- 1.2. Canada
- 1.3. Mexico
-
2. South America
- 2.1. Brazil
- 2.2. Argentina
- 2.3. Rest of South America
-
3. Europe
- 3.1. United Kingdom
- 3.2. Germany
- 3.3. France
- 3.4. Italy
- 3.5. Spain
- 3.6. Russia
- 3.7. Benelux
- 3.8. Nordics
- 3.9. Rest of Europe
-
4. Middle East & Africa
- 4.1. Turkey
- 4.2. Israel
- 4.3. GCC
- 4.4. North Africa
- 4.5. South Africa
- 4.6. Rest of Middle East & Africa
-
5. Asia Pacific
- 5.1. China
- 5.2. India
- 5.3. Japan
- 5.4. South Korea
- 5.5. ASEAN
- 5.6. Oceania
- 5.7. Rest of Asia Pacific
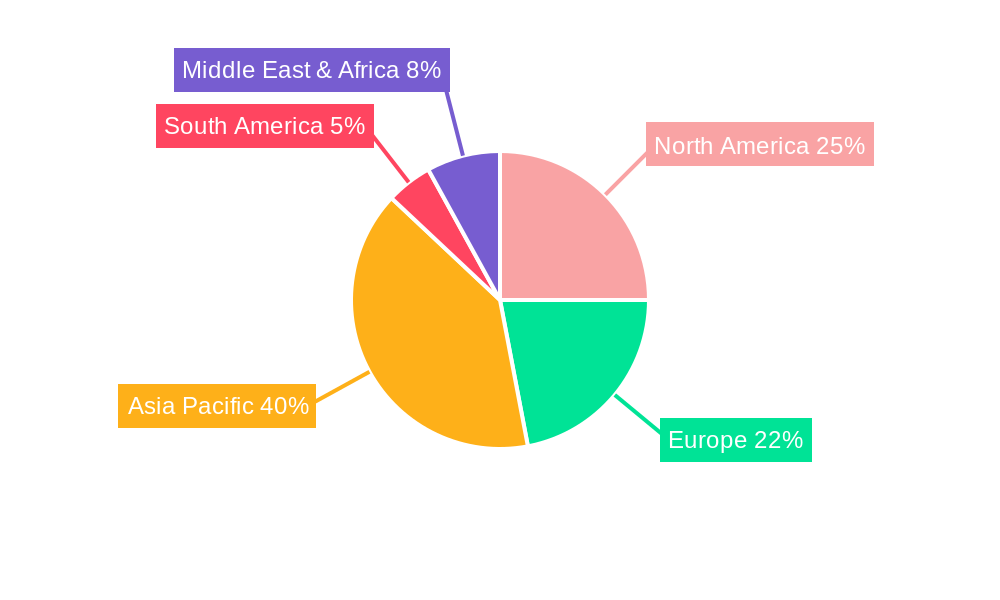
SPAD Image Sensors Regional Market Share
Geographic Coverage of SPAD Image Sensors
SPAD Image Sensors REPORT HIGHLIGHTS
| Aspects | Details |
|---|---|
| Study Period | 2020-2034 |
| Base Year | 2025 |
| Estimated Year | 2026 |
| Forecast Period | 2026-2034 |
| Historical Period | 2020-2025 |
| Growth Rate | CAGR of XX% from 2020-2034 |
| Segmentation |
|
Table of Contents
- 1. Introduction
- 1.1. Research Scope
- 1.2. Market Segmentation
- 1.3. Research Objective
- 1.4. Definitions and Assumptions
- 2. Executive Summary
- 2.1. Market Snapshot
- 3. Market Dynamics
- 3.1. Market Drivers
- 3.2. Market Restrains
- 3.3. Market Trends
- 3.4. Market Opportunities
- 4. Market Factor Analysis
- 4.1. Porters Five Forces
- 4.1.1. Bargaining Power of Suppliers
- 4.1.2. Bargaining Power of Buyers
- 4.1.3. Threat of New Entrants
- 4.1.4. Threat of Substitutes
- 4.1.5. Competitive Rivalry
- 4.2. PESTEL analysis
- 4.3. BCG Analysis
- 4.3.1. Stars (High Growth, High Market Share)
- 4.3.2. Cash Cows (Low Growth, High Market Share)
- 4.3.3. Question Mark (High Growth, Low Market Share)
- 4.3.4. Dogs (Low Growth, Low Market Share)
- 4.4. Ansoff Matrix Analysis
- 4.5. Supply Chain Analysis
- 4.6. Regulatory Landscape
- 4.7. Current Market Potential and Opportunity Assessment (TAM–SAM–SOM Framework)
- 4.8. MSR Analyst Note
- 4.1. Porters Five Forces
- 5. Market Analysis, Insights and Forecast 2021-2033
- 5.1. Market Analysis, Insights and Forecast - by Application
- 5.1.1. Consumer Electronics
- 5.1.2. Industrial Automation
- 5.1.3. Others
- 5.2. Market Analysis, Insights and Forecast - by Types
- 5.2.1. 1D dToF Sensor
- 5.2.2. 3D dToF Sensor
- 5.3. Market Analysis, Insights and Forecast - by Region
- 5.3.1. North America
- 5.3.2. South America
- 5.3.3. Europe
- 5.3.4. Middle East & Africa
- 5.3.5. Asia Pacific
- 5.1. Market Analysis, Insights and Forecast - by Application
- 6. Global SPAD Image Sensors Analysis, Insights and Forecast, 2021-2033
- 6.1. Market Analysis, Insights and Forecast - by Application
- 6.1.1. Consumer Electronics
- 6.1.2. Industrial Automation
- 6.1.3. Others
- 6.2. Market Analysis, Insights and Forecast - by Types
- 6.2.1. 1D dToF Sensor
- 6.2.2. 3D dToF Sensor
- 6.1. Market Analysis, Insights and Forecast - by Application
- 7. North America SPAD Image Sensors Analysis, Insights and Forecast, 2020-2032
- 7.1. Market Analysis, Insights and Forecast - by Application
- 7.1.1. Consumer Electronics
- 7.1.2. Industrial Automation
- 7.1.3. Others
- 7.2. Market Analysis, Insights and Forecast - by Types
- 7.2.1. 1D dToF Sensor
- 7.2.2. 3D dToF Sensor
- 7.1. Market Analysis, Insights and Forecast - by Application
- 8. South America SPAD Image Sensors Analysis, Insights and Forecast, 2020-2032
- 8.1. Market Analysis, Insights and Forecast - by Application
- 8.1.1. Consumer Electronics
- 8.1.2. Industrial Automation
- 8.1.3. Others
- 8.2. Market Analysis, Insights and Forecast - by Types
- 8.2.1. 1D dToF Sensor
- 8.2.2. 3D dToF Sensor
- 8.1. Market Analysis, Insights and Forecast - by Application
- 9. Europe SPAD Image Sensors Analysis, Insights and Forecast, 2020-2032
- 9.1. Market Analysis, Insights and Forecast - by Application
- 9.1.1. Consumer Electronics
- 9.1.2. Industrial Automation
- 9.1.3. Others
- 9.2. Market Analysis, Insights and Forecast - by Types
- 9.2.1. 1D dToF Sensor
- 9.2.2. 3D dToF Sensor
- 9.1. Market Analysis, Insights and Forecast - by Application
- 10. Middle East & Africa SPAD Image Sensors Analysis, Insights and Forecast, 2020-2032
- 10.1. Market Analysis, Insights and Forecast - by Application
- 10.1.1. Consumer Electronics
- 10.1.2. Industrial Automation
- 10.1.3. Others
- 10.2. Market Analysis, Insights and Forecast - by Types
- 10.2.1. 1D dToF Sensor
- 10.2.2. 3D dToF Sensor
- 10.1. Market Analysis, Insights and Forecast - by Application
- 11. Asia Pacific SPAD Image Sensors Analysis, Insights and Forecast, 2020-2032
- 11.1. Market Analysis, Insights and Forecast - by Application
- 11.1.1. Consumer Electronics
- 11.1.2. Industrial Automation
- 11.1.3. Others
- 11.2. Market Analysis, Insights and Forecast - by Types
- 11.2.1. 1D dToF Sensor
- 11.2.2. 3D dToF Sensor
- 11.1. Market Analysis, Insights and Forecast - by Application
- 12. Competitive Analysis
- 12.1. Company Profiles
- 12.1.1 ams OSRAM
- 12.1.1.1. Company Overview
- 12.1.1.2. Products
- 12.1.1.3. Company Financials
- 12.1.1.4. SWOT Analysis
- 12.1.2 Sony
- 12.1.2.1. Company Overview
- 12.1.2.2. Products
- 12.1.2.3. Company Financials
- 12.1.2.4. SWOT Analysis
- 12.1.3 Canon
- 12.1.3.1. Company Overview
- 12.1.3.2. Products
- 12.1.3.3. Company Financials
- 12.1.3.4. SWOT Analysis
- 12.1.4 visionICs
- 12.1.4.1. Company Overview
- 12.1.4.2. Products
- 12.1.4.3. Company Financials
- 12.1.4.4. SWOT Analysis
- 12.1.5 Adaps Photonics
- 12.1.5.1. Company Overview
- 12.1.5.2. Products
- 12.1.5.3. Company Financials
- 12.1.5.4. SWOT Analysis
- 12.1.1 ams OSRAM
- 12.2. Market Entropy
- 12.2.1 Company's Key Areas Served
- 12.2.2 Recent Developments
- 12.3. Company Market Share Analysis 2025
- 12.3.1 Top 5 Companies Market Share Analysis
- 12.3.2 Top 3 Companies Market Share Analysis
- 12.4. List of Potential Customers
- 13. Research Methodology
List of Figures
- Figure 1: Global SPAD Image Sensors Revenue Breakdown (million, %) by Region 2025 & 2033
- Figure 2: Global SPAD Image Sensors Volume Breakdown (K, %) by Region 2025 & 2033
- Figure 3: North America SPAD Image Sensors Revenue (million), by Application 2025 & 2033
- Figure 4: North America SPAD Image Sensors Volume (K), by Application 2025 & 2033
- Figure 5: North America SPAD Image Sensors Revenue Share (%), by Application 2025 & 2033
- Figure 6: North America SPAD Image Sensors Volume Share (%), by Application 2025 & 2033
- Figure 7: North America SPAD Image Sensors Revenue (million), by Types 2025 & 2033
- Figure 8: North America SPAD Image Sensors Volume (K), by Types 2025 & 2033
- Figure 9: North America SPAD Image Sensors Revenue Share (%), by Types 2025 & 2033
- Figure 10: North America SPAD Image Sensors Volume Share (%), by Types 2025 & 2033
- Figure 11: North America SPAD Image Sensors Revenue (million), by Country 2025 & 2033
- Figure 12: North America SPAD Image Sensors Volume (K), by Country 2025 & 2033
- Figure 13: North America SPAD Image Sensors Revenue Share (%), by Country 2025 & 2033
- Figure 14: North America SPAD Image Sensors Volume Share (%), by Country 2025 & 2033
- Figure 15: South America SPAD Image Sensors Revenue (million), by Application 2025 & 2033
- Figure 16: South America SPAD Image Sensors Volume (K), by Application 2025 & 2033
- Figure 17: South America SPAD Image Sensors Revenue Share (%), by Application 2025 & 2033
- Figure 18: South America SPAD Image Sensors Volume Share (%), by Application 2025 & 2033
- Figure 19: South America SPAD Image Sensors Revenue (million), by Types 2025 & 2033
- Figure 20: South America SPAD Image Sensors Volume (K), by Types 2025 & 2033
- Figure 21: South America SPAD Image Sensors Revenue Share (%), by Types 2025 & 2033
- Figure 22: South America SPAD Image Sensors Volume Share (%), by Types 2025 & 2033
- Figure 23: South America SPAD Image Sensors Revenue (million), by Country 2025 & 2033
- Figure 24: South America SPAD Image Sensors Volume (K), by Country 2025 & 2033
- Figure 25: South America SPAD Image Sensors Revenue Share (%), by Country 2025 & 2033
- Figure 26: South America SPAD Image Sensors Volume Share (%), by Country 2025 & 2033
- Figure 27: Europe SPAD Image Sensors Revenue (million), by Application 2025 & 2033
- Figure 28: Europe SPAD Image Sensors Volume (K), by Application 2025 & 2033
- Figure 29: Europe SPAD Image Sensors Revenue Share (%), by Application 2025 & 2033
- Figure 30: Europe SPAD Image Sensors Volume Share (%), by Application 2025 & 2033
- Figure 31: Europe SPAD Image Sensors Revenue (million), by Types 2025 & 2033
- Figure 32: Europe SPAD Image Sensors Volume (K), by Types 2025 & 2033
- Figure 33: Europe SPAD Image Sensors Revenue Share (%), by Types 2025 & 2033
- Figure 34: Europe SPAD Image Sensors Volume Share (%), by Types 2025 & 2033
- Figure 35: Europe SPAD Image Sensors Revenue (million), by Country 2025 & 2033
- Figure 36: Europe SPAD Image Sensors Volume (K), by Country 2025 & 2033
- Figure 37: Europe SPAD Image Sensors Revenue Share (%), by Country 2025 & 2033
- Figure 38: Europe SPAD Image Sensors Volume Share (%), by Country 2025 & 2033
- Figure 39: Middle East & Africa SPAD Image Sensors Revenue (million), by Application 2025 & 2033
- Figure 40: Middle East & Africa SPAD Image Sensors Volume (K), by Application 2025 & 2033
- Figure 41: Middle East & Africa SPAD Image Sensors Revenue Share (%), by Application 2025 & 2033
- Figure 42: Middle East & Africa SPAD Image Sensors Volume Share (%), by Application 2025 & 2033
- Figure 43: Middle East & Africa SPAD Image Sensors Revenue (million), by Types 2025 & 2033
- Figure 44: Middle East & Africa SPAD Image Sensors Volume (K), by Types 2025 & 2033
- Figure 45: Middle East & Africa SPAD Image Sensors Revenue Share (%), by Types 2025 & 2033
- Figure 46: Middle East & Africa SPAD Image Sensors Volume Share (%), by Types 2025 & 2033
- Figure 47: Middle East & Africa SPAD Image Sensors Revenue (million), by Country 2025 & 2033
- Figure 48: Middle East & Africa SPAD Image Sensors Volume (K), by Country 2025 & 2033
- Figure 49: Middle East & Africa SPAD Image Sensors Revenue Share (%), by Country 2025 & 2033
- Figure 50: Middle East & Africa SPAD Image Sensors Volume Share (%), by Country 2025 & 2033
- Figure 51: Asia Pacific SPAD Image Sensors Revenue (million), by Application 2025 & 2033
- Figure 52: Asia Pacific SPAD Image Sensors Volume (K), by Application 2025 & 2033
- Figure 53: Asia Pacific SPAD Image Sensors Revenue Share (%), by Application 2025 & 2033
- Figure 54: Asia Pacific SPAD Image Sensors Volume Share (%), by Application 2025 & 2033
- Figure 55: Asia Pacific SPAD Image Sensors Revenue (million), by Types 2025 & 2033
- Figure 56: Asia Pacific SPAD Image Sensors Volume (K), by Types 2025 & 2033
- Figure 57: Asia Pacific SPAD Image Sensors Revenue Share (%), by Types 2025 & 2033
- Figure 58: Asia Pacific SPAD Image Sensors Volume Share (%), by Types 2025 & 2033
- Figure 59: Asia Pacific SPAD Image Sensors Revenue (million), by Country 2025 & 2033
- Figure 60: Asia Pacific SPAD Image Sensors Volume (K), by Country 2025 & 2033
- Figure 61: Asia Pacific SPAD Image Sensors Revenue Share (%), by Country 2025 & 2033
- Figure 62: Asia Pacific SPAD Image Sensors Volume Share (%), by Country 2025 & 2033
List of Tables
- Table 1: Global SPAD Image Sensors Revenue million Forecast, by Application 2020 & 2033
- Table 2: Global SPAD Image Sensors Volume K Forecast, by Application 2020 & 2033
- Table 3: Global SPAD Image Sensors Revenue million Forecast, by Types 2020 & 2033
- Table 4: Global SPAD Image Sensors Volume K Forecast, by Types 2020 & 2033
- Table 5: Global SPAD Image Sensors Revenue million Forecast, by Region 2020 & 2033
- Table 6: Global SPAD Image Sensors Volume K Forecast, by Region 2020 & 2033
- Table 7: Global SPAD Image Sensors Revenue million Forecast, by Application 2020 & 2033
- Table 8: Global SPAD Image Sensors Volume K Forecast, by Application 2020 & 2033
- Table 9: Global SPAD Image Sensors Revenue million Forecast, by Types 2020 & 2033
- Table 10: Global SPAD Image Sensors Volume K Forecast, by Types 2020 & 2033
- Table 11: Global SPAD Image Sensors Revenue million Forecast, by Country 2020 & 2033
- Table 12: Global SPAD Image Sensors Volume K Forecast, by Country 2020 & 2033
- Table 13: United States SPAD Image Sensors Revenue (million) Forecast, by Application 2020 & 2033
- Table 14: United States SPAD Image Sensors Volume (K) Forecast, by Application 2020 & 2033
- Table 15: Canada SPAD Image Sensors Revenue (million) Forecast, by Application 2020 & 2033
- Table 16: Canada SPAD Image Sensors Volume (K) Forecast, by Application 2020 & 2033
- Table 17: Mexico SPAD Image Sensors Revenue (million) Forecast, by Application 2020 & 2033
- Table 18: Mexico SPAD Image Sensors Volume (K) Forecast, by Application 2020 & 2033
- Table 19: Global SPAD Image Sensors Revenue million Forecast, by Application 2020 & 2033
- Table 20: Global SPAD Image Sensors Volume K Forecast, by Application 2020 & 2033
- Table 21: Global SPAD Image Sensors Revenue million Forecast, by Types 2020 & 2033
- Table 22: Global SPAD Image Sensors Volume K Forecast, by Types 2020 & 2033
- Table 23: Global SPAD Image Sensors Revenue million Forecast, by Country 2020 & 2033
- Table 24: Global SPAD Image Sensors Volume K Forecast, by Country 2020 & 2033
- Table 25: Brazil SPAD Image Sensors Revenue (million) Forecast, by Application 2020 & 2033
- Table 26: Brazil SPAD Image Sensors Volume (K) Forecast, by Application 2020 & 2033
- Table 27: Argentina SPAD Image Sensors Revenue (million) Forecast, by Application 2020 & 2033
- Table 28: Argentina SPAD Image Sensors Volume (K) Forecast, by Application 2020 & 2033
- Table 29: Rest of South America SPAD Image Sensors Revenue (million) Forecast, by Application 2020 & 2033
- Table 30: Rest of South America SPAD Image Sensors Volume (K) Forecast, by Application 2020 & 2033
- Table 31: Global SPAD Image Sensors Revenue million Forecast, by Application 2020 & 2033
- Table 32: Global SPAD Image Sensors Volume K Forecast, by Application 2020 & 2033
- Table 33: Global SPAD Image Sensors Revenue million Forecast, by Types 2020 & 2033
- Table 34: Global SPAD Image Sensors Volume K Forecast, by Types 2020 & 2033
- Table 35: Global SPAD Image Sensors Revenue million Forecast, by Country 2020 & 2033
- Table 36: Global SPAD Image Sensors Volume K Forecast, by Country 2020 & 2033
- Table 37: United Kingdom SPAD Image Sensors Revenue (million) Forecast, by Application 2020 & 2033
- Table 38: United Kingdom SPAD Image Sensors Volume (K) Forecast, by Application 2020 & 2033
- Table 39: Germany SPAD Image Sensors Revenue (million) Forecast, by Application 2020 & 2033
- Table 40: Germany SPAD Image Sensors Volume (K) Forecast, by Application 2020 & 2033
- Table 41: France SPAD Image Sensors Revenue (million) Forecast, by Application 2020 & 2033
- Table 42: France SPAD Image Sensors Volume (K) Forecast, by Application 2020 & 2033
- Table 43: Italy SPAD Image Sensors Revenue (million) Forecast, by Application 2020 & 2033
- Table 44: Italy SPAD Image Sensors Volume (K) Forecast, by Application 2020 & 2033
- Table 45: Spain SPAD Image Sensors Revenue (million) Forecast, by Application 2020 & 2033
- Table 46: Spain SPAD Image Sensors Volume (K) Forecast, by Application 2020 & 2033
- Table 47: Russia SPAD Image Sensors Revenue (million) Forecast, by Application 2020 & 2033
- Table 48: Russia SPAD Image Sensors Volume (K) Forecast, by Application 2020 & 2033
- Table 49: Benelux SPAD Image Sensors Revenue (million) Forecast, by Application 2020 & 2033
- Table 50: Benelux SPAD Image Sensors Volume (K) Forecast, by Application 2020 & 2033
- Table 51: Nordics SPAD Image Sensors Revenue (million) Forecast, by Application 2020 & 2033
- Table 52: Nordics SPAD Image Sensors Volume (K) Forecast, by Application 2020 & 2033
- Table 53: Rest of Europe SPAD Image Sensors Revenue (million) Forecast, by Application 2020 & 2033
- Table 54: Rest of Europe SPAD Image Sensors Volume (K) Forecast, by Application 2020 & 2033
- Table 55: Global SPAD Image Sensors Revenue million Forecast, by Application 2020 & 2033
- Table 56: Global SPAD Image Sensors Volume K Forecast, by Application 2020 & 2033
- Table 57: Global SPAD Image Sensors Revenue million Forecast, by Types 2020 & 2033
- Table 58: Global SPAD Image Sensors Volume K Forecast, by Types 2020 & 2033
- Table 59: Global SPAD Image Sensors Revenue million Forecast, by Country 2020 & 2033
- Table 60: Global SPAD Image Sensors Volume K Forecast, by Country 2020 & 2033
- Table 61: Turkey SPAD Image Sensors Revenue (million) Forecast, by Application 2020 & 2033
- Table 62: Turkey SPAD Image Sensors Volume (K) Forecast, by Application 2020 & 2033
- Table 63: Israel SPAD Image Sensors Revenue (million) Forecast, by Application 2020 & 2033
- Table 64: Israel SPAD Image Sensors Volume (K) Forecast, by Application 2020 & 2033
- Table 65: GCC SPAD Image Sensors Revenue (million) Forecast, by Application 2020 & 2033
- Table 66: GCC SPAD Image Sensors Volume (K) Forecast, by Application 2020 & 2033
- Table 67: North Africa SPAD Image Sensors Revenue (million) Forecast, by Application 2020 & 2033
- Table 68: North Africa SPAD Image Sensors Volume (K) Forecast, by Application 2020 & 2033
- Table 69: South Africa SPAD Image Sensors Revenue (million) Forecast, by Application 2020 & 2033
- Table 70: South Africa SPAD Image Sensors Volume (K) Forecast, by Application 2020 & 2033
- Table 71: Rest of Middle East & Africa SPAD Image Sensors Revenue (million) Forecast, by Application 2020 & 2033
- Table 72: Rest of Middle East & Africa SPAD Image Sensors Volume (K) Forecast, by Application 2020 & 2033
- Table 73: Global SPAD Image Sensors Revenue million Forecast, by Application 2020 & 2033
- Table 74: Global SPAD Image Sensors Volume K Forecast, by Application 2020 & 2033
- Table 75: Global SPAD Image Sensors Revenue million Forecast, by Types 2020 & 2033
- Table 76: Global SPAD Image Sensors Volume K Forecast, by Types 2020 & 2033
- Table 77: Global SPAD Image Sensors Revenue million Forecast, by Country 2020 & 2033
- Table 78: Global SPAD Image Sensors Volume K Forecast, by Country 2020 & 2033
- Table 79: China SPAD Image Sensors Revenue (million) Forecast, by Application 2020 & 2033
- Table 80: China SPAD Image Sensors Volume (K) Forecast, by Application 2020 & 2033
- Table 81: India SPAD Image Sensors Revenue (million) Forecast, by Application 2020 & 2033
- Table 82: India SPAD Image Sensors Volume (K) Forecast, by Application 2020 & 2033
- Table 83: Japan SPAD Image Sensors Revenue (million) Forecast, by Application 2020 & 2033
- Table 84: Japan SPAD Image Sensors Volume (K) Forecast, by Application 2020 & 2033
- Table 85: South Korea SPAD Image Sensors Revenue (million) Forecast, by Application 2020 & 2033
- Table 86: South Korea SPAD Image Sensors Volume (K) Forecast, by Application 2020 & 2033
- Table 87: ASEAN SPAD Image Sensors Revenue (million) Forecast, by Application 2020 & 2033
- Table 88: ASEAN SPAD Image Sensors Volume (K) Forecast, by Application 2020 & 2033
- Table 89: Oceania SPAD Image Sensors Revenue (million) Forecast, by Application 2020 & 2033
- Table 90: Oceania SPAD Image Sensors Volume (K) Forecast, by Application 2020 & 2033
- Table 91: Rest of Asia Pacific SPAD Image Sensors Revenue (million) Forecast, by Application 2020 & 2033
- Table 92: Rest of Asia Pacific SPAD Image Sensors Volume (K) Forecast, by Application 2020 & 2033
Frequently Asked Questions
1. What is the projected Compound Annual Growth Rate (CAGR) of the SPAD Image Sensors?
The projected CAGR is approximately XX%.
2. Which companies are prominent players in the SPAD Image Sensors?
Key companies in the market include ams OSRAM, Sony, Canon, visionICs, Adaps Photonics.
3. What are the main segments of the SPAD Image Sensors?
The market segments include Application, Types.
4. Can you provide details about the market size?
The market size is estimated to be USD XXX million as of 2022.
5. What are some drivers contributing to market growth?
N/A
6. What are the notable trends driving market growth?
N/A
7. Are there any restraints impacting market growth?
N/A
8. Can you provide examples of recent developments in the market?
N/A
9. What pricing options are available for accessing the report?
Pricing options include single-user, multi-user, and enterprise licenses priced at USD 3950.00, USD 5925.00, and USD 7900.00 respectively.
10. Is the market size provided in terms of value or volume?
The market size is provided in terms of value, measured in million and volume, measured in K.
11. Are there any specific market keywords associated with the report?
Yes, the market keyword associated with the report is "SPAD Image Sensors," which aids in identifying and referencing the specific market segment covered.
12. How do I determine which pricing option suits my needs best?
The pricing options vary based on user requirements and access needs. Individual users may opt for single-user licenses, while businesses requiring broader access may choose multi-user or enterprise licenses for cost-effective access to the report.
13. Are there any additional resources or data provided in the SPAD Image Sensors report?
While the report offers comprehensive insights, it's advisable to review the specific contents or supplementary materials provided to ascertain if additional resources or data are available.
14. How can I stay updated on further developments or reports in the SPAD Image Sensors?
To stay informed about further developments, trends, and reports in the SPAD Image Sensors, consider subscribing to industry newsletters, following relevant companies and organizations, or regularly checking reputable industry news sources and publications.
Methodology
Step 1 - Identification of Relevant Samples Size from Population Database


Step 2 - Approaches for Defining Global Market Size (Value, Volume* & Price*)

Note*: In applicable scenarios
Step 3 - Data Sources
Primary Research
- Web Analytics
- Survey Reports
- Research Institute
- Latest Research Reports
- Opinion Leaders
Secondary Research
- Annual Reports
- White Paper
- Latest Press Release
- Industry Association
- Paid Database
- Investor Presentations

Step 4 - Data Triangulation
Involves using different sources of information in order to increase the validity of a study
These sources are likely to be stakeholders in a program - participants, other researchers, program staff, other community members, and so on.
Then we put all data in single framework & apply various statistical tools to find out the dynamic on the market.
During the analysis stage, feedback from the stakeholder groups would be compared to determine areas of agreement as well as areas of divergence