

Key Insights
The global Sparkling Drinks market is poised for significant expansion, demonstrating a robust CAGR of 7.7%. This growth trajectory is underpinned by a current market size of approximately USD 286.25 billion in 2023, with projections indicating continued upward momentum. A key driver for this surge is the escalating consumer preference for healthier and more natural beverage options. The demand for low-sugar and no-sugar alternatives, coupled with an increasing awareness of the potential health benefits associated with natural ingredients, is propelling the consumption of sparkling drinks. Furthermore, the innovative product development within the industry, including the introduction of diverse flavor profiles and functional benefits, is attracting a broader consumer base and fueling market penetration. The convenience and accessibility offered by both online and offline retail channels further contribute to this positive market outlook.
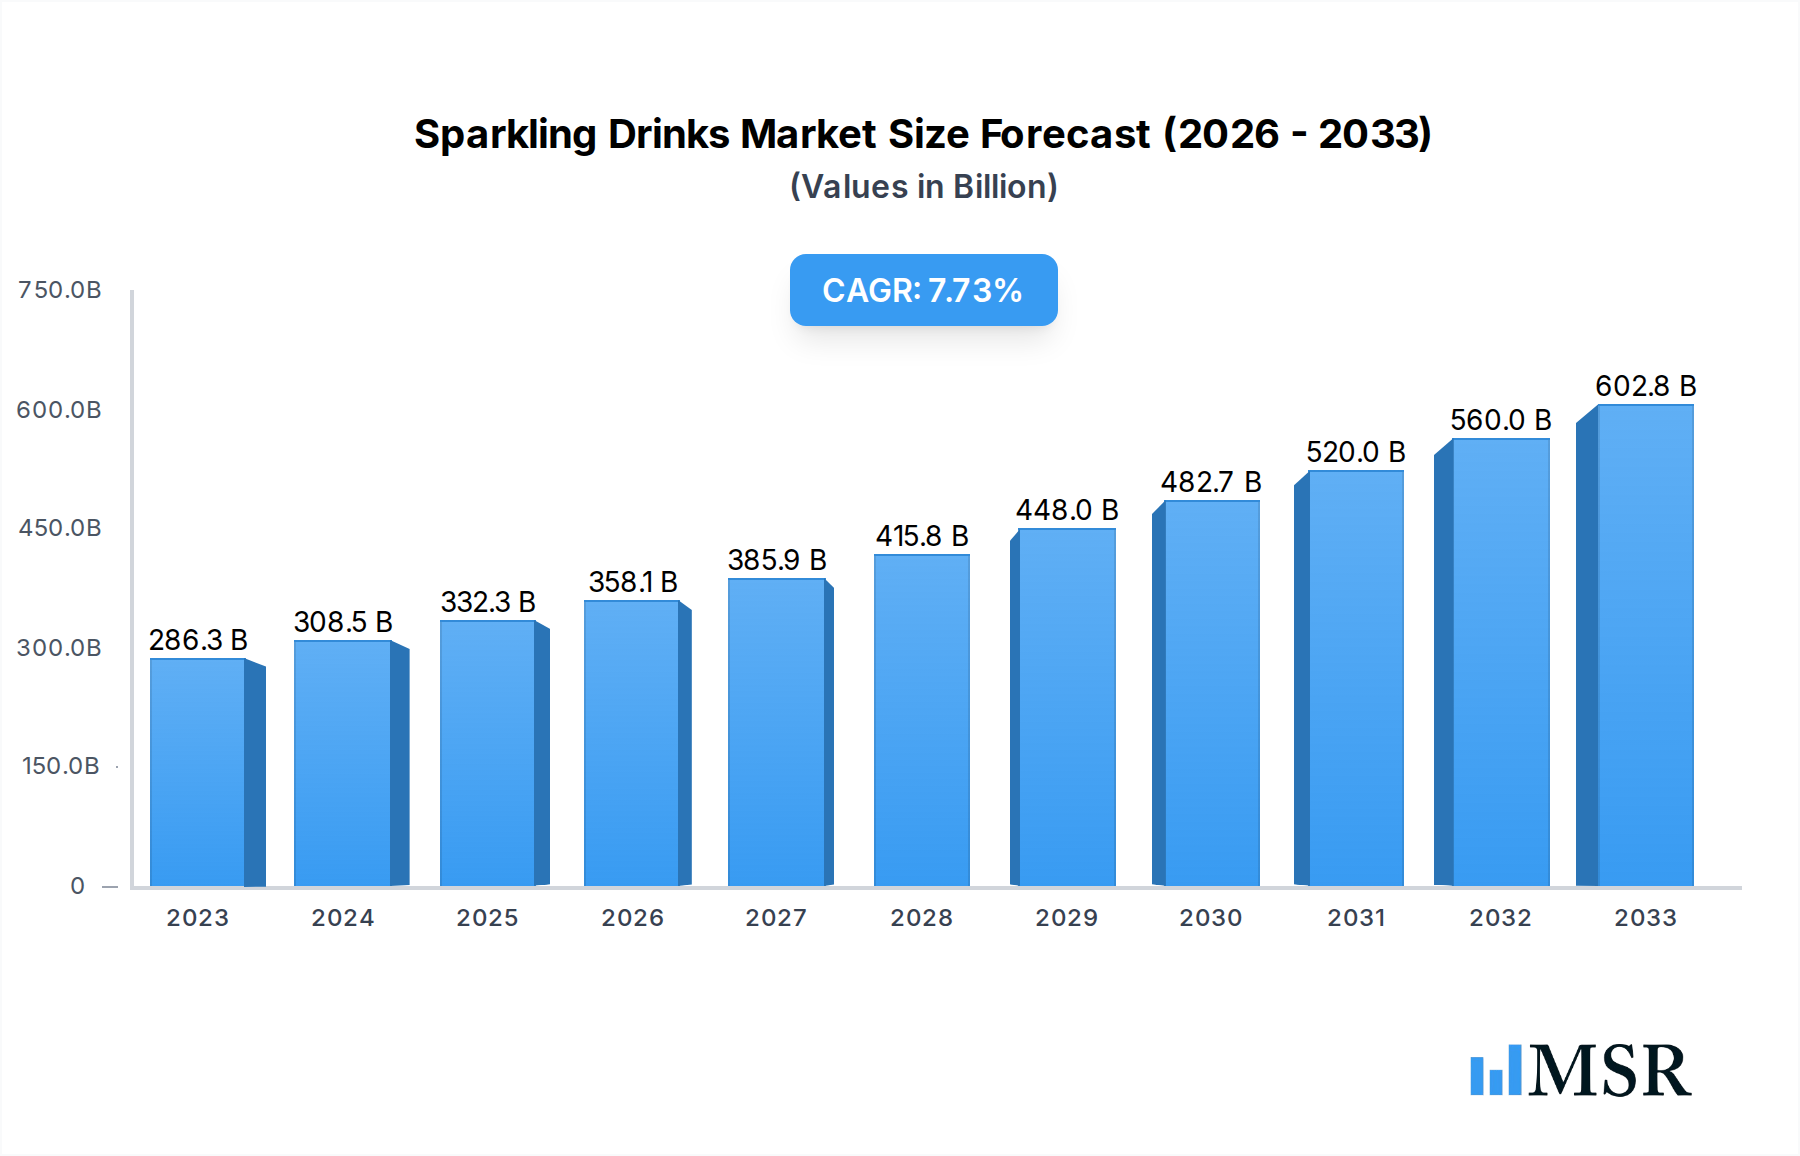
Sparkling Drinks Market Size (In Billion)
Emerging trends such as the rise of artisanal and craft sparkling water brands, alongside the integration of functional ingredients like adaptogens and probiotics, are shaping consumer choices and creating new market niches. These innovations cater to a sophisticated consumer looking for more than just refreshment. However, the market also faces certain restraints, including fluctuating raw material prices and intense competition from established beverage giants and new entrants. Regulatory landscapes concerning sugar content and labeling requirements in different regions can also pose challenges. Despite these hurdles, the expanding middle class in emerging economies, coupled with increasing disposable incomes and a growing adoption of Western lifestyle trends, presents substantial opportunities for market players. Strategic expansions into these untapped markets and continued investment in product innovation will be crucial for sustained growth.

Sparkling Drinks Company Market Share
Sparkling Drinks Market: Comprehensive Analysis 2019-2033
This in-depth market research report provides an exhaustive analysis of the global sparkling drinks market from 2019 to 2033, with a base year of 2025 and a forecast period spanning 2025-2033. Delving into critical aspects such as market concentration, industry trends, key regional and segmental performances, product innovations, challenges, growth drivers, opportunities, leading players, historical milestones, and strategic outlook, this report is an indispensable resource for industry stakeholders seeking to navigate the dynamic and rapidly expanding sparkling beverage landscape. The report is built on a foundation of robust data and expert analysis, offering actionable insights for manufacturers, distributors, investors, and other key players. The study encompasses a wide array of sparkling drinks, including Natural Sparkling Drinks and Organic Sparkling Drinks, and analyzes their presence across various applications like Offline Retail Stores, Online Retail Stores, and Restaurants.
Sparkling Drinks Market Concentration & Dynamics
The global sparkling drinks market exhibits a moderate to high level of concentration, characterized by the presence of a few dominant multinational corporations alongside a growing number of agile, niche players. Innovation ecosystems are thriving, driven by consumer demand for healthier and more sophisticated beverage options. Companies are investing heavily in research and development to create novel flavor profiles and functional benefits. Regulatory frameworks are evolving to address health claims and ingredient transparency, influencing product formulation and marketing strategies. Substitute products, including still beverages and other functional drinks, present a constant competitive pressure, forcing brands to continually differentiate themselves. End-user trends are strongly leaning towards convenience, health consciousness, and unique taste experiences. Mergers and acquisitions (M&A) activities remain a significant dynamic, with larger players acquiring smaller, innovative brands to expand their portfolios and market reach. For example, the historical period saw an estimated 20 billion USD in M&A deals, with an anticipated further 25 billion USD in the forecast period. Market share distribution shows that the top 5 players command approximately 65% of the global market revenue.
Sparkling Drinks Industry Insights & Trends
The sparkling drinks industry is experiencing robust growth, driven by a confluence of factors. The global market size is projected to reach an estimated 350 billion USD by 2025, with a projected Compound Annual Growth Rate (CAGR) of 6.8% during the forecast period (2025–2033). Key growth drivers include the escalating global demand for healthier beverage alternatives to traditional sodas, a rising disposable income in emerging economies, and an increasing awareness of the benefits associated with hydration and natural ingredients. Technological disruptions are playing a crucial role, with advancements in flavor encapsulation, natural sweetening agents, and functional ingredient integration enhancing product appeal and perceived health benefits. Evolving consumer behaviors are central to this growth trajectory; consumers are increasingly seeking low-sugar, low-calorie, and additive-free options, leading to a surge in demand for Natural Sparkling Drinks and Organic Sparkling Drinks. The premiumization trend is also evident, with consumers willing to pay more for artisanal, craft, and unique flavor experiences. Furthermore, the expansion of online retail channels has significantly broadened accessibility, allowing smaller brands to reach a wider consumer base. The influence of social media trends and influencer marketing further shapes consumer preferences, driving the adoption of innovative and visually appealing sparkling beverages. The focus on sustainability and eco-friendly packaging is also gaining traction, influencing purchasing decisions and prompting manufacturers to adopt more responsible production practices. The overall sentiment within the industry points towards sustained expansion fueled by innovation and alignment with evolving consumer health and lifestyle priorities.
Key Markets & Segments Leading Sparkling Drinks
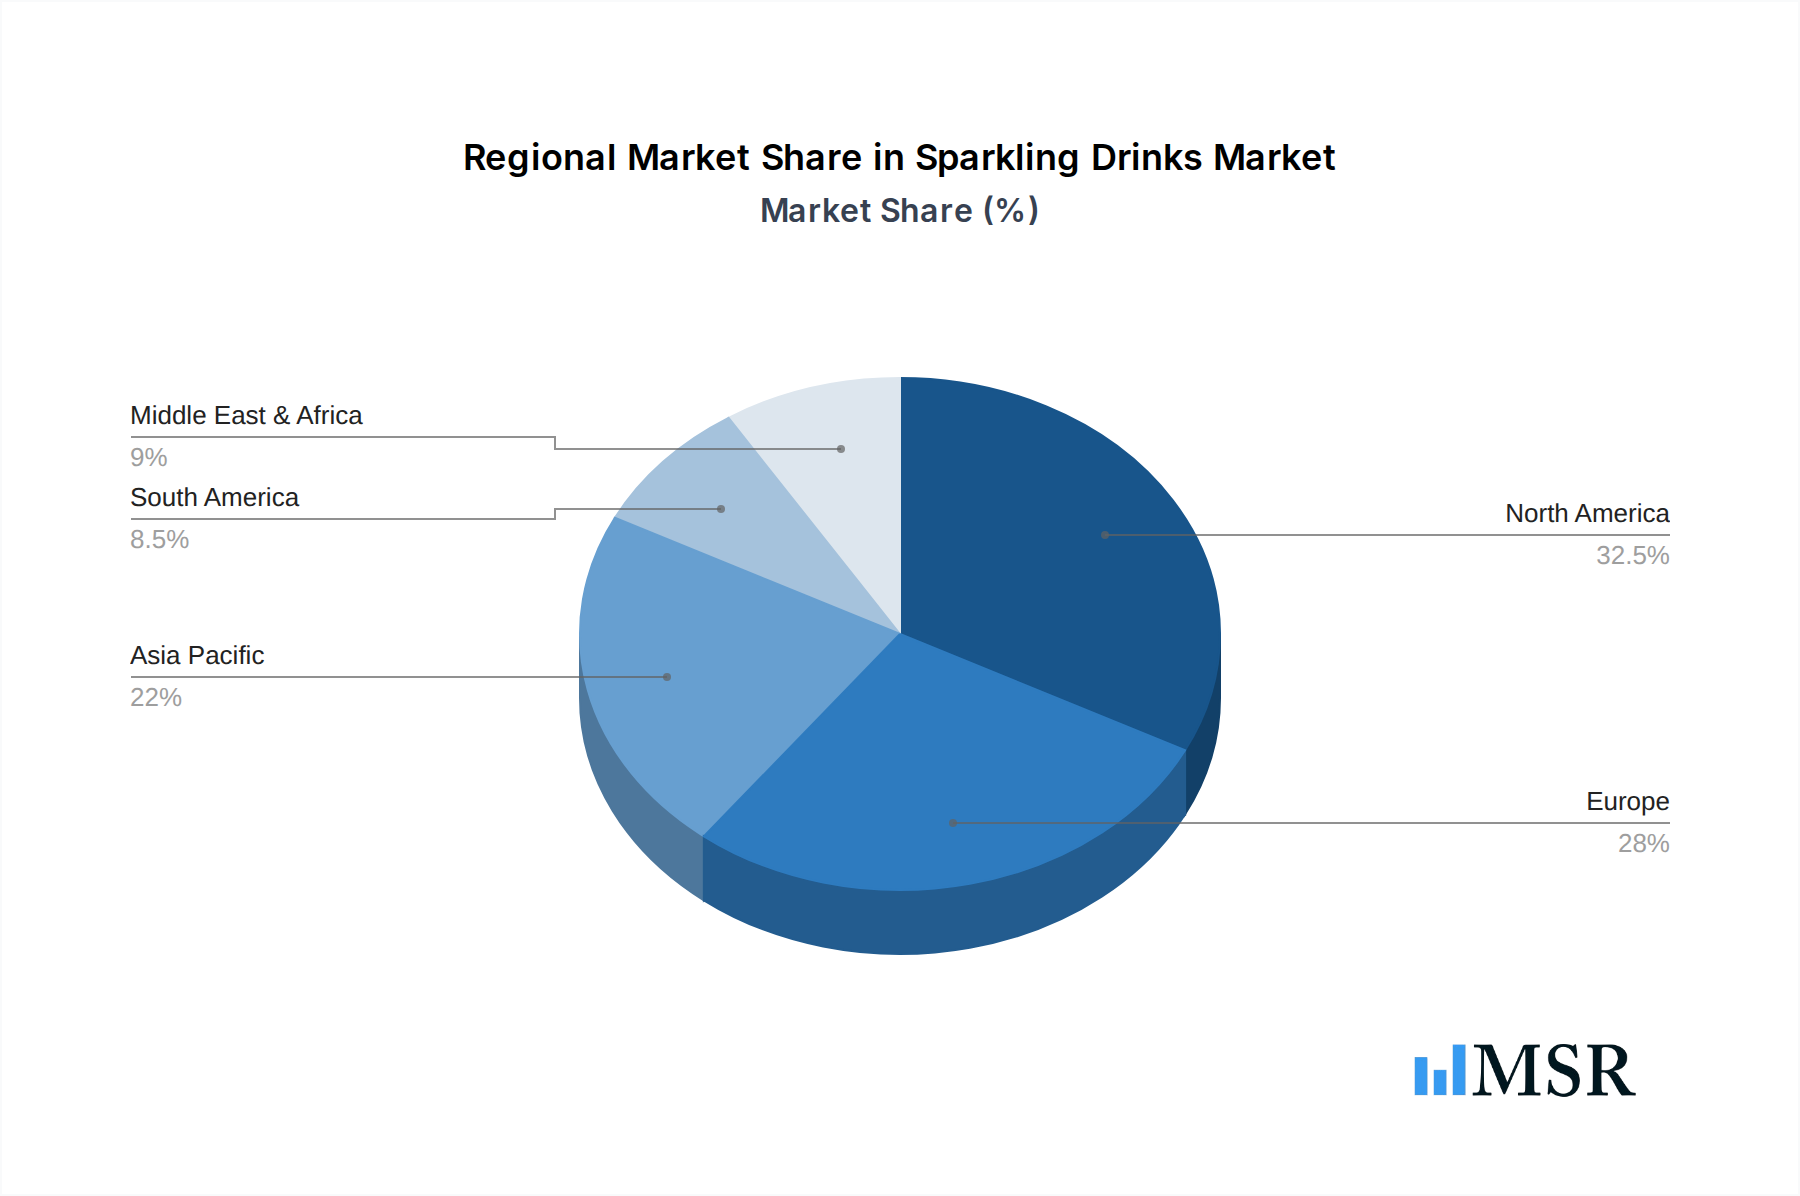
The sparkling drinks market's dominance varies across regions and segments, with distinct growth catalysts and consumer preferences shaping its trajectory. North America currently holds the largest market share, driven by a mature consumer base with a strong inclination towards health and wellness trends. The United States, in particular, is a powerhouse, fueled by widespread availability and a high adoption rate of both Natural Sparkling Drinks and Organic Sparkling Drinks.
Application Dominance:
- Offline Retail Stores: This segment remains the largest distribution channel, accounting for an estimated 70% of sales. Drivers include established brand presence, impulse purchase opportunities, and consumer familiarity. Supermarkets, hypermarkets, and convenience stores form the backbone of this channel, with robust infrastructure supporting widespread product availability.
- Online Retail Stores: This segment is experiencing rapid growth, projected to capture an additional 25% of the market by 2033. Key drivers are convenience, wider product selection, and competitive pricing. The increasing penetration of e-commerce platforms and the rise of direct-to-consumer (DTC) models are further accelerating this trend.
- Restaurant: This segment contributes a significant, albeit smaller, portion of the market share, estimated at 5%. Growth here is driven by the demand for premium and artisanal sparkling beverages as complements to dining experiences. The proliferation of diverse culinary offerings and a growing appreciation for beverage pairings are key factors.
- Other: This encompasses channels like vending machines and specialty stores, holding a negligible but growing share.
Types Dominance:
- Natural Sparkling Drinks: This category is experiencing phenomenal growth, driven by the consumer shift towards healthier alternatives. It accounts for approximately 75% of the total sparkling drinks market. Drivers include the absence of artificial sweeteners and flavors, perceived health benefits, and a preference for clean labels.
- Organic Sparkling Drinks: While a smaller segment, this is the fastest-growing category within the market, expected to see a CAGR of over 8% during the forecast period. Consumers are increasingly prioritizing organic certification, driven by concerns about pesticide use and environmental impact. This segment represents an estimated 25% of the total market and is projected to grow substantially.
The economic growth in developed nations, coupled with increasing disposable incomes in developing regions, provides a fertile ground for expansion. Furthermore, strong retail infrastructure and a well-established supply chain in key markets like the US, Canada, and Western Europe facilitate the widespread availability of these products. The rising popularity of functional beverages, incorporating vitamins, minerals, and adaptogens, further boosts the demand for both natural and organic variants.
Sparkling Drinks Product Developments
Product innovation in the sparkling drinks sector is rapid and diverse. Companies are focusing on developing beverages with enhanced functional benefits, such as added probiotics, vitamins, and adaptogens for stress relief and immune support. The exploration of novel, exotic, and botanical flavor profiles is a key trend, moving beyond traditional fruit flavors. Low- and no-sugar formulations remain a significant area of development, addressing health concerns. Furthermore, advancements in natural ingredient sourcing and extraction technologies are enabling the creation of more authentic and nuanced taste experiences. The emphasis on sustainable packaging, including recyclable materials and refillable options, is also gaining momentum.
Challenges in the Sparkling Drinks Market
The sparkling drinks market faces several challenges that could hinder its growth. Regulatory hurdles, particularly concerning health claims and labeling regulations in various regions, can impact product development and marketing. Supply chain complexities, including the sourcing of premium natural ingredients and managing distribution networks, can lead to increased costs and potential disruptions. Intense competitive pressures from both established beverage giants and emerging craft brands necessitate continuous innovation and aggressive marketing strategies. Fluctuations in raw material prices, especially for fruits and botanicals, can impact profit margins. Furthermore, evolving consumer preferences require constant adaptation and R&D investment to stay ahead of trends, making it challenging to predict and meet future demands.
Forces Driving Sparkling Drinks Growth
Several forces are propelling the growth of the sparkling drinks market. The paramount driver is the escalating global health and wellness trend, with consumers actively seeking low-sugar, low-calorie, and natural beverage alternatives. Technological advancements in flavor science and ingredient formulation enable the creation of innovative and appealing products. Increasing disposable incomes in emerging markets are expanding the consumer base for premium and functional beverages. Evolving distribution channels, particularly the rapid growth of online retail, have enhanced accessibility and convenience for consumers. A growing awareness of the benefits of hydration and functional ingredients further fuels demand for sparkling beverages that offer more than just refreshment.
Challenges in the Sparkling Drinks Market
Long-term growth catalysts for the sparkling drinks market lie in continuous product innovation, particularly in the realm of functional ingredients and unique flavor profiles. Strategic partnerships and collaborations between beverage companies, ingredient suppliers, and technology providers can unlock new market opportunities and accelerate product development. Market expansion into untapped geographical regions with growing middle classes and increasing demand for Western-style beverages presents significant potential. Furthermore, a strong focus on sustainability and ethical sourcing practices will become increasingly crucial for brand loyalty and market acceptance. Investing in direct-to-consumer (DTC) models and enhancing online retail presence will also be vital for sustained growth.
Emerging Opportunities in Sparkling Drinks
Emerging opportunities in the sparkling drinks market are abundant and diverse. The functional beverage segment, incorporating probiotics, adaptogens, and nootropics, is a rapidly growing niche with significant untapped potential. Plant-based and allergen-free formulations cater to a growing segment of health-conscious consumers. The demand for unique and exotic flavor combinations, inspired by global cuisines, presents a significant avenue for differentiation. Furthermore, the low- and zero-alcohol sparkling beverage category is gaining traction as consumers explore healthier social drinking options. Exploring sustainable packaging solutions and refillable models offers an opportunity to appeal to environmentally conscious consumers and reduce waste. Expansion into developing economies with rising disposable incomes and increasing exposure to global beverage trends also represents a substantial opportunity.
Leading Players in the Sparkling Drinks Sector
- Pepsico
- Welch Foods
- Ocean Spray
- Waterloo Sparkling Water
- Sapporo Group
- Seven Sparkling Water
- National Beverage Corporation
- Reed’s
- SIPP Eco Beverage
- Crooked Beverage
Key Milestones in Sparkling Drinks Industry
- 2019: Increased consumer interest in low-sugar and natural beverages gains significant traction.
- 2020: Pandemic accelerates the growth of online beverage sales and at-home consumption.
- 2021: Launch of numerous new functional sparkling water brands with added vitamins and botanicals.
- 2022: Growing emphasis on sustainable packaging and eco-friendly production methods.
- 2023: Increased M&A activity as larger players acquire innovative niche brands.
- 2024: Expansion of organic certified sparkling drink offerings in major markets.
- 2025 (Estimated): Continued strong growth driven by health and wellness trends and new product introductions.
- 2026-2033 (Forecast Period): Expected sustained growth with ongoing innovation in functional ingredients and flavor profiles.
Strategic Outlook for Sparkling Drinks Market
The strategic outlook for the sparkling drinks market remains exceptionally positive, characterized by sustained growth and an evolving consumer landscape. Future market potential will be significantly driven by continued innovation in functional ingredients and unique flavor experiences, catering to a health-conscious and adventurous consumer base. Companies that prioritize sustainability, ethical sourcing, and transparent labeling will likely build stronger brand loyalty and capture a larger market share. Strategic opportunities lie in expanding product portfolios to include a wider range of health benefits and dietary accommodations, such as low-FODMAP or allergen-free options. Investing in robust online retail strategies and direct-to-consumer channels will be crucial for reaching a broader audience and building direct relationships with consumers. Furthermore, strategic market entry into emerging economies with a growing middle class presents substantial long-term growth potential. The market is poised for continued expansion, fueled by consumer demand for healthier, more sophisticated, and ethically produced beverages.
Sparkling Drinks Segmentation
-
1. Application
- 1.1. Offline Retail Stores
- 1.2. Online Retail Stores
- 1.3. Restaurant
- 1.4. Other
-
2. Types
- 2.1. Natural Sparkling Drinks
- 2.2. Organic Sparkling Drinks
Sparkling Drinks Segmentation By Geography
-
1. North America
- 1.1. United States
- 1.2. Canada
- 1.3. Mexico
-
2. South America
- 2.1. Brazil
- 2.2. Argentina
- 2.3. Rest of South America
-
3. Europe
- 3.1. United Kingdom
- 3.2. Germany
- 3.3. France
- 3.4. Italy
- 3.5. Spain
- 3.6. Russia
- 3.7. Benelux
- 3.8. Nordics
- 3.9. Rest of Europe
-
4. Middle East & Africa
- 4.1. Turkey
- 4.2. Israel
- 4.3. GCC
- 4.4. North Africa
- 4.5. South Africa
- 4.6. Rest of Middle East & Africa
-
5. Asia Pacific
- 5.1. China
- 5.2. India
- 5.3. Japan
- 5.4. South Korea
- 5.5. ASEAN
- 5.6. Oceania
- 5.7. Rest of Asia Pacific
Sparkling Drinks Regional Market Share
Geographic Coverage of Sparkling Drinks
Sparkling Drinks REPORT HIGHLIGHTS
| Aspects | Details |
|---|---|
| Study Period | 2020-2034 |
| Base Year | 2025 |
| Estimated Year | 2026 |
| Forecast Period | 2026-2034 |
| Historical Period | 2020-2025 |
| Growth Rate | CAGR of 6.37% from 2020-2034 |
| Segmentation |
|
Table of Contents
- 1. Introduction
- 1.1. Research Scope
- 1.2. Market Segmentation
- 1.3. Research Objective
- 1.4. Definitions and Assumptions
- 2. Executive Summary
- 2.1. Market Snapshot
- 3. Market Dynamics
- 3.1. Market Drivers
- 3.2. Market Restrains
- 3.3. Market Trends
- 3.4. Market Opportunities
- 4. Market Factor Analysis
- 4.1. Porters Five Forces
- 4.1.1. Bargaining Power of Suppliers
- 4.1.2. Bargaining Power of Buyers
- 4.1.3. Threat of New Entrants
- 4.1.4. Threat of Substitutes
- 4.1.5. Competitive Rivalry
- 4.2. PESTEL analysis
- 4.3. BCG Analysis
- 4.3.1. Stars (High Growth, High Market Share)
- 4.3.2. Cash Cows (Low Growth, High Market Share)
- 4.3.3. Question Mark (High Growth, Low Market Share)
- 4.3.4. Dogs (Low Growth, Low Market Share)
- 4.4. Ansoff Matrix Analysis
- 4.5. Supply Chain Analysis
- 4.6. Regulatory Landscape
- 4.7. Current Market Potential and Opportunity Assessment (TAM–SAM–SOM Framework)
- 4.8. MSR Analyst Note
- 4.1. Porters Five Forces
- 5. Market Analysis, Insights and Forecast 2021-2033
- 5.1. Market Analysis, Insights and Forecast - by Application
- 5.1.1. Offline Retail Stores
- 5.1.2. Online Retail Stores
- 5.1.3. Restaurant
- 5.1.4. Other
- 5.2. Market Analysis, Insights and Forecast - by Types
- 5.2.1. Natural Sparkling Drinks
- 5.2.2. Organic Sparkling Drinks
- 5.3. Market Analysis, Insights and Forecast - by Region
- 5.3.1. North America
- 5.3.2. South America
- 5.3.3. Europe
- 5.3.4. Middle East & Africa
- 5.3.5. Asia Pacific
- 5.1. Market Analysis, Insights and Forecast - by Application
- 6. Global Sparkling Drinks Analysis, Insights and Forecast, 2021-2033
- 6.1. Market Analysis, Insights and Forecast - by Application
- 6.1.1. Offline Retail Stores
- 6.1.2. Online Retail Stores
- 6.1.3. Restaurant
- 6.1.4. Other
- 6.2. Market Analysis, Insights and Forecast - by Types
- 6.2.1. Natural Sparkling Drinks
- 6.2.2. Organic Sparkling Drinks
- 6.1. Market Analysis, Insights and Forecast - by Application
- 7. North America Sparkling Drinks Analysis, Insights and Forecast, 2020-2032
- 7.1. Market Analysis, Insights and Forecast - by Application
- 7.1.1. Offline Retail Stores
- 7.1.2. Online Retail Stores
- 7.1.3. Restaurant
- 7.1.4. Other
- 7.2. Market Analysis, Insights and Forecast - by Types
- 7.2.1. Natural Sparkling Drinks
- 7.2.2. Organic Sparkling Drinks
- 7.1. Market Analysis, Insights and Forecast - by Application
- 8. South America Sparkling Drinks Analysis, Insights and Forecast, 2020-2032
- 8.1. Market Analysis, Insights and Forecast - by Application
- 8.1.1. Offline Retail Stores
- 8.1.2. Online Retail Stores
- 8.1.3. Restaurant
- 8.1.4. Other
- 8.2. Market Analysis, Insights and Forecast - by Types
- 8.2.1. Natural Sparkling Drinks
- 8.2.2. Organic Sparkling Drinks
- 8.1. Market Analysis, Insights and Forecast - by Application
- 9. Europe Sparkling Drinks Analysis, Insights and Forecast, 2020-2032
- 9.1. Market Analysis, Insights and Forecast - by Application
- 9.1.1. Offline Retail Stores
- 9.1.2. Online Retail Stores
- 9.1.3. Restaurant
- 9.1.4. Other
- 9.2. Market Analysis, Insights and Forecast - by Types
- 9.2.1. Natural Sparkling Drinks
- 9.2.2. Organic Sparkling Drinks
- 9.1. Market Analysis, Insights and Forecast - by Application
- 10. Middle East & Africa Sparkling Drinks Analysis, Insights and Forecast, 2020-2032
- 10.1. Market Analysis, Insights and Forecast - by Application
- 10.1.1. Offline Retail Stores
- 10.1.2. Online Retail Stores
- 10.1.3. Restaurant
- 10.1.4. Other
- 10.2. Market Analysis, Insights and Forecast - by Types
- 10.2.1. Natural Sparkling Drinks
- 10.2.2. Organic Sparkling Drinks
- 10.1. Market Analysis, Insights and Forecast - by Application
- 11. Asia Pacific Sparkling Drinks Analysis, Insights and Forecast, 2020-2032
- 11.1. Market Analysis, Insights and Forecast - by Application
- 11.1.1. Offline Retail Stores
- 11.1.2. Online Retail Stores
- 11.1.3. Restaurant
- 11.1.4. Other
- 11.2. Market Analysis, Insights and Forecast - by Types
- 11.2.1. Natural Sparkling Drinks
- 11.2.2. Organic Sparkling Drinks
- 11.1. Market Analysis, Insights and Forecast - by Application
- 12. Competitive Analysis
- 12.1. Company Profiles
- 12.1.1 Pepsico
- 12.1.1.1. Company Overview
- 12.1.1.2. Products
- 12.1.1.3. Company Financials
- 12.1.1.4. SWOT Analysis
- 12.1.2 Welch Foods
- 12.1.2.1. Company Overview
- 12.1.2.2. Products
- 12.1.2.3. Company Financials
- 12.1.2.4. SWOT Analysis
- 12.1.3 Ocean Spray
- 12.1.3.1. Company Overview
- 12.1.3.2. Products
- 12.1.3.3. Company Financials
- 12.1.3.4. SWOT Analysis
- 12.1.4 Waterloo Sparkling Water
- 12.1.4.1. Company Overview
- 12.1.4.2. Products
- 12.1.4.3. Company Financials
- 12.1.4.4. SWOT Analysis
- 12.1.5 Sapporo Group
- 12.1.5.1. Company Overview
- 12.1.5.2. Products
- 12.1.5.3. Company Financials
- 12.1.5.4. SWOT Analysis
- 12.1.6 Seven Sparkling Water
- 12.1.6.1. Company Overview
- 12.1.6.2. Products
- 12.1.6.3. Company Financials
- 12.1.6.4. SWOT Analysis
- 12.1.7 National Beverage Corporation
- 12.1.7.1. Company Overview
- 12.1.7.2. Products
- 12.1.7.3. Company Financials
- 12.1.7.4. SWOT Analysis
- 12.1.8 Reed’s
- 12.1.8.1. Company Overview
- 12.1.8.2. Products
- 12.1.8.3. Company Financials
- 12.1.8.4. SWOT Analysis
- 12.1.9 SIPP Eco Beverage
- 12.1.9.1. Company Overview
- 12.1.9.2. Products
- 12.1.9.3. Company Financials
- 12.1.9.4. SWOT Analysis
- 12.1.10 Crooked Beverage
- 12.1.10.1. Company Overview
- 12.1.10.2. Products
- 12.1.10.3. Company Financials
- 12.1.10.4. SWOT Analysis
- 12.1.1 Pepsico
- 12.2. Market Entropy
- 12.2.1 Company's Key Areas Served
- 12.2.2 Recent Developments
- 12.3. Company Market Share Analysis 2025
- 12.3.1 Top 5 Companies Market Share Analysis
- 12.3.2 Top 3 Companies Market Share Analysis
- 12.4. List of Potential Customers
- 13. Research Methodology
List of Figures
- Figure 1: Global Sparkling Drinks Revenue Breakdown (million, %) by Region 2025 & 2033
- Figure 2: Global Sparkling Drinks Volume Breakdown (K, %) by Region 2025 & 2033
- Figure 3: North America Sparkling Drinks Revenue (million), by Application 2025 & 2033
- Figure 4: North America Sparkling Drinks Volume (K), by Application 2025 & 2033
- Figure 5: North America Sparkling Drinks Revenue Share (%), by Application 2025 & 2033
- Figure 6: North America Sparkling Drinks Volume Share (%), by Application 2025 & 2033
- Figure 7: North America Sparkling Drinks Revenue (million), by Types 2025 & 2033
- Figure 8: North America Sparkling Drinks Volume (K), by Types 2025 & 2033
- Figure 9: North America Sparkling Drinks Revenue Share (%), by Types 2025 & 2033
- Figure 10: North America Sparkling Drinks Volume Share (%), by Types 2025 & 2033
- Figure 11: North America Sparkling Drinks Revenue (million), by Country 2025 & 2033
- Figure 12: North America Sparkling Drinks Volume (K), by Country 2025 & 2033
- Figure 13: North America Sparkling Drinks Revenue Share (%), by Country 2025 & 2033
- Figure 14: North America Sparkling Drinks Volume Share (%), by Country 2025 & 2033
- Figure 15: South America Sparkling Drinks Revenue (million), by Application 2025 & 2033
- Figure 16: South America Sparkling Drinks Volume (K), by Application 2025 & 2033
- Figure 17: South America Sparkling Drinks Revenue Share (%), by Application 2025 & 2033
- Figure 18: South America Sparkling Drinks Volume Share (%), by Application 2025 & 2033
- Figure 19: South America Sparkling Drinks Revenue (million), by Types 2025 & 2033
- Figure 20: South America Sparkling Drinks Volume (K), by Types 2025 & 2033
- Figure 21: South America Sparkling Drinks Revenue Share (%), by Types 2025 & 2033
- Figure 22: South America Sparkling Drinks Volume Share (%), by Types 2025 & 2033
- Figure 23: South America Sparkling Drinks Revenue (million), by Country 2025 & 2033
- Figure 24: South America Sparkling Drinks Volume (K), by Country 2025 & 2033
- Figure 25: South America Sparkling Drinks Revenue Share (%), by Country 2025 & 2033
- Figure 26: South America Sparkling Drinks Volume Share (%), by Country 2025 & 2033
- Figure 27: Europe Sparkling Drinks Revenue (million), by Application 2025 & 2033
- Figure 28: Europe Sparkling Drinks Volume (K), by Application 2025 & 2033
- Figure 29: Europe Sparkling Drinks Revenue Share (%), by Application 2025 & 2033
- Figure 30: Europe Sparkling Drinks Volume Share (%), by Application 2025 & 2033
- Figure 31: Europe Sparkling Drinks Revenue (million), by Types 2025 & 2033
- Figure 32: Europe Sparkling Drinks Volume (K), by Types 2025 & 2033
- Figure 33: Europe Sparkling Drinks Revenue Share (%), by Types 2025 & 2033
- Figure 34: Europe Sparkling Drinks Volume Share (%), by Types 2025 & 2033
- Figure 35: Europe Sparkling Drinks Revenue (million), by Country 2025 & 2033
- Figure 36: Europe Sparkling Drinks Volume (K), by Country 2025 & 2033
- Figure 37: Europe Sparkling Drinks Revenue Share (%), by Country 2025 & 2033
- Figure 38: Europe Sparkling Drinks Volume Share (%), by Country 2025 & 2033
- Figure 39: Middle East & Africa Sparkling Drinks Revenue (million), by Application 2025 & 2033
- Figure 40: Middle East & Africa Sparkling Drinks Volume (K), by Application 2025 & 2033
- Figure 41: Middle East & Africa Sparkling Drinks Revenue Share (%), by Application 2025 & 2033
- Figure 42: Middle East & Africa Sparkling Drinks Volume Share (%), by Application 2025 & 2033
- Figure 43: Middle East & Africa Sparkling Drinks Revenue (million), by Types 2025 & 2033
- Figure 44: Middle East & Africa Sparkling Drinks Volume (K), by Types 2025 & 2033
- Figure 45: Middle East & Africa Sparkling Drinks Revenue Share (%), by Types 2025 & 2033
- Figure 46: Middle East & Africa Sparkling Drinks Volume Share (%), by Types 2025 & 2033
- Figure 47: Middle East & Africa Sparkling Drinks Revenue (million), by Country 2025 & 2033
- Figure 48: Middle East & Africa Sparkling Drinks Volume (K), by Country 2025 & 2033
- Figure 49: Middle East & Africa Sparkling Drinks Revenue Share (%), by Country 2025 & 2033
- Figure 50: Middle East & Africa Sparkling Drinks Volume Share (%), by Country 2025 & 2033
- Figure 51: Asia Pacific Sparkling Drinks Revenue (million), by Application 2025 & 2033
- Figure 52: Asia Pacific Sparkling Drinks Volume (K), by Application 2025 & 2033
- Figure 53: Asia Pacific Sparkling Drinks Revenue Share (%), by Application 2025 & 2033
- Figure 54: Asia Pacific Sparkling Drinks Volume Share (%), by Application 2025 & 2033
- Figure 55: Asia Pacific Sparkling Drinks Revenue (million), by Types 2025 & 2033
- Figure 56: Asia Pacific Sparkling Drinks Volume (K), by Types 2025 & 2033
- Figure 57: Asia Pacific Sparkling Drinks Revenue Share (%), by Types 2025 & 2033
- Figure 58: Asia Pacific Sparkling Drinks Volume Share (%), by Types 2025 & 2033
- Figure 59: Asia Pacific Sparkling Drinks Revenue (million), by Country 2025 & 2033
- Figure 60: Asia Pacific Sparkling Drinks Volume (K), by Country 2025 & 2033
- Figure 61: Asia Pacific Sparkling Drinks Revenue Share (%), by Country 2025 & 2033
- Figure 62: Asia Pacific Sparkling Drinks Volume Share (%), by Country 2025 & 2033
List of Tables
- Table 1: Global Sparkling Drinks Revenue million Forecast, by Application 2020 & 2033
- Table 2: Global Sparkling Drinks Volume K Forecast, by Application 2020 & 2033
- Table 3: Global Sparkling Drinks Revenue million Forecast, by Types 2020 & 2033
- Table 4: Global Sparkling Drinks Volume K Forecast, by Types 2020 & 2033
- Table 5: Global Sparkling Drinks Revenue million Forecast, by Region 2020 & 2033
- Table 6: Global Sparkling Drinks Volume K Forecast, by Region 2020 & 2033
- Table 7: Global Sparkling Drinks Revenue million Forecast, by Application 2020 & 2033
- Table 8: Global Sparkling Drinks Volume K Forecast, by Application 2020 & 2033
- Table 9: Global Sparkling Drinks Revenue million Forecast, by Types 2020 & 2033
- Table 10: Global Sparkling Drinks Volume K Forecast, by Types 2020 & 2033
- Table 11: Global Sparkling Drinks Revenue million Forecast, by Country 2020 & 2033
- Table 12: Global Sparkling Drinks Volume K Forecast, by Country 2020 & 2033
- Table 13: United States Sparkling Drinks Revenue (million) Forecast, by Application 2020 & 2033
- Table 14: United States Sparkling Drinks Volume (K) Forecast, by Application 2020 & 2033
- Table 15: Canada Sparkling Drinks Revenue (million) Forecast, by Application 2020 & 2033
- Table 16: Canada Sparkling Drinks Volume (K) Forecast, by Application 2020 & 2033
- Table 17: Mexico Sparkling Drinks Revenue (million) Forecast, by Application 2020 & 2033
- Table 18: Mexico Sparkling Drinks Volume (K) Forecast, by Application 2020 & 2033
- Table 19: Global Sparkling Drinks Revenue million Forecast, by Application 2020 & 2033
- Table 20: Global Sparkling Drinks Volume K Forecast, by Application 2020 & 2033
- Table 21: Global Sparkling Drinks Revenue million Forecast, by Types 2020 & 2033
- Table 22: Global Sparkling Drinks Volume K Forecast, by Types 2020 & 2033
- Table 23: Global Sparkling Drinks Revenue million Forecast, by Country 2020 & 2033
- Table 24: Global Sparkling Drinks Volume K Forecast, by Country 2020 & 2033
- Table 25: Brazil Sparkling Drinks Revenue (million) Forecast, by Application 2020 & 2033
- Table 26: Brazil Sparkling Drinks Volume (K) Forecast, by Application 2020 & 2033
- Table 27: Argentina Sparkling Drinks Revenue (million) Forecast, by Application 2020 & 2033
- Table 28: Argentina Sparkling Drinks Volume (K) Forecast, by Application 2020 & 2033
- Table 29: Rest of South America Sparkling Drinks Revenue (million) Forecast, by Application 2020 & 2033
- Table 30: Rest of South America Sparkling Drinks Volume (K) Forecast, by Application 2020 & 2033
- Table 31: Global Sparkling Drinks Revenue million Forecast, by Application 2020 & 2033
- Table 32: Global Sparkling Drinks Volume K Forecast, by Application 2020 & 2033
- Table 33: Global Sparkling Drinks Revenue million Forecast, by Types 2020 & 2033
- Table 34: Global Sparkling Drinks Volume K Forecast, by Types 2020 & 2033
- Table 35: Global Sparkling Drinks Revenue million Forecast, by Country 2020 & 2033
- Table 36: Global Sparkling Drinks Volume K Forecast, by Country 2020 & 2033
- Table 37: United Kingdom Sparkling Drinks Revenue (million) Forecast, by Application 2020 & 2033
- Table 38: United Kingdom Sparkling Drinks Volume (K) Forecast, by Application 2020 & 2033
- Table 39: Germany Sparkling Drinks Revenue (million) Forecast, by Application 2020 & 2033
- Table 40: Germany Sparkling Drinks Volume (K) Forecast, by Application 2020 & 2033
- Table 41: France Sparkling Drinks Revenue (million) Forecast, by Application 2020 & 2033
- Table 42: France Sparkling Drinks Volume (K) Forecast, by Application 2020 & 2033
- Table 43: Italy Sparkling Drinks Revenue (million) Forecast, by Application 2020 & 2033
- Table 44: Italy Sparkling Drinks Volume (K) Forecast, by Application 2020 & 2033
- Table 45: Spain Sparkling Drinks Revenue (million) Forecast, by Application 2020 & 2033
- Table 46: Spain Sparkling Drinks Volume (K) Forecast, by Application 2020 & 2033
- Table 47: Russia Sparkling Drinks Revenue (million) Forecast, by Application 2020 & 2033
- Table 48: Russia Sparkling Drinks Volume (K) Forecast, by Application 2020 & 2033
- Table 49: Benelux Sparkling Drinks Revenue (million) Forecast, by Application 2020 & 2033
- Table 50: Benelux Sparkling Drinks Volume (K) Forecast, by Application 2020 & 2033
- Table 51: Nordics Sparkling Drinks Revenue (million) Forecast, by Application 2020 & 2033
- Table 52: Nordics Sparkling Drinks Volume (K) Forecast, by Application 2020 & 2033
- Table 53: Rest of Europe Sparkling Drinks Revenue (million) Forecast, by Application 2020 & 2033
- Table 54: Rest of Europe Sparkling Drinks Volume (K) Forecast, by Application 2020 & 2033
- Table 55: Global Sparkling Drinks Revenue million Forecast, by Application 2020 & 2033
- Table 56: Global Sparkling Drinks Volume K Forecast, by Application 2020 & 2033
- Table 57: Global Sparkling Drinks Revenue million Forecast, by Types 2020 & 2033
- Table 58: Global Sparkling Drinks Volume K Forecast, by Types 2020 & 2033
- Table 59: Global Sparkling Drinks Revenue million Forecast, by Country 2020 & 2033
- Table 60: Global Sparkling Drinks Volume K Forecast, by Country 2020 & 2033
- Table 61: Turkey Sparkling Drinks Revenue (million) Forecast, by Application 2020 & 2033
- Table 62: Turkey Sparkling Drinks Volume (K) Forecast, by Application 2020 & 2033
- Table 63: Israel Sparkling Drinks Revenue (million) Forecast, by Application 2020 & 2033
- Table 64: Israel Sparkling Drinks Volume (K) Forecast, by Application 2020 & 2033
- Table 65: GCC Sparkling Drinks Revenue (million) Forecast, by Application 2020 & 2033
- Table 66: GCC Sparkling Drinks Volume (K) Forecast, by Application 2020 & 2033
- Table 67: North Africa Sparkling Drinks Revenue (million) Forecast, by Application 2020 & 2033
- Table 68: North Africa Sparkling Drinks Volume (K) Forecast, by Application 2020 & 2033
- Table 69: South Africa Sparkling Drinks Revenue (million) Forecast, by Application 2020 & 2033
- Table 70: South Africa Sparkling Drinks Volume (K) Forecast, by Application 2020 & 2033
- Table 71: Rest of Middle East & Africa Sparkling Drinks Revenue (million) Forecast, by Application 2020 & 2033
- Table 72: Rest of Middle East & Africa Sparkling Drinks Volume (K) Forecast, by Application 2020 & 2033
- Table 73: Global Sparkling Drinks Revenue million Forecast, by Application 2020 & 2033
- Table 74: Global Sparkling Drinks Volume K Forecast, by Application 2020 & 2033
- Table 75: Global Sparkling Drinks Revenue million Forecast, by Types 2020 & 2033
- Table 76: Global Sparkling Drinks Volume K Forecast, by Types 2020 & 2033
- Table 77: Global Sparkling Drinks Revenue million Forecast, by Country 2020 & 2033
- Table 78: Global Sparkling Drinks Volume K Forecast, by Country 2020 & 2033
- Table 79: China Sparkling Drinks Revenue (million) Forecast, by Application 2020 & 2033
- Table 80: China Sparkling Drinks Volume (K) Forecast, by Application 2020 & 2033
- Table 81: India Sparkling Drinks Revenue (million) Forecast, by Application 2020 & 2033
- Table 82: India Sparkling Drinks Volume (K) Forecast, by Application 2020 & 2033
- Table 83: Japan Sparkling Drinks Revenue (million) Forecast, by Application 2020 & 2033
- Table 84: Japan Sparkling Drinks Volume (K) Forecast, by Application 2020 & 2033
- Table 85: South Korea Sparkling Drinks Revenue (million) Forecast, by Application 2020 & 2033
- Table 86: South Korea Sparkling Drinks Volume (K) Forecast, by Application 2020 & 2033
- Table 87: ASEAN Sparkling Drinks Revenue (million) Forecast, by Application 2020 & 2033
- Table 88: ASEAN Sparkling Drinks Volume (K) Forecast, by Application 2020 & 2033
- Table 89: Oceania Sparkling Drinks Revenue (million) Forecast, by Application 2020 & 2033
- Table 90: Oceania Sparkling Drinks Volume (K) Forecast, by Application 2020 & 2033
- Table 91: Rest of Asia Pacific Sparkling Drinks Revenue (million) Forecast, by Application 2020 & 2033
- Table 92: Rest of Asia Pacific Sparkling Drinks Volume (K) Forecast, by Application 2020 & 2033
Frequently Asked Questions
1. What is the projected Compound Annual Growth Rate (CAGR) of the Sparkling Drinks?
The projected CAGR is approximately 6.37%.
2. Which companies are prominent players in the Sparkling Drinks?
Key companies in the market include Pepsico, Welch Foods, Ocean Spray, Waterloo Sparkling Water, Sapporo Group, Seven Sparkling Water, National Beverage Corporation, Reed’s, SIPP Eco Beverage, Crooked Beverage.
3. What are the main segments of the Sparkling Drinks?
The market segments include Application, Types.
4. Can you provide details about the market size?
The market size is estimated to be USD 654.96 million as of 2022.
5. What are some drivers contributing to market growth?
N/A
6. What are the notable trends driving market growth?
N/A
7. Are there any restraints impacting market growth?
N/A
8. Can you provide examples of recent developments in the market?
N/A
9. What pricing options are available for accessing the report?
Pricing options include single-user, multi-user, and enterprise licenses priced at USD 3350.00, USD 5025.00, and USD 6700.00 respectively.
10. Is the market size provided in terms of value or volume?
The market size is provided in terms of value, measured in million and volume, measured in K.
11. Are there any specific market keywords associated with the report?
Yes, the market keyword associated with the report is "Sparkling Drinks," which aids in identifying and referencing the specific market segment covered.
12. How do I determine which pricing option suits my needs best?
The pricing options vary based on user requirements and access needs. Individual users may opt for single-user licenses, while businesses requiring broader access may choose multi-user or enterprise licenses for cost-effective access to the report.
13. Are there any additional resources or data provided in the Sparkling Drinks report?
While the report offers comprehensive insights, it's advisable to review the specific contents or supplementary materials provided to ascertain if additional resources or data are available.
14. How can I stay updated on further developments or reports in the Sparkling Drinks?
To stay informed about further developments, trends, and reports in the Sparkling Drinks, consider subscribing to industry newsletters, following relevant companies and organizations, or regularly checking reputable industry news sources and publications.
Methodology
Step 1 - Identification of Relevant Samples Size from Population Database


Step 2 - Approaches for Defining Global Market Size (Value, Volume* & Price*)

Note*: In applicable scenarios
Step 3 - Data Sources
Primary Research
- Web Analytics
- Survey Reports
- Research Institute
- Latest Research Reports
- Opinion Leaders
Secondary Research
- Annual Reports
- White Paper
- Latest Press Release
- Industry Association
- Paid Database
- Investor Presentations

Step 4 - Data Triangulation
Involves using different sources of information in order to increase the validity of a study
These sources are likely to be stakeholders in a program - participants, other researchers, program staff, other community members, and so on.
Then we put all data in single framework & apply various statistical tools to find out the dynamic on the market.
During the analysis stage, feedback from the stakeholder groups would be compared to determine areas of agreement as well as areas of divergence