

Key Insights
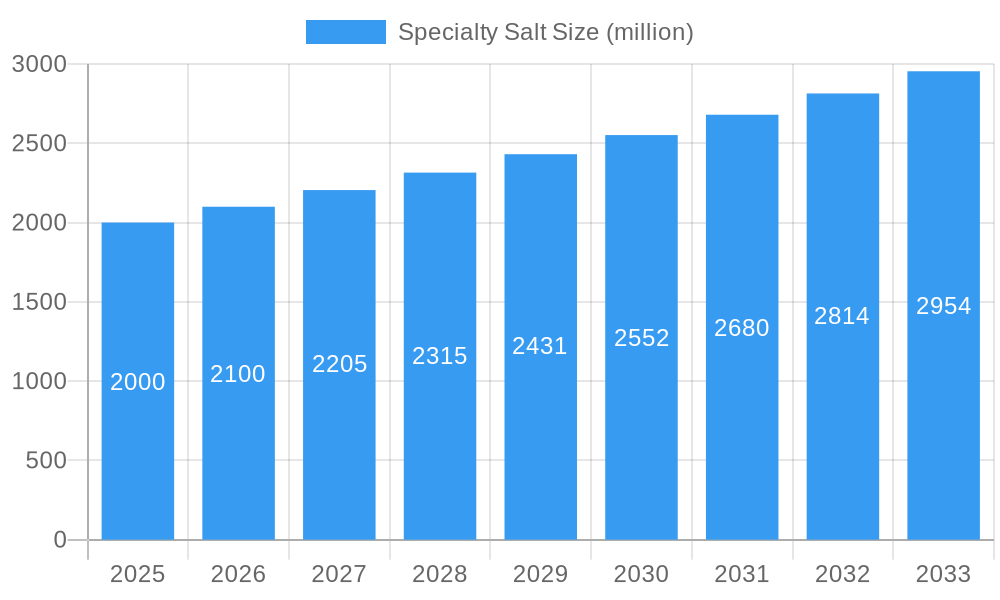
The specialty salt market is experiencing robust growth, driven by increasing consumer demand for high-quality, gourmet salts and their perceived health benefits. The market, estimated at $2 billion in 2025, is projected to exhibit a Compound Annual Growth Rate (CAGR) of 5% from 2025 to 2033, reaching approximately $2.8 billion by 2033. This expansion is fueled by several key factors, including the rising popularity of gourmet cooking and culinary experimentation, a growing awareness of the impact of sodium content on health (leading to a preference for cleaner, unprocessed salts), and the increasing availability of specialty salts through diverse retail channels, including gourmet food stores, online retailers, and specialty supermarkets. The market is segmented by salt type (sea salt, Himalayan pink salt, black salt, etc.), application (culinary, industrial), and geographic region. Companies like Cargill, Maldon Crystal Salt, and SaltWorks are major players, leveraging brand recognition and distribution networks to maintain market share.
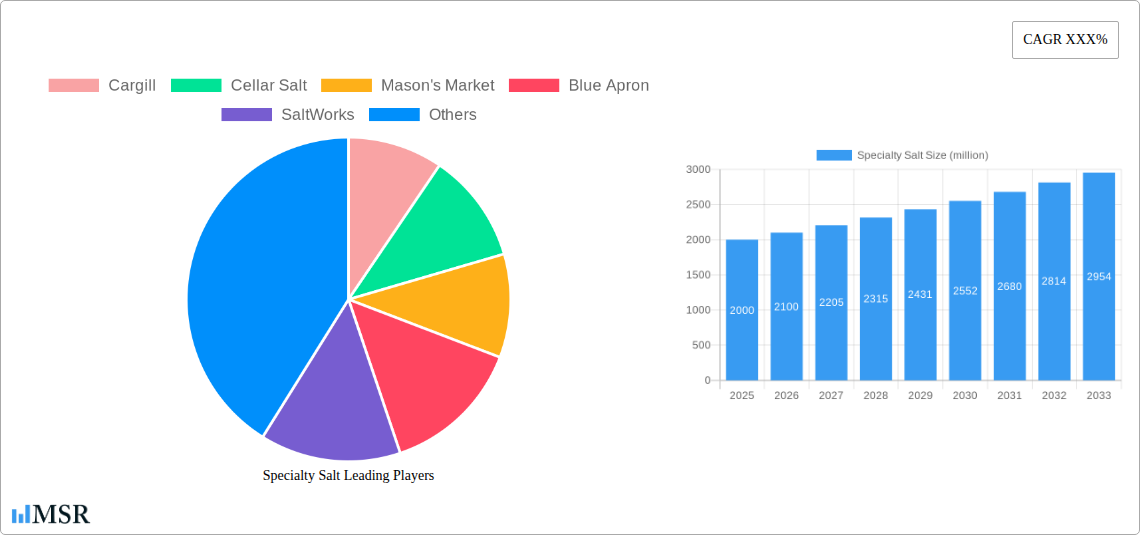
Specialty Salt Market Size (In Billion)
Significant trends shaping the market include the rise of artisanal and sustainably sourced salts, catering to environmentally conscious consumers. The increasing demand for functional salts enriched with minerals and flavor profiles also contributes to growth. While challenges exist, such as price fluctuations in raw materials and intense competition, the overall market outlook remains positive, underpinned by sustained consumer interest in premium food products and healthy eating habits. Further segmentation within the market could be explored to better understand specific trends, such as the growth of niche salt varieties and the influence of health and wellness trends on consumer purchasing decisions. This presents opportunities for new market entrants and product innovations in this already vibrant market.
Specialty Salt Company Market Share
Dive Deep into the Booming Specialty Salt Market: A Comprehensive Report (2019-2033)
This comprehensive report provides an in-depth analysis of the global specialty salt market, projecting a market value exceeding $XX million by 2033. It offers invaluable insights for industry stakeholders, including manufacturers, distributors, investors, and regulatory bodies, providing actionable intelligence for strategic decision-making. The report covers the period from 2019 to 2033, with 2025 serving as both the base and estimated year. This meticulously researched study features detailed market segmentation, competitive landscape analysis, and future growth projections, offering a complete picture of this dynamic market.
Specialty Salt Market Concentration & Dynamics
The global specialty salt market exhibits moderate concentration, with key players like Cargill, SaltWorks, and Maldon Crystal Salt Company Limited holding significant market shares. However, the market also accommodates numerous smaller, niche players catering to specific consumer preferences. The market's dynamics are shaped by several factors:
- Innovation Ecosystems: Ongoing R&D focuses on developing specialty salts with enhanced functionalities, including unique flavors, textures, and health benefits. This drives product differentiation and expands market appeal.
- Regulatory Frameworks: Food safety regulations and labeling requirements influence product development and market access. Compliance costs and varying regulations across regions impact market dynamics.
- Substitute Products: While direct substitutes are limited, alternative seasoning options and flavoring agents indirectly compete with specialty salt.
- End-User Trends: Growing health consciousness, gourmet cooking trends, and demand for natural and sustainable products fuel market growth.
- M&A Activities: The past five years have witnessed approximately xx M&A deals in the specialty salt sector, indicating consolidation and expansion efforts by major players. Market share acquisitions through mergers and acquisitions are contributing to increased market concentration. For example, Cargill's acquisition of smaller salt producers allowed them to strengthen their market position and product portfolio.
Specialty Salt Industry Insights & Trends
The global specialty salt market experienced robust growth during the historical period (2019-2024), with a Compound Annual Growth Rate (CAGR) of xx%. This growth is driven by several key factors:
The rising demand for gourmet food and healthy eating habits has been a significant driver. The increasing adoption of specialty salts in high-end restaurants and culinary applications indicates a strong positive correlation between rising disposable incomes and demand for premium salt varieties. Technological advancements in salt processing and purification have enabled the creation of novel salt products with enhanced qualities, further stimulating market expansion. Furthermore, evolving consumer preferences toward natural and minimally processed food products are propelling the growth of the specialty salt market. The market size in 2025 is estimated at $XX million and projected to reach $XX million by 2033.
Key Markets & Segments Leading Specialty Salt
The North American region currently dominates the specialty salt market, driven by factors such as:
- Economic Growth: Strong economic performance and high disposable incomes support demand for premium food products.
- Infrastructure: Well-established food processing and distribution networks facilitate efficient product delivery.
- Consumer Preferences: A strong preference for gourmet and specialty food items contributes significantly to market growth.
This dominance is further reinforced by high consumer awareness of health and wellness, which drives the demand for high-quality, natural specialty salts. Europe follows as a key market, with a considerable and steadily growing demand. The segment focusing on gourmet and culinary applications holds the largest market share, reflecting the ongoing premiumization trends in the food industry.
Specialty Salt Product Developments
Recent product innovations focus on enhanced flavors, textures, and functional properties. This includes the introduction of infused salts (e.g., herbs, spices), smoked salts, and salts with added minerals or vitamins. These advancements cater to evolving consumer preferences for unique culinary experiences and health-conscious choices. Technological improvements in salt harvesting and processing techniques ensure consistent quality and purity, enhancing product competitiveness.
Challenges in the Specialty Salt Market
The specialty salt market faces several challenges:
- Regulatory Hurdles: Stringent food safety regulations and labeling requirements increase production costs and compliance complexities.
- Supply Chain Issues: Fluctuations in raw material prices and disruptions in global supply chains impact product availability and profitability.
- Competitive Pressures: The market's fragmented nature and presence of numerous niche players create intense competition, requiring continuous innovation and differentiation. The impact of these challenges is estimated to reduce the overall market growth by approximately xx% during the forecast period.
Forces Driving Specialty Salt Growth
Several key forces propel the growth of the specialty salt market:
- Technological Advancements: Innovations in salt processing and purification techniques enhance product quality, consistency, and functionality.
- Economic Growth: Rising disposable incomes in developed and emerging economies stimulate demand for premium food products.
- Favorable Regulatory Environment: Supportive government policies related to food safety and consumer protection contribute to market expansion. For instance, the EU's regulations on food labeling have led to increased transparency in the specialty salt market, boosting consumer confidence.
Long-Term Growth Catalysts
Long-term growth in the specialty salt market will be fueled by strategic partnerships between salt producers and food manufacturers, leading to innovative product formulations and expanded market reach. Further, investments in R&D will continue to drive product innovation and differentiation. Expansion into new geographical markets, particularly in Asia and emerging economies, will also play a crucial role.
Emerging Opportunities in Specialty Salt
Emerging opportunities include the growing demand for functional specialty salts with added health benefits (e.g., reduced sodium content, enhanced mineral content). The development of sustainable and ethically sourced salt products is gaining traction, representing a significant market opportunity. The expansion into niche markets like gourmet food, artisanal food production, and premium pet food is also driving growth.
Leading Players in the Specialty Salt Sector
- Cargill
- Cellar Salt
- Mason's Market
- Blue Apron
- SaltWorks
- San Francisco Salt
- Maldon Crystal Salt Company Limited
- Pyramid Salt
- Alaska Pure Sea Salt
Key Milestones in Specialty Salt Industry
- 2020: Cargill launched a new line of infused specialty salts.
- 2021: SaltWorks introduced a sustainable salt harvesting process.
- 2022: Maldon Crystal Salt Company Limited expanded its distribution network into Asia.
- 2023: Several smaller specialty salt producers merged, creating a larger market player. (Specific details not available, replaced with placeholder event)
- 2024: Increased focus on sustainable salt production methods in response to growing environmental concerns.
Strategic Outlook for Specialty Salt Market
The future of the specialty salt market is bright. Continued innovation, strategic partnerships, and expansion into new markets will drive significant growth. The focus on sustainability, health, and unique flavor profiles will be key differentiators, attracting discerning consumers and driving market expansion throughout the forecast period. The strategic opportunities presented by the growing food processing and health and wellness sectors will further enhance the market’s potential.
Specialty Salt Segmentation
-
1. Application
- 1.1. Bakery Products
- 1.2. Meat and Sea Foods
- 1.3. Crackers and Snacks
- 1.4. Other
-
2. Type
- 2.1. Himalayan Pink Salt
- 2.2. Sea Flake Salt
- 2.3. Gourmet Salt
- 2.4. Rock Salt
- 2.5. Other
Specialty Salt Segmentation By Geography
-
1. North America
- 1.1. United States
- 1.2. Canada
- 1.3. Mexico
-
2. South America
- 2.1. Brazil
- 2.2. Argentina
- 2.3. Rest of South America
-
3. Europe
- 3.1. United Kingdom
- 3.2. Germany
- 3.3. France
- 3.4. Italy
- 3.5. Spain
- 3.6. Russia
- 3.7. Benelux
- 3.8. Nordics
- 3.9. Rest of Europe
-
4. Middle East & Africa
- 4.1. Turkey
- 4.2. Israel
- 4.3. GCC
- 4.4. North Africa
- 4.5. South Africa
- 4.6. Rest of Middle East & Africa
-
5. Asia Pacific
- 5.1. China
- 5.2. India
- 5.3. Japan
- 5.4. South Korea
- 5.5. ASEAN
- 5.6. Oceania
- 5.7. Rest of Asia Pacific

Specialty Salt Regional Market Share
Geographic Coverage of Specialty Salt
Specialty Salt REPORT HIGHLIGHTS
| Aspects | Details |
|---|---|
| Study Period | 2020-2034 |
| Base Year | 2025 |
| Estimated Year | 2026 |
| Forecast Period | 2026-2034 |
| Historical Period | 2020-2025 |
| Growth Rate | CAGR of 6.3% from 2020-2034 |
| Segmentation |
|
Table of Contents
- 1. Introduction
- 1.1. Research Scope
- 1.2. Market Segmentation
- 1.3. Research Objective
- 1.4. Definitions and Assumptions
- 2. Executive Summary
- 2.1. Market Snapshot
- 3. Market Dynamics
- 3.1. Market Drivers
- 3.2. Market Restrains
- 3.3. Market Trends
- 3.4. Market Opportunities
- 4. Market Factor Analysis
- 4.1. Porters Five Forces
- 4.1.1. Bargaining Power of Suppliers
- 4.1.2. Bargaining Power of Buyers
- 4.1.3. Threat of New Entrants
- 4.1.4. Threat of Substitutes
- 4.1.5. Competitive Rivalry
- 4.2. PESTEL analysis
- 4.3. BCG Analysis
- 4.3.1. Stars (High Growth, High Market Share)
- 4.3.2. Cash Cows (Low Growth, High Market Share)
- 4.3.3. Question Mark (High Growth, Low Market Share)
- 4.3.4. Dogs (Low Growth, Low Market Share)
- 4.4. Ansoff Matrix Analysis
- 4.5. Supply Chain Analysis
- 4.6. Regulatory Landscape
- 4.7. Current Market Potential and Opportunity Assessment (TAM–SAM–SOM Framework)
- 4.8. MSR Analyst Note
- 4.1. Porters Five Forces
- 5. Market Analysis, Insights and Forecast 2021-2033
- 5.1. Market Analysis, Insights and Forecast - by Application
- 5.1.1. Bakery Products
- 5.1.2. Meat and Sea Foods
- 5.1.3. Crackers and Snacks
- 5.1.4. Other
- 5.2. Market Analysis, Insights and Forecast - by Type
- 5.2.1. Himalayan Pink Salt
- 5.2.2. Sea Flake Salt
- 5.2.3. Gourmet Salt
- 5.2.4. Rock Salt
- 5.2.5. Other
- 5.3. Market Analysis, Insights and Forecast - by Region
- 5.3.1. North America
- 5.3.2. South America
- 5.3.3. Europe
- 5.3.4. Middle East & Africa
- 5.3.5. Asia Pacific
- 5.1. Market Analysis, Insights and Forecast - by Application
- 6. Global Specialty Salt Analysis, Insights and Forecast, 2021-2033
- 6.1. Market Analysis, Insights and Forecast - by Application
- 6.1.1. Bakery Products
- 6.1.2. Meat and Sea Foods
- 6.1.3. Crackers and Snacks
- 6.1.4. Other
- 6.2. Market Analysis, Insights and Forecast - by Type
- 6.2.1. Himalayan Pink Salt
- 6.2.2. Sea Flake Salt
- 6.2.3. Gourmet Salt
- 6.2.4. Rock Salt
- 6.2.5. Other
- 6.1. Market Analysis, Insights and Forecast - by Application
- 7. North America Specialty Salt Analysis, Insights and Forecast, 2020-2032
- 7.1. Market Analysis, Insights and Forecast - by Application
- 7.1.1. Bakery Products
- 7.1.2. Meat and Sea Foods
- 7.1.3. Crackers and Snacks
- 7.1.4. Other
- 7.2. Market Analysis, Insights and Forecast - by Type
- 7.2.1. Himalayan Pink Salt
- 7.2.2. Sea Flake Salt
- 7.2.3. Gourmet Salt
- 7.2.4. Rock Salt
- 7.2.5. Other
- 7.1. Market Analysis, Insights and Forecast - by Application
- 8. South America Specialty Salt Analysis, Insights and Forecast, 2020-2032
- 8.1. Market Analysis, Insights and Forecast - by Application
- 8.1.1. Bakery Products
- 8.1.2. Meat and Sea Foods
- 8.1.3. Crackers and Snacks
- 8.1.4. Other
- 8.2. Market Analysis, Insights and Forecast - by Type
- 8.2.1. Himalayan Pink Salt
- 8.2.2. Sea Flake Salt
- 8.2.3. Gourmet Salt
- 8.2.4. Rock Salt
- 8.2.5. Other
- 8.1. Market Analysis, Insights and Forecast - by Application
- 9. Europe Specialty Salt Analysis, Insights and Forecast, 2020-2032
- 9.1. Market Analysis, Insights and Forecast - by Application
- 9.1.1. Bakery Products
- 9.1.2. Meat and Sea Foods
- 9.1.3. Crackers and Snacks
- 9.1.4. Other
- 9.2. Market Analysis, Insights and Forecast - by Type
- 9.2.1. Himalayan Pink Salt
- 9.2.2. Sea Flake Salt
- 9.2.3. Gourmet Salt
- 9.2.4. Rock Salt
- 9.2.5. Other
- 9.1. Market Analysis, Insights and Forecast - by Application
- 10. Middle East & Africa Specialty Salt Analysis, Insights and Forecast, 2020-2032
- 10.1. Market Analysis, Insights and Forecast - by Application
- 10.1.1. Bakery Products
- 10.1.2. Meat and Sea Foods
- 10.1.3. Crackers and Snacks
- 10.1.4. Other
- 10.2. Market Analysis, Insights and Forecast - by Type
- 10.2.1. Himalayan Pink Salt
- 10.2.2. Sea Flake Salt
- 10.2.3. Gourmet Salt
- 10.2.4. Rock Salt
- 10.2.5. Other
- 10.1. Market Analysis, Insights and Forecast - by Application
- 11. Asia Pacific Specialty Salt Analysis, Insights and Forecast, 2020-2032
- 11.1. Market Analysis, Insights and Forecast - by Application
- 11.1.1. Bakery Products
- 11.1.2. Meat and Sea Foods
- 11.1.3. Crackers and Snacks
- 11.1.4. Other
- 11.2. Market Analysis, Insights and Forecast - by Type
- 11.2.1. Himalayan Pink Salt
- 11.2.2. Sea Flake Salt
- 11.2.3. Gourmet Salt
- 11.2.4. Rock Salt
- 11.2.5. Other
- 11.1. Market Analysis, Insights and Forecast - by Application
- 12. Competitive Analysis
- 12.1. Company Profiles
- 12.1.1 Cargill
- 12.1.1.1. Company Overview
- 12.1.1.2. Products
- 12.1.1.3. Company Financials
- 12.1.1.4. SWOT Analysis
- 12.1.2 Cellar Salt
- 12.1.2.1. Company Overview
- 12.1.2.2. Products
- 12.1.2.3. Company Financials
- 12.1.2.4. SWOT Analysis
- 12.1.3 Mason's Market
- 12.1.3.1. Company Overview
- 12.1.3.2. Products
- 12.1.3.3. Company Financials
- 12.1.3.4. SWOT Analysis
- 12.1.4 Blue Apron
- 12.1.4.1. Company Overview
- 12.1.4.2. Products
- 12.1.4.3. Company Financials
- 12.1.4.4. SWOT Analysis
- 12.1.5 SaltWorks
- 12.1.5.1. Company Overview
- 12.1.5.2. Products
- 12.1.5.3. Company Financials
- 12.1.5.4. SWOT Analysis
- 12.1.6 San Francisco Salt
- 12.1.6.1. Company Overview
- 12.1.6.2. Products
- 12.1.6.3. Company Financials
- 12.1.6.4. SWOT Analysis
- 12.1.7 Maldon Crystal Salt Company Limited
- 12.1.7.1. Company Overview
- 12.1.7.2. Products
- 12.1.7.3. Company Financials
- 12.1.7.4. SWOT Analysis
- 12.1.8 Pyramid Salt
- 12.1.8.1. Company Overview
- 12.1.8.2. Products
- 12.1.8.3. Company Financials
- 12.1.8.4. SWOT Analysis
- 12.1.9 Alaska Pure Sea Salt
- 12.1.9.1. Company Overview
- 12.1.9.2. Products
- 12.1.9.3. Company Financials
- 12.1.9.4. SWOT Analysis
- 12.1.1 Cargill
- 12.2. Market Entropy
- 12.2.1 Company's Key Areas Served
- 12.2.2 Recent Developments
- 12.3. Company Market Share Analysis 2025
- 12.3.1 Top 5 Companies Market Share Analysis
- 12.3.2 Top 3 Companies Market Share Analysis
- 12.4. List of Potential Customers
- 13. Research Methodology
List of Figures
- Figure 1: Global Specialty Salt Revenue Breakdown (undefined, %) by Region 2025 & 2033
- Figure 2: North America Specialty Salt Revenue (undefined), by Application 2025 & 2033
- Figure 3: North America Specialty Salt Revenue Share (%), by Application 2025 & 2033
- Figure 4: North America Specialty Salt Revenue (undefined), by Type 2025 & 2033
- Figure 5: North America Specialty Salt Revenue Share (%), by Type 2025 & 2033
- Figure 6: North America Specialty Salt Revenue (undefined), by Country 2025 & 2033
- Figure 7: North America Specialty Salt Revenue Share (%), by Country 2025 & 2033
- Figure 8: South America Specialty Salt Revenue (undefined), by Application 2025 & 2033
- Figure 9: South America Specialty Salt Revenue Share (%), by Application 2025 & 2033
- Figure 10: South America Specialty Salt Revenue (undefined), by Type 2025 & 2033
- Figure 11: South America Specialty Salt Revenue Share (%), by Type 2025 & 2033
- Figure 12: South America Specialty Salt Revenue (undefined), by Country 2025 & 2033
- Figure 13: South America Specialty Salt Revenue Share (%), by Country 2025 & 2033
- Figure 14: Europe Specialty Salt Revenue (undefined), by Application 2025 & 2033
- Figure 15: Europe Specialty Salt Revenue Share (%), by Application 2025 & 2033
- Figure 16: Europe Specialty Salt Revenue (undefined), by Type 2025 & 2033
- Figure 17: Europe Specialty Salt Revenue Share (%), by Type 2025 & 2033
- Figure 18: Europe Specialty Salt Revenue (undefined), by Country 2025 & 2033
- Figure 19: Europe Specialty Salt Revenue Share (%), by Country 2025 & 2033
- Figure 20: Middle East & Africa Specialty Salt Revenue (undefined), by Application 2025 & 2033
- Figure 21: Middle East & Africa Specialty Salt Revenue Share (%), by Application 2025 & 2033
- Figure 22: Middle East & Africa Specialty Salt Revenue (undefined), by Type 2025 & 2033
- Figure 23: Middle East & Africa Specialty Salt Revenue Share (%), by Type 2025 & 2033
- Figure 24: Middle East & Africa Specialty Salt Revenue (undefined), by Country 2025 & 2033
- Figure 25: Middle East & Africa Specialty Salt Revenue Share (%), by Country 2025 & 2033
- Figure 26: Asia Pacific Specialty Salt Revenue (undefined), by Application 2025 & 2033
- Figure 27: Asia Pacific Specialty Salt Revenue Share (%), by Application 2025 & 2033
- Figure 28: Asia Pacific Specialty Salt Revenue (undefined), by Type 2025 & 2033
- Figure 29: Asia Pacific Specialty Salt Revenue Share (%), by Type 2025 & 2033
- Figure 30: Asia Pacific Specialty Salt Revenue (undefined), by Country 2025 & 2033
- Figure 31: Asia Pacific Specialty Salt Revenue Share (%), by Country 2025 & 2033
List of Tables
- Table 1: Global Specialty Salt Revenue undefined Forecast, by Application 2020 & 2033
- Table 2: Global Specialty Salt Revenue undefined Forecast, by Type 2020 & 2033
- Table 3: Global Specialty Salt Revenue undefined Forecast, by Region 2020 & 2033
- Table 4: Global Specialty Salt Revenue undefined Forecast, by Application 2020 & 2033
- Table 5: Global Specialty Salt Revenue undefined Forecast, by Type 2020 & 2033
- Table 6: Global Specialty Salt Revenue undefined Forecast, by Country 2020 & 2033
- Table 7: United States Specialty Salt Revenue (undefined) Forecast, by Application 2020 & 2033
- Table 8: Canada Specialty Salt Revenue (undefined) Forecast, by Application 2020 & 2033
- Table 9: Mexico Specialty Salt Revenue (undefined) Forecast, by Application 2020 & 2033
- Table 10: Global Specialty Salt Revenue undefined Forecast, by Application 2020 & 2033
- Table 11: Global Specialty Salt Revenue undefined Forecast, by Type 2020 & 2033
- Table 12: Global Specialty Salt Revenue undefined Forecast, by Country 2020 & 2033
- Table 13: Brazil Specialty Salt Revenue (undefined) Forecast, by Application 2020 & 2033
- Table 14: Argentina Specialty Salt Revenue (undefined) Forecast, by Application 2020 & 2033
- Table 15: Rest of South America Specialty Salt Revenue (undefined) Forecast, by Application 2020 & 2033
- Table 16: Global Specialty Salt Revenue undefined Forecast, by Application 2020 & 2033
- Table 17: Global Specialty Salt Revenue undefined Forecast, by Type 2020 & 2033
- Table 18: Global Specialty Salt Revenue undefined Forecast, by Country 2020 & 2033
- Table 19: United Kingdom Specialty Salt Revenue (undefined) Forecast, by Application 2020 & 2033
- Table 20: Germany Specialty Salt Revenue (undefined) Forecast, by Application 2020 & 2033
- Table 21: France Specialty Salt Revenue (undefined) Forecast, by Application 2020 & 2033
- Table 22: Italy Specialty Salt Revenue (undefined) Forecast, by Application 2020 & 2033
- Table 23: Spain Specialty Salt Revenue (undefined) Forecast, by Application 2020 & 2033
- Table 24: Russia Specialty Salt Revenue (undefined) Forecast, by Application 2020 & 2033
- Table 25: Benelux Specialty Salt Revenue (undefined) Forecast, by Application 2020 & 2033
- Table 26: Nordics Specialty Salt Revenue (undefined) Forecast, by Application 2020 & 2033
- Table 27: Rest of Europe Specialty Salt Revenue (undefined) Forecast, by Application 2020 & 2033
- Table 28: Global Specialty Salt Revenue undefined Forecast, by Application 2020 & 2033
- Table 29: Global Specialty Salt Revenue undefined Forecast, by Type 2020 & 2033
- Table 30: Global Specialty Salt Revenue undefined Forecast, by Country 2020 & 2033
- Table 31: Turkey Specialty Salt Revenue (undefined) Forecast, by Application 2020 & 2033
- Table 32: Israel Specialty Salt Revenue (undefined) Forecast, by Application 2020 & 2033
- Table 33: GCC Specialty Salt Revenue (undefined) Forecast, by Application 2020 & 2033
- Table 34: North Africa Specialty Salt Revenue (undefined) Forecast, by Application 2020 & 2033
- Table 35: South Africa Specialty Salt Revenue (undefined) Forecast, by Application 2020 & 2033
- Table 36: Rest of Middle East & Africa Specialty Salt Revenue (undefined) Forecast, by Application 2020 & 2033
- Table 37: Global Specialty Salt Revenue undefined Forecast, by Application 2020 & 2033
- Table 38: Global Specialty Salt Revenue undefined Forecast, by Type 2020 & 2033
- Table 39: Global Specialty Salt Revenue undefined Forecast, by Country 2020 & 2033
- Table 40: China Specialty Salt Revenue (undefined) Forecast, by Application 2020 & 2033
- Table 41: India Specialty Salt Revenue (undefined) Forecast, by Application 2020 & 2033
- Table 42: Japan Specialty Salt Revenue (undefined) Forecast, by Application 2020 & 2033
- Table 43: South Korea Specialty Salt Revenue (undefined) Forecast, by Application 2020 & 2033
- Table 44: ASEAN Specialty Salt Revenue (undefined) Forecast, by Application 2020 & 2033
- Table 45: Oceania Specialty Salt Revenue (undefined) Forecast, by Application 2020 & 2033
- Table 46: Rest of Asia Pacific Specialty Salt Revenue (undefined) Forecast, by Application 2020 & 2033
Frequently Asked Questions
1. What is the projected Compound Annual Growth Rate (CAGR) of the Specialty Salt?
The projected CAGR is approximately 6.3%.
2. Which companies are prominent players in the Specialty Salt?
Key companies in the market include Cargill, Cellar Salt, Mason's Market, Blue Apron, SaltWorks, San Francisco Salt, Maldon Crystal Salt Company Limited, Pyramid Salt, Alaska Pure Sea Salt.
3. What are the main segments of the Specialty Salt?
The market segments include Application, Type.
4. Can you provide details about the market size?
The market size is estimated to be USD XXX N/A as of 2022.
5. What are some drivers contributing to market growth?
N/A
6. What are the notable trends driving market growth?
N/A
7. Are there any restraints impacting market growth?
N/A
8. Can you provide examples of recent developments in the market?
N/A
9. What pricing options are available for accessing the report?
Pricing options include single-user, multi-user, and enterprise licenses priced at USD 4250.00, USD 6375.00, and USD 8500.00 respectively.
10. Is the market size provided in terms of value or volume?
The market size is provided in terms of value, measured in N/A.
11. Are there any specific market keywords associated with the report?
Yes, the market keyword associated with the report is "Specialty Salt," which aids in identifying and referencing the specific market segment covered.
12. How do I determine which pricing option suits my needs best?
The pricing options vary based on user requirements and access needs. Individual users may opt for single-user licenses, while businesses requiring broader access may choose multi-user or enterprise licenses for cost-effective access to the report.
13. Are there any additional resources or data provided in the Specialty Salt report?
While the report offers comprehensive insights, it's advisable to review the specific contents or supplementary materials provided to ascertain if additional resources or data are available.
14. How can I stay updated on further developments or reports in the Specialty Salt?
To stay informed about further developments, trends, and reports in the Specialty Salt, consider subscribing to industry newsletters, following relevant companies and organizations, or regularly checking reputable industry news sources and publications.
Methodology
Step 1 - Identification of Relevant Samples Size from Population Database


Step 2 - Approaches for Defining Global Market Size (Value, Volume* & Price*)

Note*: In applicable scenarios
Step 3 - Data Sources
Primary Research
- Web Analytics
- Survey Reports
- Research Institute
- Latest Research Reports
- Opinion Leaders
Secondary Research
- Annual Reports
- White Paper
- Latest Press Release
- Industry Association
- Paid Database
- Investor Presentations

Step 4 - Data Triangulation
Involves using different sources of information in order to increase the validity of a study
These sources are likely to be stakeholders in a program - participants, other researchers, program staff, other community members, and so on.
Then we put all data in single framework & apply various statistical tools to find out the dynamic on the market.
During the analysis stage, feedback from the stakeholder groups would be compared to determine areas of agreement as well as areas of divergence