

Key Insights
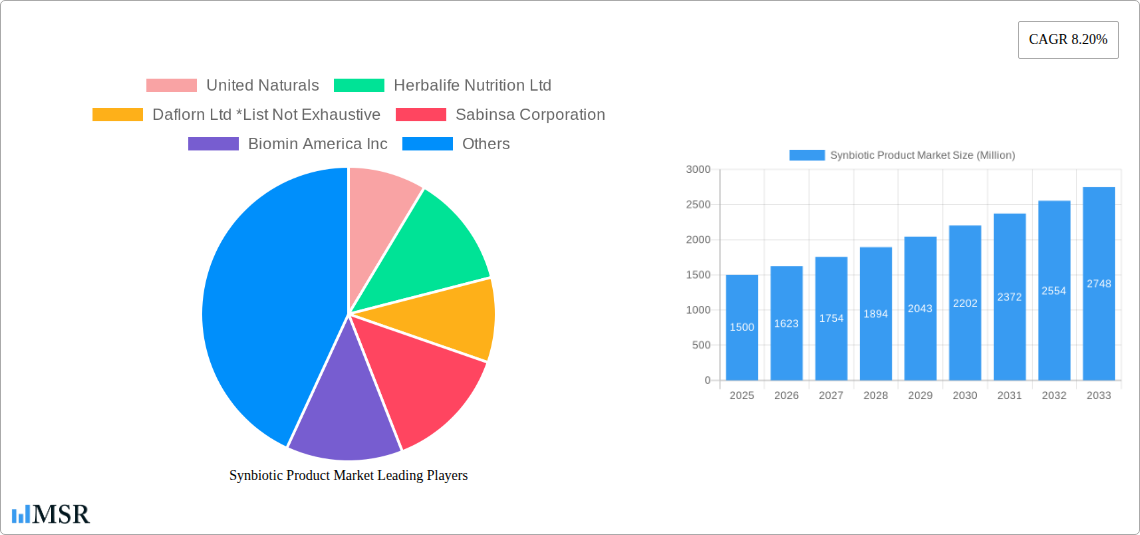
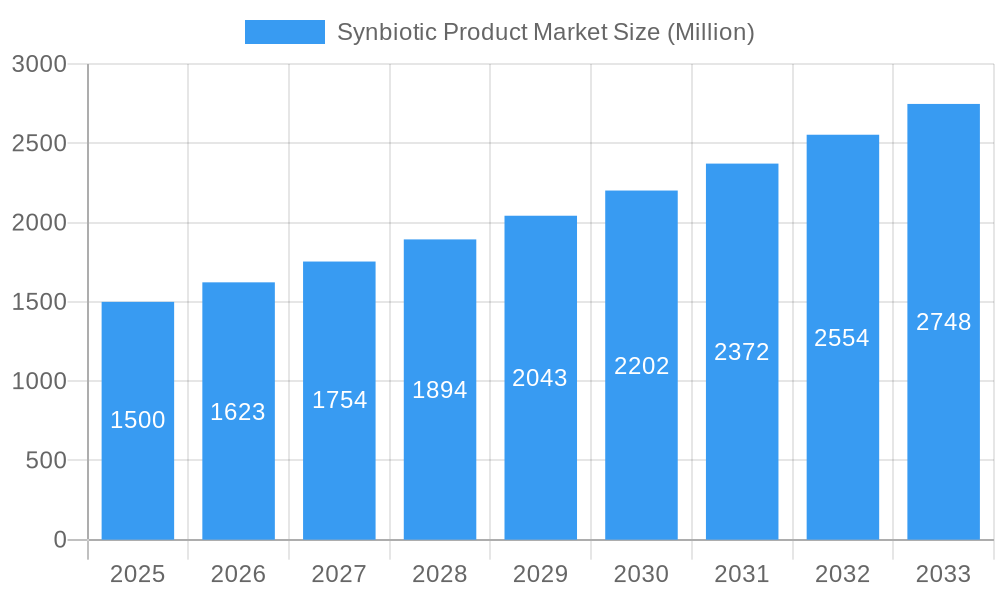
The global synbiotic product market is experiencing robust growth, projected to maintain a Compound Annual Growth Rate (CAGR) of 8.20% from 2025 to 2033. This expansion is driven by increasing consumer awareness of gut health's importance and the proven benefits of synbiotics in improving digestive health, boosting immunity, and promoting overall well-being. The market's segmentation reveals significant opportunities across various product types, with food and beverages holding a dominant position, followed by dietary supplements and animal feed. Distribution channels are diversifying, with online retail stores experiencing rapid growth alongside traditional pharmacies and supermarkets. Leading companies like United Naturals, Herbalife Nutrition, and others are capitalizing on this expanding market through product innovation and strategic partnerships, further fueling market expansion. Growth is geographically diverse, with North America and Europe currently holding significant market share, but the Asia-Pacific region is poised for substantial growth driven by rising disposable incomes and increasing health consciousness.
Synbiotic Product Market Market Size (In Billion)
The market's growth is further fueled by several key trends. The increasing prevalence of chronic diseases linked to gut health imbalances is a significant driver, creating a high demand for effective solutions. Furthermore, the growing adoption of personalized nutrition and functional foods is contributing to market expansion, as consumers seek targeted solutions to address their specific health needs. However, challenges remain, such as stringent regulatory requirements for synbiotic product approval and potential inconsistencies in product quality and efficacy across different brands. Overcoming these hurdles through enhanced research and development, improved product standardization, and effective regulatory compliance will be crucial for sustained market growth and consumer confidence. The long-term outlook for the synbiotic product market remains highly positive, driven by ongoing scientific research validating the health benefits of synbiotics and a growing consumer base actively seeking natural and effective solutions for their well-being.
Synbiotic Product Market Company Market Share
Synbiotic Product Market: A Comprehensive Report (2019-2033)
This comprehensive report provides an in-depth analysis of the global synbiotic product market, offering invaluable insights for industry stakeholders, investors, and strategic decision-makers. Covering the period from 2019 to 2033, with a focus on 2025, this report meticulously examines market dynamics, growth drivers, key players, and emerging opportunities within this rapidly expanding sector. The study period is 2019-2033, with 2025 as the base and estimated year, and 2025-2033 as the forecast period. The historical period analyzed is 2019-2024. The market size is estimated at xx Million in 2025 and is projected to reach xx Million by 2033. The CAGR during the forecast period is estimated at xx%.
Synbiotic Product Market Market Concentration & Dynamics
The global synbiotic product market exhibits a moderately concentrated landscape, with key players like United Naturals, Herbalife Nutrition Ltd, Daflorn Ltd, Sabinsa Corporation, Biomin America Inc, Yakult Honsha Co Inc, Seed Health Inc, Probiotical SpA, Chobani Global Holdings LLC, and Pfizer Inc holding significant market share. However, the market also features numerous smaller players, indicating a dynamic competitive environment.
- Market Concentration: The Herfindahl-Hirschman Index (HHI) is estimated at xx, suggesting a moderately concentrated market.
- Innovation Ecosystems: Significant R&D investment is driving innovation in synbiotic formulations, delivery systems (e.g., capsules, powders, beverages), and targeted applications (e.g., gut health, immunity).
- Regulatory Frameworks: Varying regulatory landscapes across different geographies impact market entry and product approval, influencing market growth and profitability.
- Substitute Products: Probiotics and prebiotics individually pose some level of competition, but synbiotics offer a synergistic advantage, leading to substantial growth potential.
- End-User Trends: Increasing consumer awareness of gut health, immunity, and overall wellness fuels demand for synbiotic products across various demographics.
- M&A Activities: The number of M&A deals within the synbiotic product market from 2019 to 2024 was approximately xx, indicating significant consolidation and strategic expansion within the industry. These activities predominantly involved larger companies acquiring smaller, innovative firms.
Synbiotic Product Market Industry Insights & Trends
The synbiotic product market is experiencing robust growth, propelled by several key factors. Rising consumer awareness of the gut-microbiome connection and the health benefits associated with synbiotics are significantly driving market expansion. Furthermore, technological advancements in formulation and delivery systems, coupled with growing demand from various sectors (food and beverage, dietary supplements, animal feed), contribute to market growth. The increasing prevalence of chronic diseases and the growing interest in preventative healthcare solutions further boost the demand for synbiotic products. The market is also witnessing the emergence of personalized synbiotic products tailored to individual gut microbiome profiles, representing a significant future trend. The market is also influenced by factors such as changing lifestyles, increased disposable income in emerging economies, and an expanding online retail sector.
Key Markets & Segments Leading Synbiotic Product Market
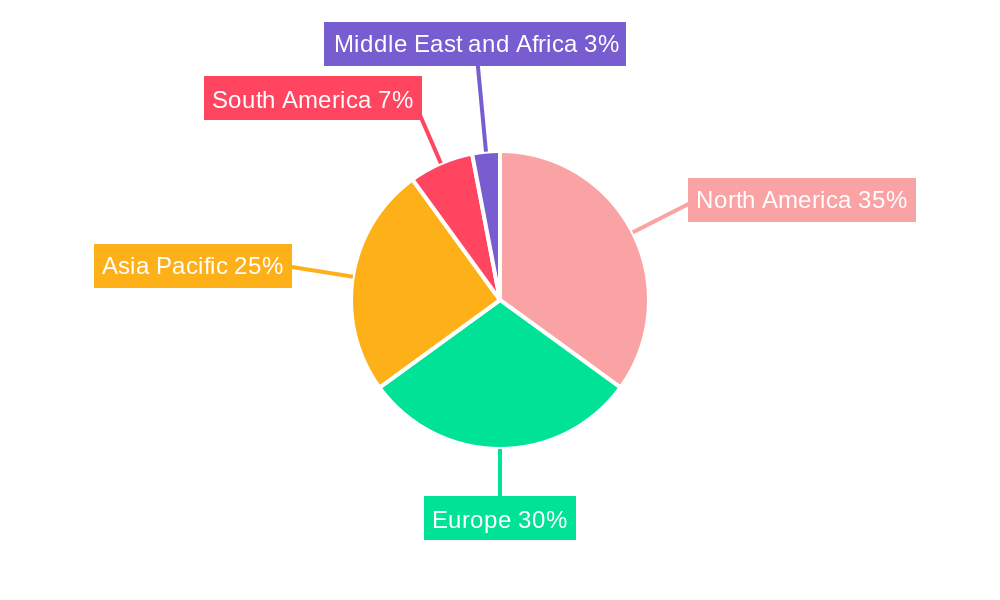
The dominant region for synbiotic product market growth is North America, followed by Europe. Within product types, dietary supplements dominate, driven by high consumer acceptance and the perceived health benefits. Regarding distribution channels, pharmacies and health stores hold a significant market share due to consumer trust and product availability. However, online retail stores are rapidly gaining traction, facilitated by ease of access and broader reach.
By Product Type:
- Dietary Supplements: High growth driven by consumer preference for convenient and targeted solutions.
- Food and Beverage: Significant growth driven by integration into functional foods and beverages.
- Animal Feed: Steady growth driven by increasing demand for animal health and productivity.
- Others: This segment includes cosmetic and personal care products with smaller market share.
By Distribution Channel:
- Pharmacies/ Health Stores: Strong market share due to trust and accessibility.
- Supermarkets/ Hypermarkets: Growing market share due to increased product availability.
- Online Retail Stores: Rapidly growing market share due to convenience and broader reach.
- Convenience Stores: Moderate growth, reflecting opportunistic purchases.
- Others: This includes direct sales and other niche distribution channels.
Drivers for Key Regions:
- North America: High consumer awareness, robust healthcare infrastructure, and high disposable income.
- Europe: Growing focus on preventative healthcare, regulatory support for functional foods, and considerable R&D activities.
- Asia-Pacific: Rapidly growing middle class, rising health consciousness, and considerable market potential.
Synbiotic Product Market Product Developments
Recent product innovations focus on enhanced efficacy, improved stability, targeted delivery mechanisms (e.g., liposomal encapsulation), and personalization based on individual microbiome profiles. The integration of synbiotics into novel food matrices and beverage formats enhances consumer appeal. These advancements are creating a competitive edge for manufacturers, driving market growth and differentiation. The development of synbiotics tailored for specific health conditions, like irritable bowel syndrome (IBS) and inflammatory bowel disease (IBD), is also gathering momentum.
Challenges in the Synbiotic Product Market Market
Significant challenges include stringent regulatory requirements for product approval and safety testing across different geographies, creating barriers to market entry. Supply chain complexities associated with sourcing high-quality raw materials and ensuring consistent product quality also pose a challenge. Furthermore, intense competition among established players and new entrants increases pressure on pricing and margins. These factors can cumulatively impact the market’s overall growth.
Forces Driving Synbiotic Product Market Growth
Key drivers include increasing consumer health awareness, particularly regarding gut health and immunity. Technological advancements in formulation and targeted delivery systems are enhancing product efficacy and consumer acceptance. Favorable regulatory frameworks in some regions are accelerating market entry and expansion. Furthermore, growing collaborations between research institutions and industry players are fostering innovation and fueling market growth.
Long-Term Growth Catalysts in Synbiotic Product Market
Long-term growth will be fueled by continued innovation in synbiotic formulations and delivery technologies, leading to improved efficacy and tailored solutions. Strategic partnerships between research institutions, ingredient suppliers, and product manufacturers will also accelerate market expansion. Expansion into new geographic markets, particularly in developing economies with rising health consciousness, will contribute significantly to long-term growth.
Emerging Opportunities in Synbiotic Product Market
Emerging opportunities include the development of personalized synbiotics based on individual gut microbiome profiles. Expanding into new applications, such as skin health and mental wellness, will also create significant opportunities. The development of sustainable and ethically sourced ingredients will also resonate with environmentally conscious consumers.
Leading Players in the Synbiotic Product Market Sector
- United Naturals
- Herbalife Nutrition Ltd
- Daflorn Ltd
- Sabinsa Corporation
- Biomin America Inc
- Yakult Honsha Co Inc
- Seed Health Inc
- Probiotical SpA
- Chobani Global Holdings LLC
- Pfizer Inc
Key Milestones in Synbiotic Product Market Industry
- 2020: Increased investment in R&D for personalized synbiotic products.
- 2021: Launch of several new synbiotic products with enhanced efficacy and targeted delivery mechanisms.
- 2022: Several key mergers and acquisitions reshaped the market landscape.
- 2023: Increased regulatory scrutiny on synbiotic product claims and labeling.
- 2024: Expansion of synbiotic applications beyond gut health into areas like skin and mental wellness.
Strategic Outlook for Synbiotic Product Market Market
The synbiotic product market exhibits robust growth potential, driven by several factors. Continued innovation in product formulation, personalized solutions, and strategic partnerships will be crucial for success. Expansion into emerging markets and applications will unlock substantial future market potential, offering significant opportunities for growth and profitability for industry players.
Synbiotic Product Market Segmentation
-
1. Product Type
-
1.1. Food and Beverage
- 1.1.1. Dairy
- 1.1.2. Beverages
- 1.1.3. Infant Foods
- 1.1.4. Others
- 1.2. Dietary Supplements
- 1.3. Animal Feed
-
1.1. Food and Beverage
-
2. Distribution Channel
- 2.1. Pharmacies/ Health Stores
- 2.2. Supermarkets/ Hypermarkets
- 2.3. Convenience Stores
- 2.4. Online Retail Stores
- 2.5. Others
Synbiotic Product Market Segmentation By Geography
-
1. North America
- 1.1. United States
- 1.2. Canada
- 1.3. Mexico
- 1.4. Rest of North America
-
2. Europe
- 2.1. United Kingdom
- 2.2. Germany
- 2.3. France
- 2.4. Russia
- 2.5. Italy
- 2.6. Spain
- 2.7. Rest of Europe
-
3. Asia Pacific
- 3.1. India
- 3.2. China
- 3.3. Japan
- 3.4. Australia
- 3.5. Rest of Asia Pacific
-
4. South America
- 4.1. Brazil
- 4.2. Argentina
- 4.3. Rest of South America
-
5. Middle East and Africa
- 5.1. Saudi Arabia
- 5.2. South Africa
- 5.3. Rest of Middle East and Africa
Synbiotic Product Market Regional Market Share
Geographic Coverage of Synbiotic Product Market
Synbiotic Product Market REPORT HIGHLIGHTS
| Aspects | Details |
|---|---|
| Study Period | 2020-2034 |
| Base Year | 2025 |
| Estimated Year | 2026 |
| Forecast Period | 2026-2034 |
| Historical Period | 2020-2025 |
| Growth Rate | CAGR of 8.2% from 2020-2034 |
| Segmentation |
|
Table of Contents
- 1. Introduction
- 1.1. Research Scope
- 1.2. Market Segmentation
- 1.3. Research Objective
- 1.4. Definitions and Assumptions
- 2. Executive Summary
- 2.1. Market Snapshot
- 3. Market Dynamics
- 3.1. Market Drivers
- 3.2. Market Restrains
- 3.3. Market Trends
- 3.4. Market Opportunities
- 4. Market Factor Analysis
- 4.1. Porters Five Forces
- 4.1.1. Bargaining Power of Suppliers
- 4.1.2. Bargaining Power of Buyers
- 4.1.3. Threat of New Entrants
- 4.1.4. Threat of Substitutes
- 4.1.5. Competitive Rivalry
- 4.2. PESTEL analysis
- 4.3. BCG Analysis
- 4.3.1. Stars (High Growth, High Market Share)
- 4.3.2. Cash Cows (Low Growth, High Market Share)
- 4.3.3. Question Mark (High Growth, Low Market Share)
- 4.3.4. Dogs (Low Growth, Low Market Share)
- 4.4. Ansoff Matrix Analysis
- 4.5. Supply Chain Analysis
- 4.6. Regulatory Landscape
- 4.7. Current Market Potential and Opportunity Assessment (TAM–SAM–SOM Framework)
- 4.8. MSR Analyst Note
- 4.1. Porters Five Forces
- 5. Market Analysis, Insights and Forecast 2021-2033
- 5.1. Market Analysis, Insights and Forecast - by Product Type
- 5.1.1. Food and Beverage
- 5.1.1.1. Dairy
- 5.1.1.2. Beverages
- 5.1.1.3. Infant Foods
- 5.1.1.4. Others
- 5.1.2. Dietary Supplements
- 5.1.3. Animal Feed
- 5.1.1. Food and Beverage
- 5.2. Market Analysis, Insights and Forecast - by Distribution Channel
- 5.2.1. Pharmacies/ Health Stores
- 5.2.2. Supermarkets/ Hypermarkets
- 5.2.3. Convenience Stores
- 5.2.4. Online Retail Stores
- 5.2.5. Others
- 5.3. Market Analysis, Insights and Forecast - by Region
- 5.3.1. North America
- 5.3.2. Europe
- 5.3.3. Asia Pacific
- 5.3.4. South America
- 5.3.5. Middle East and Africa
- 5.1. Market Analysis, Insights and Forecast - by Product Type
- 6. Global Synbiotic Product Market Analysis, Insights and Forecast, 2021-2033
- 6.1. Market Analysis, Insights and Forecast - by Product Type
- 6.1.1. Food and Beverage
- 6.1.1.1. Dairy
- 6.1.1.2. Beverages
- 6.1.1.3. Infant Foods
- 6.1.1.4. Others
- 6.1.2. Dietary Supplements
- 6.1.3. Animal Feed
- 6.1.1. Food and Beverage
- 6.2. Market Analysis, Insights and Forecast - by Distribution Channel
- 6.2.1. Pharmacies/ Health Stores
- 6.2.2. Supermarkets/ Hypermarkets
- 6.2.3. Convenience Stores
- 6.2.4. Online Retail Stores
- 6.2.5. Others
- 6.1. Market Analysis, Insights and Forecast - by Product Type
- 7. North America Synbiotic Product Market Analysis, Insights and Forecast, 2020-2032
- 7.1. Market Analysis, Insights and Forecast - by Product Type
- 7.1.1. Food and Beverage
- 7.1.1.1. Dairy
- 7.1.1.2. Beverages
- 7.1.1.3. Infant Foods
- 7.1.1.4. Others
- 7.1.2. Dietary Supplements
- 7.1.3. Animal Feed
- 7.1.1. Food and Beverage
- 7.2. Market Analysis, Insights and Forecast - by Distribution Channel
- 7.2.1. Pharmacies/ Health Stores
- 7.2.2. Supermarkets/ Hypermarkets
- 7.2.3. Convenience Stores
- 7.2.4. Online Retail Stores
- 7.2.5. Others
- 7.1. Market Analysis, Insights and Forecast - by Product Type
- 8. Europe Synbiotic Product Market Analysis, Insights and Forecast, 2020-2032
- 8.1. Market Analysis, Insights and Forecast - by Product Type
- 8.1.1. Food and Beverage
- 8.1.1.1. Dairy
- 8.1.1.2. Beverages
- 8.1.1.3. Infant Foods
- 8.1.1.4. Others
- 8.1.2. Dietary Supplements
- 8.1.3. Animal Feed
- 8.1.1. Food and Beverage
- 8.2. Market Analysis, Insights and Forecast - by Distribution Channel
- 8.2.1. Pharmacies/ Health Stores
- 8.2.2. Supermarkets/ Hypermarkets
- 8.2.3. Convenience Stores
- 8.2.4. Online Retail Stores
- 8.2.5. Others
- 8.1. Market Analysis, Insights and Forecast - by Product Type
- 9. Asia Pacific Synbiotic Product Market Analysis, Insights and Forecast, 2020-2032
- 9.1. Market Analysis, Insights and Forecast - by Product Type
- 9.1.1. Food and Beverage
- 9.1.1.1. Dairy
- 9.1.1.2. Beverages
- 9.1.1.3. Infant Foods
- 9.1.1.4. Others
- 9.1.2. Dietary Supplements
- 9.1.3. Animal Feed
- 9.1.1. Food and Beverage
- 9.2. Market Analysis, Insights and Forecast - by Distribution Channel
- 9.2.1. Pharmacies/ Health Stores
- 9.2.2. Supermarkets/ Hypermarkets
- 9.2.3. Convenience Stores
- 9.2.4. Online Retail Stores
- 9.2.5. Others
- 9.1. Market Analysis, Insights and Forecast - by Product Type
- 10. South America Synbiotic Product Market Analysis, Insights and Forecast, 2020-2032
- 10.1. Market Analysis, Insights and Forecast - by Product Type
- 10.1.1. Food and Beverage
- 10.1.1.1. Dairy
- 10.1.1.2. Beverages
- 10.1.1.3. Infant Foods
- 10.1.1.4. Others
- 10.1.2. Dietary Supplements
- 10.1.3. Animal Feed
- 10.1.1. Food and Beverage
- 10.2. Market Analysis, Insights and Forecast - by Distribution Channel
- 10.2.1. Pharmacies/ Health Stores
- 10.2.2. Supermarkets/ Hypermarkets
- 10.2.3. Convenience Stores
- 10.2.4. Online Retail Stores
- 10.2.5. Others
- 10.1. Market Analysis, Insights and Forecast - by Product Type
- 11. Middle East and Africa Synbiotic Product Market Analysis, Insights and Forecast, 2020-2032
- 11.1. Market Analysis, Insights and Forecast - by Product Type
- 11.1.1. Food and Beverage
- 11.1.1.1. Dairy
- 11.1.1.2. Beverages
- 11.1.1.3. Infant Foods
- 11.1.1.4. Others
- 11.1.2. Dietary Supplements
- 11.1.3. Animal Feed
- 11.1.1. Food and Beverage
- 11.2. Market Analysis, Insights and Forecast - by Distribution Channel
- 11.2.1. Pharmacies/ Health Stores
- 11.2.2. Supermarkets/ Hypermarkets
- 11.2.3. Convenience Stores
- 11.2.4. Online Retail Stores
- 11.2.5. Others
- 11.1. Market Analysis, Insights and Forecast - by Product Type
- 12. Competitive Analysis
- 12.1. Company Profiles
- 12.1.1 United Naturals
- 12.1.1.1. Company Overview
- 12.1.1.2. Products
- 12.1.1.3. Company Financials
- 12.1.1.4. SWOT Analysis
- 12.1.2 Herbalife Nutrition Ltd
- 12.1.2.1. Company Overview
- 12.1.2.2. Products
- 12.1.2.3. Company Financials
- 12.1.2.4. SWOT Analysis
- 12.1.3 Daflorn Ltd *List Not Exhaustive
- 12.1.3.1. Company Overview
- 12.1.3.2. Products
- 12.1.3.3. Company Financials
- 12.1.3.4. SWOT Analysis
- 12.1.4 Sabinsa Corporation
- 12.1.4.1. Company Overview
- 12.1.4.2. Products
- 12.1.4.3. Company Financials
- 12.1.4.4. SWOT Analysis
- 12.1.5 Biomin America Inc
- 12.1.5.1. Company Overview
- 12.1.5.2. Products
- 12.1.5.3. Company Financials
- 12.1.5.4. SWOT Analysis
- 12.1.6 Yakult Honsha Co Inc
- 12.1.6.1. Company Overview
- 12.1.6.2. Products
- 12.1.6.3. Company Financials
- 12.1.6.4. SWOT Analysis
- 12.1.7 Seed Health Inc
- 12.1.7.1. Company Overview
- 12.1.7.2. Products
- 12.1.7.3. Company Financials
- 12.1.7.4. SWOT Analysis
- 12.1.8 Probiotical SpA
- 12.1.8.1. Company Overview
- 12.1.8.2. Products
- 12.1.8.3. Company Financials
- 12.1.8.4. SWOT Analysis
- 12.1.9 Chobani Global Holdings LLC
- 12.1.9.1. Company Overview
- 12.1.9.2. Products
- 12.1.9.3. Company Financials
- 12.1.9.4. SWOT Analysis
- 12.1.10 Pfizer Inc
- 12.1.10.1. Company Overview
- 12.1.10.2. Products
- 12.1.10.3. Company Financials
- 12.1.10.4. SWOT Analysis
- 12.1.1 United Naturals
- 12.2. Market Entropy
- 12.2.1 Company's Key Areas Served
- 12.2.2 Recent Developments
- 12.3. Company Market Share Analysis 2025
- 12.3.1 Top 5 Companies Market Share Analysis
- 12.3.2 Top 3 Companies Market Share Analysis
- 12.4. List of Potential Customers
- 13. Research Methodology
List of Figures
- Figure 1: Global Synbiotic Product Market Revenue Breakdown (billion, %) by Region 2025 & 2033
- Figure 2: North America Synbiotic Product Market Revenue (billion), by Product Type 2025 & 2033
- Figure 3: North America Synbiotic Product Market Revenue Share (%), by Product Type 2025 & 2033
- Figure 4: North America Synbiotic Product Market Revenue (billion), by Distribution Channel 2025 & 2033
- Figure 5: North America Synbiotic Product Market Revenue Share (%), by Distribution Channel 2025 & 2033
- Figure 6: North America Synbiotic Product Market Revenue (billion), by Country 2025 & 2033
- Figure 7: North America Synbiotic Product Market Revenue Share (%), by Country 2025 & 2033
- Figure 8: Europe Synbiotic Product Market Revenue (billion), by Product Type 2025 & 2033
- Figure 9: Europe Synbiotic Product Market Revenue Share (%), by Product Type 2025 & 2033
- Figure 10: Europe Synbiotic Product Market Revenue (billion), by Distribution Channel 2025 & 2033
- Figure 11: Europe Synbiotic Product Market Revenue Share (%), by Distribution Channel 2025 & 2033
- Figure 12: Europe Synbiotic Product Market Revenue (billion), by Country 2025 & 2033
- Figure 13: Europe Synbiotic Product Market Revenue Share (%), by Country 2025 & 2033
- Figure 14: Asia Pacific Synbiotic Product Market Revenue (billion), by Product Type 2025 & 2033
- Figure 15: Asia Pacific Synbiotic Product Market Revenue Share (%), by Product Type 2025 & 2033
- Figure 16: Asia Pacific Synbiotic Product Market Revenue (billion), by Distribution Channel 2025 & 2033
- Figure 17: Asia Pacific Synbiotic Product Market Revenue Share (%), by Distribution Channel 2025 & 2033
- Figure 18: Asia Pacific Synbiotic Product Market Revenue (billion), by Country 2025 & 2033
- Figure 19: Asia Pacific Synbiotic Product Market Revenue Share (%), by Country 2025 & 2033
- Figure 20: South America Synbiotic Product Market Revenue (billion), by Product Type 2025 & 2033
- Figure 21: South America Synbiotic Product Market Revenue Share (%), by Product Type 2025 & 2033
- Figure 22: South America Synbiotic Product Market Revenue (billion), by Distribution Channel 2025 & 2033
- Figure 23: South America Synbiotic Product Market Revenue Share (%), by Distribution Channel 2025 & 2033
- Figure 24: South America Synbiotic Product Market Revenue (billion), by Country 2025 & 2033
- Figure 25: South America Synbiotic Product Market Revenue Share (%), by Country 2025 & 2033
- Figure 26: Middle East and Africa Synbiotic Product Market Revenue (billion), by Product Type 2025 & 2033
- Figure 27: Middle East and Africa Synbiotic Product Market Revenue Share (%), by Product Type 2025 & 2033
- Figure 28: Middle East and Africa Synbiotic Product Market Revenue (billion), by Distribution Channel 2025 & 2033
- Figure 29: Middle East and Africa Synbiotic Product Market Revenue Share (%), by Distribution Channel 2025 & 2033
- Figure 30: Middle East and Africa Synbiotic Product Market Revenue (billion), by Country 2025 & 2033
- Figure 31: Middle East and Africa Synbiotic Product Market Revenue Share (%), by Country 2025 & 2033
List of Tables
- Table 1: Global Synbiotic Product Market Revenue billion Forecast, by Product Type 2020 & 2033
- Table 2: Global Synbiotic Product Market Revenue billion Forecast, by Distribution Channel 2020 & 2033
- Table 3: Global Synbiotic Product Market Revenue billion Forecast, by Region 2020 & 2033
- Table 4: Global Synbiotic Product Market Revenue billion Forecast, by Product Type 2020 & 2033
- Table 5: Global Synbiotic Product Market Revenue billion Forecast, by Distribution Channel 2020 & 2033
- Table 6: Global Synbiotic Product Market Revenue billion Forecast, by Country 2020 & 2033
- Table 7: United States Synbiotic Product Market Revenue (billion) Forecast, by Application 2020 & 2033
- Table 8: Canada Synbiotic Product Market Revenue (billion) Forecast, by Application 2020 & 2033
- Table 9: Mexico Synbiotic Product Market Revenue (billion) Forecast, by Application 2020 & 2033
- Table 10: Rest of North America Synbiotic Product Market Revenue (billion) Forecast, by Application 2020 & 2033
- Table 11: Global Synbiotic Product Market Revenue billion Forecast, by Product Type 2020 & 2033
- Table 12: Global Synbiotic Product Market Revenue billion Forecast, by Distribution Channel 2020 & 2033
- Table 13: Global Synbiotic Product Market Revenue billion Forecast, by Country 2020 & 2033
- Table 14: United Kingdom Synbiotic Product Market Revenue (billion) Forecast, by Application 2020 & 2033
- Table 15: Germany Synbiotic Product Market Revenue (billion) Forecast, by Application 2020 & 2033
- Table 16: France Synbiotic Product Market Revenue (billion) Forecast, by Application 2020 & 2033
- Table 17: Russia Synbiotic Product Market Revenue (billion) Forecast, by Application 2020 & 2033
- Table 18: Italy Synbiotic Product Market Revenue (billion) Forecast, by Application 2020 & 2033
- Table 19: Spain Synbiotic Product Market Revenue (billion) Forecast, by Application 2020 & 2033
- Table 20: Rest of Europe Synbiotic Product Market Revenue (billion) Forecast, by Application 2020 & 2033
- Table 21: Global Synbiotic Product Market Revenue billion Forecast, by Product Type 2020 & 2033
- Table 22: Global Synbiotic Product Market Revenue billion Forecast, by Distribution Channel 2020 & 2033
- Table 23: Global Synbiotic Product Market Revenue billion Forecast, by Country 2020 & 2033
- Table 24: India Synbiotic Product Market Revenue (billion) Forecast, by Application 2020 & 2033
- Table 25: China Synbiotic Product Market Revenue (billion) Forecast, by Application 2020 & 2033
- Table 26: Japan Synbiotic Product Market Revenue (billion) Forecast, by Application 2020 & 2033
- Table 27: Australia Synbiotic Product Market Revenue (billion) Forecast, by Application 2020 & 2033
- Table 28: Rest of Asia Pacific Synbiotic Product Market Revenue (billion) Forecast, by Application 2020 & 2033
- Table 29: Global Synbiotic Product Market Revenue billion Forecast, by Product Type 2020 & 2033
- Table 30: Global Synbiotic Product Market Revenue billion Forecast, by Distribution Channel 2020 & 2033
- Table 31: Global Synbiotic Product Market Revenue billion Forecast, by Country 2020 & 2033
- Table 32: Brazil Synbiotic Product Market Revenue (billion) Forecast, by Application 2020 & 2033
- Table 33: Argentina Synbiotic Product Market Revenue (billion) Forecast, by Application 2020 & 2033
- Table 34: Rest of South America Synbiotic Product Market Revenue (billion) Forecast, by Application 2020 & 2033
- Table 35: Global Synbiotic Product Market Revenue billion Forecast, by Product Type 2020 & 2033
- Table 36: Global Synbiotic Product Market Revenue billion Forecast, by Distribution Channel 2020 & 2033
- Table 37: Global Synbiotic Product Market Revenue billion Forecast, by Country 2020 & 2033
- Table 38: Saudi Arabia Synbiotic Product Market Revenue (billion) Forecast, by Application 2020 & 2033
- Table 39: South Africa Synbiotic Product Market Revenue (billion) Forecast, by Application 2020 & 2033
- Table 40: Rest of Middle East and Africa Synbiotic Product Market Revenue (billion) Forecast, by Application 2020 & 2033
Frequently Asked Questions
1. What is the projected Compound Annual Growth Rate (CAGR) of the Synbiotic Product Market?
The projected CAGR is approximately 8.2%.
2. Which companies are prominent players in the Synbiotic Product Market?
Key companies in the market include United Naturals, Herbalife Nutrition Ltd, Daflorn Ltd *List Not Exhaustive, Sabinsa Corporation, Biomin America Inc, Yakult Honsha Co Inc, Seed Health Inc, Probiotical SpA, Chobani Global Holdings LLC, Pfizer Inc.
3. What are the main segments of the Synbiotic Product Market?
The market segments include Product Type, Distribution Channel.
4. Can you provide details about the market size?
The market size is estimated to be USD 14.78 billion as of 2022.
5. What are some drivers contributing to market growth?
Increasing Demand for Protein-Rich Food; Increasing Demand for Plant-Based and Organic Ingredients.
6. What are the notable trends driving market growth?
Rising Demand For Probiotics And Prebiotics as Functional Food.
7. Are there any restraints impacting market growth?
Presence of Alternative Proteins.
8. Can you provide examples of recent developments in the market?
N/A
9. What pricing options are available for accessing the report?
Pricing options include single-user, multi-user, and enterprise licenses priced at USD 4750, USD 5250, and USD 8750 respectively.
10. Is the market size provided in terms of value or volume?
The market size is provided in terms of value, measured in billion.
11. Are there any specific market keywords associated with the report?
Yes, the market keyword associated with the report is "Synbiotic Product Market," which aids in identifying and referencing the specific market segment covered.
12. How do I determine which pricing option suits my needs best?
The pricing options vary based on user requirements and access needs. Individual users may opt for single-user licenses, while businesses requiring broader access may choose multi-user or enterprise licenses for cost-effective access to the report.
13. Are there any additional resources or data provided in the Synbiotic Product Market report?
While the report offers comprehensive insights, it's advisable to review the specific contents or supplementary materials provided to ascertain if additional resources or data are available.
14. How can I stay updated on further developments or reports in the Synbiotic Product Market?
To stay informed about further developments, trends, and reports in the Synbiotic Product Market, consider subscribing to industry newsletters, following relevant companies and organizations, or regularly checking reputable industry news sources and publications.
Methodology
Step 1 - Identification of Relevant Samples Size from Population Database


Step 2 - Approaches for Defining Global Market Size (Value, Volume* & Price*)

Note*: In applicable scenarios
Step 3 - Data Sources
Primary Research
- Web Analytics
- Survey Reports
- Research Institute
- Latest Research Reports
- Opinion Leaders
Secondary Research
- Annual Reports
- White Paper
- Latest Press Release
- Industry Association
- Paid Database
- Investor Presentations

Step 4 - Data Triangulation
Involves using different sources of information in order to increase the validity of a study
These sources are likely to be stakeholders in a program - participants, other researchers, program staff, other community members, and so on.
Then we put all data in single framework & apply various statistical tools to find out the dynamic on the market.
During the analysis stage, feedback from the stakeholder groups would be compared to determine areas of agreement as well as areas of divergence