

Key Insights
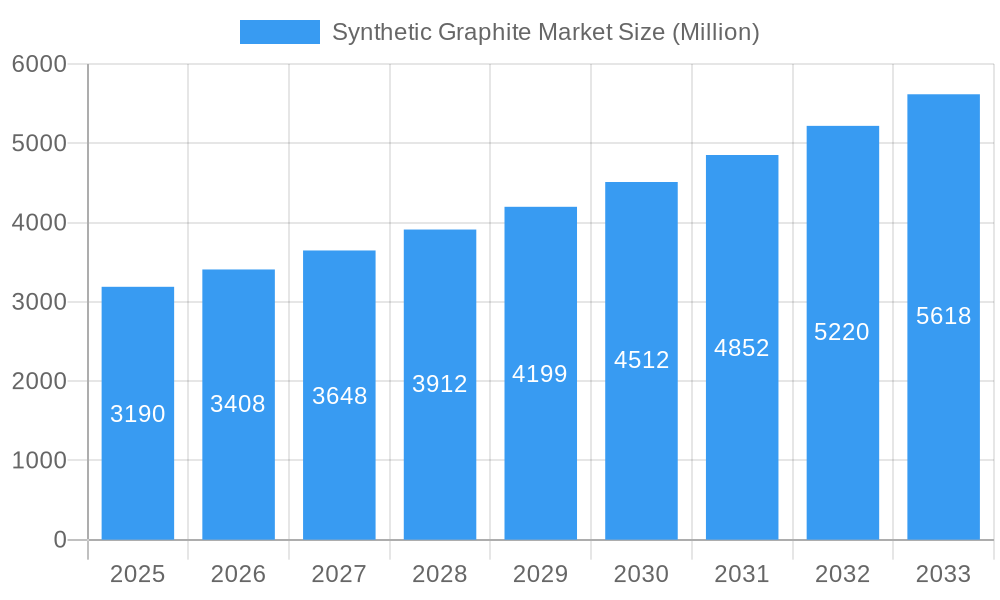
The global synthetic graphite market, valued at $3.19 billion in 2025, is projected to experience robust growth, driven by the increasing demand for high-performance batteries in electric vehicles (EVs) and energy storage systems (ESS). The market's Compound Annual Growth Rate (CAGR) of 6.83% from 2025 to 2033 reflects this strong upward trajectory. Key growth drivers include the global shift towards renewable energy, the burgeoning EV industry, and advancements in battery technology requiring high-quality synthetic graphite. The dominant segments are graphite anodes for batteries and graphite blocks used in metallurgical applications, each benefiting from the technological advancements and expanding end-use sectors. While supply chain disruptions and fluctuating raw material prices present some challenges, the long-term outlook remains positive, fueled by continuous innovation and government incentives supporting the adoption of electric vehicles and renewable energy infrastructure. The Asia-Pacific region, particularly China, is expected to dominate the market due to its robust manufacturing base, high EV adoption rates, and established battery production capabilities. However, North America and Europe are also anticipated to witness significant growth, driven by substantial investments in EV infrastructure and growing environmental consciousness. Competition amongst major players like Mersen Property, Asbury Carbons, and others is intense, driving innovation and efficiency improvements across the value chain.
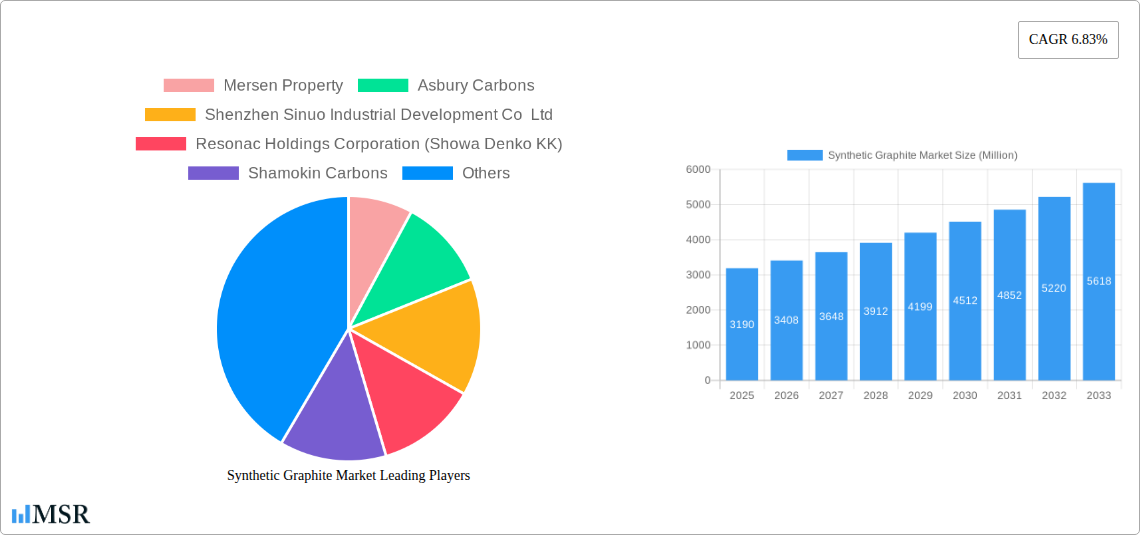
Synthetic Graphite Market Market Size (In Billion)
The market segmentation reveals a dynamic landscape. The battery application segment is expected to witness exponential growth, exceeding the growth rate of other applications. Within the types segment, graphite anodes are predicted to dominate due to their crucial role in battery performance. The continued expansion of the EV market and the growing demand for grid-scale energy storage solutions will be the primary drivers for this segment’s growth. Metallurgical applications, while significant, are expected to exhibit more moderate growth compared to the battery sector. This disparity highlights the transformative impact of the energy transition on the synthetic graphite market. The forecast period anticipates substantial market expansion, with consistent growth driven by both increased demand and technological enhancements within the battery sector, thereby solidifying synthetic graphite's pivotal role in the clean energy revolution.
Synthetic Graphite Market Company Market Share
Synthetic Graphite Market: A Comprehensive Report (2019-2033)
This in-depth report provides a comprehensive analysis of the Synthetic Graphite Market, covering market dynamics, industry trends, key segments, leading players, and future opportunities. With a study period spanning 2019-2033, a base year of 2025, and a forecast period of 2025-2033, this report offers invaluable insights for industry stakeholders, investors, and strategic decision-makers. The report leverages rigorous data analysis and incorporates real-world examples to offer actionable intelligence. The global Synthetic Graphite Market is projected to reach xx Million by 2033, exhibiting a CAGR of xx% during the forecast period.
Synthetic Graphite Market Market Concentration & Dynamics
The Synthetic Graphite market is characterized by a moderately concentrated landscape, where several prominent players command significant market share. Factors such as substantial economies of scale in production, continuous technological advancements, and secure access to critical raw materials play a crucial role in shaping this concentration. The industry thrives on a dynamic innovation ecosystem, fueled by relentless research and development efforts, particularly in the realms of advanced materials and next-generation battery technologies. A defining aspect of the competitive environment is the increasing influence of stringent environmental regulations, with a particular focus on reducing carbon emissions and implementing robust waste management practices. The market also navigates a moderate level of competitive pressure from substitute products, including other carbon-based materials and alternative battery chemistries. Crucially, end-user trends, spearheaded by the exponential growth of the electric vehicle (EV) sector and the escalating demand for high-capacity batteries, are the primary catalysts for market expansion.
- Market Share: The top 5 players collectively held approximately XX% of the global synthetic graphite market share in 2024.
- M&A Deal Counts: An estimated XX mergers and acquisitions (M&A) deals were recorded in the synthetic graphite sector between 2019 and 2024, indicating active consolidation and strategic expansion within the industry.
Synthetic Graphite Market Industry Insights & Trends
The Synthetic Graphite market is currently experiencing a phase of robust growth, propelled by the burgeoning demand from a diverse range of end-use sectors. The widespread adoption of electric vehicles (EVs) stands out as a principal driver, significantly elevating the requirement for high-performance graphite anodes essential for lithium-ion batteries. Complementing this, technological advancements, including enhancements in production processes and the development of graphite materials with superior energy density, are further fueling market expansion. Moreover, a growing consumer preference for sustainable and environmentally friendly products is increasingly influencing market dynamics. The global Synthetic Graphite market size was valued at XX Million USD in 2024 and is projected to reach XX Million USD by 2033, exhibiting a compound annual growth rate (CAGR) of approximately XX%. This impressive growth trajectory is largely attributed to the expanding battery energy storage system (BESS) market and the increasing utilization of graphite in a multitude of industrial applications. Furthermore, supportive government initiatives aimed at promoting the adoption of renewable energy technologies are providing a significant impetus to demand.
Key Markets & Segments Leading Synthetic Graphite Market
The Asia-Pacific region is the undisputed leader in the Synthetic Graphite market. This dominance is underpinned by rapid industrialization, the flourishing electronics industry, and substantial investments in renewable energy projects across key economies like China and Japan. Within the market segmentation, the Graphite Anode segment commands the largest share in terms of product type, primarily due to its indispensable role in lithium-ion batteries. The Batteries application segment also leads by market value, reflecting the escalating demand for advanced energy storage solutions across various industries, from consumer electronics to grid-scale storage.
Key Growth Drivers:
-
Type:
- Graphite Anode: Experiencing robust demand from the rapidly expanding lithium-ion battery industry, driven by EVs and consumer electronics.
- Graphite Block (Fine Carbon): Essential for high-temperature applications in metallurgy, including steel and non-ferrous metal production.
- Other Types (Graphite Electrode, etc.): Witnessing growing applications in specialized industrial sectors such as aerospace and chemical processing.
-
Application:
- Batteries: The dominant segment, propelled by the burgeoning electric vehicle (EV) market and the critical need for energy storage systems.
- Metallurgy: Sustained and consistent demand from various high-temperature metallurgical processes, including steelmaking and foundries.
- Parts and Components: Increasing use in specialized components for diverse industries, requiring high thermal and electrical conductivity.
- Nuclear: Holds niche but critical applications within nuclear reactors, necessitating high purity and specific structural properties.
- Other Applications: Emerging and expanding uses in sectors like advanced composites, lubricants, and thermal management solutions.
Dominance Analysis: The Asia-Pacific region's leadership is a strategic outcome of its formidable manufacturing capabilities, access to a skilled workforce, and supportive government policies that actively foster the growth of the battery and renewable energy sectors.
Synthetic Graphite Market Product Developments
Recent advancements in synthetic graphite production techniques have resulted in improved material properties, including higher purity, enhanced conductivity, and increased capacity. These improvements lead to better-performing batteries and more efficient industrial applications. Innovations in material synthesis and processing are creating a competitive edge for manufacturers, resulting in the development of more cost-effective and high-performance synthetic graphite products. These advancements cater to the growing demand for high-performance materials in various sectors, further driving market growth.
Challenges in the Synthetic Graphite Market Market
The Synthetic Graphite market faces challenges like fluctuating raw material prices, volatile energy costs, and intense competition from both domestic and international players. Supply chain disruptions caused by geopolitical events and the COVID-19 pandemic have further exacerbated these challenges. Regulatory hurdles regarding environmental compliance and stringent safety standards also add to the market complexities. These challenges affect profitability and lead times. For example, a xx% increase in raw material costs in 2022 resulted in a xx% decrease in overall industry profit margin.
Forces Driving Synthetic Graphite Market Growth
The growth of the Synthetic Graphite market is propelled by several key factors. The increasing adoption of electric vehicles (EVs) and the burgeoning renewable energy sector are major drivers. Technological advancements leading to higher capacity and performance batteries are fueling further expansion. Government regulations promoting clean energy technologies and supportive policies regarding battery production are also significantly impacting growth. The expanding demand for energy storage systems (ESS) is also contributing to market expansion.
Long-Term Growth Catalysts in Synthetic Graphite Market
Long-term growth in the Synthetic Graphite market will be driven by continuous innovation in materials science, particularly in developing higher energy density and longer-lasting batteries. Strategic partnerships and collaborations between manufacturers, technology providers, and end-users will facilitate the development and deployment of innovative solutions. Expansion into new markets, especially in developing economies with growing energy demands, will also contribute to long-term growth. This could see the market reach xx Million by 2033.
Emerging Opportunities in Synthetic Graphite Market
Emerging opportunities exist in the development of next-generation batteries with improved energy density and cycle life. The increasing use of synthetic graphite in specialized applications, such as aerospace and defense, presents significant growth prospects. Furthermore, advancements in recycling technologies to recover and reuse graphite materials will reduce environmental impact and resource consumption, further driving market expansion.
Leading Players in the Synthetic Graphite Market Sector
- Mersen Property
- Asbury Carbons
- Shenzhen Sinuo Industrial Development Co Ltd
- Resonac Holdings Corporation (Showa Denko KK)
- Shamokin Carbons
- Mitsubishi Chemical Corporation
- Nippon Carbon Co Ltd
- Jiangxi Zichen Technology Co Ltd
- Tokai Cobex GmbH
- GrafTech International
- BTR New Materials Group Co Ltd
- Imerys
- Shanghai Shanshan Technology Co Ltd
- Graphit Kropfmühl GmbH
- Graphite India Limited
- Lianyungang Jinli Carbon Co Ltd
Key Milestones in Synthetic Graphite Market Industry
October 2022: Imerys Imerys Graphite & Carbon Company announced the launch of the EMILI Project, a landmark lithium exploitation project aimed at reducing lithium imports and boosting EV battery production (nearly 700,000 batteries annually). This significantly impacts the market by reducing reliance on imported materials and creating a more stable supply chain for battery production.
April 2022: Shanghai Shanshan Lithium Battery Material Technology Co. Ltd. secured USD 477 Million in investment from Wending Investment, BYD, Amperex Technology Limited (ATL), and the Kunlun Fund. This substantial investment fuels further expansion in battery materials production, reinforcing the growth of the synthetic graphite market.
Strategic Outlook for Synthetic Graphite Market Market
The outlook for the Synthetic Graphite market is decidedly promising, with substantial growth anticipated over the next decade. This optimistic trajectory is further bolstered by continuous innovation in battery technology, the insatiable demand from the burgeoning electric vehicle and energy storage solutions sectors, and the formation of strategic partnerships. Companies that proactively focus on adopting sustainable production methods, optimizing their supply chain efficiencies, and investing in the development of high-performance materials are strategically positioned to thrive in this dynamic and evolving market. The long-term prospects indicate significant potential for continued market expansion and the penetration of synthetic graphite into new and emerging applications.
Synthetic Graphite Market Segmentation
-
1. Type
- 1.1. Graphite Anode
- 1.2. Graphite Block (Fine Carbon)
- 1.3. Other Types (Graphite Electrode, etc.)
-
2. Application
- 2.1. Metallurgy
- 2.2. Parts and Components
- 2.3. Batteries
- 2.4. Nuclear
- 2.5. Other Applications
Synthetic Graphite Market Segmentation By Geography
-
1. Asia Pacific
- 1.1. China
- 1.2. India
- 1.3. Japan
- 1.4. South Korea
- 1.5. Asean Countries
- 1.6. Rest of Asia Pacific
-
2. North America
- 2.1. United States
- 2.2. Canada
- 2.3. Mexico
-
3. Europe
- 3.1. Germany
- 3.2. United Kingdom
- 3.3. Italy
- 3.4. France
- 3.5. Russia
- 3.6. Rest of Europe
-
4. South America
- 4.1. Brazil
- 4.2. Argentina
- 4.3. Rest of South America
-
5. Middle East and Africa
- 5.1. Saudi Arabia
- 5.2. South Africa
- 5.3. Rest of Middle East and Africa
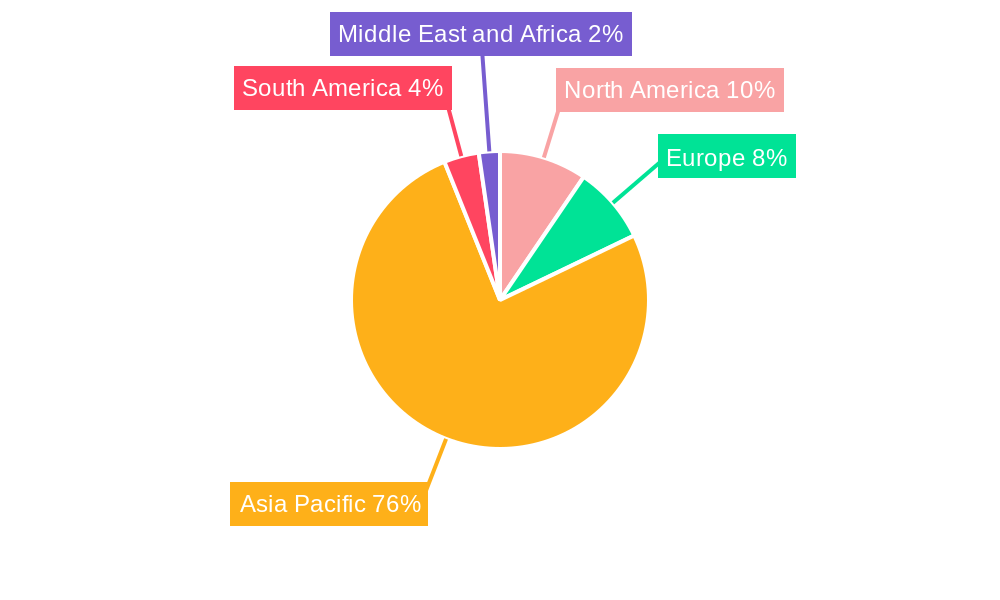
Synthetic Graphite Market Regional Market Share
Geographic Coverage of Synthetic Graphite Market
Synthetic Graphite Market REPORT HIGHLIGHTS
| Aspects | Details |
|---|---|
| Study Period | 2020-2034 |
| Base Year | 2025 |
| Estimated Year | 2026 |
| Forecast Period | 2026-2034 |
| Historical Period | 2020-2025 |
| Growth Rate | CAGR of 15.1% from 2020-2034 |
| Segmentation |
|
Table of Contents
- 1. Introduction
- 1.1. Research Scope
- 1.2. Market Segmentation
- 1.3. Research Objective
- 1.4. Definitions and Assumptions
- 2. Executive Summary
- 2.1. Market Snapshot
- 3. Market Dynamics
- 3.1. Market Drivers
- 3.2. Market Restrains
- 3.3. Market Trends
- 3.4. Market Opportunities
- 4. Market Factor Analysis
- 4.1. Porters Five Forces
- 4.1.1. Bargaining Power of Suppliers
- 4.1.2. Bargaining Power of Buyers
- 4.1.3. Threat of New Entrants
- 4.1.4. Threat of Substitutes
- 4.1.5. Competitive Rivalry
- 4.2. PESTEL analysis
- 4.3. BCG Analysis
- 4.3.1. Stars (High Growth, High Market Share)
- 4.3.2. Cash Cows (Low Growth, High Market Share)
- 4.3.3. Question Mark (High Growth, Low Market Share)
- 4.3.4. Dogs (Low Growth, Low Market Share)
- 4.4. Ansoff Matrix Analysis
- 4.5. Supply Chain Analysis
- 4.6. Regulatory Landscape
- 4.7. Current Market Potential and Opportunity Assessment (TAM–SAM–SOM Framework)
- 4.8. MSR Analyst Note
- 4.1. Porters Five Forces
- 5. Market Analysis, Insights and Forecast 2021-2033
- 5.1. Market Analysis, Insights and Forecast - by Type
- 5.1.1. Graphite Anode
- 5.1.2. Graphite Block (Fine Carbon)
- 5.1.3. Other Types (Graphite Electrode, etc.)
- 5.2. Market Analysis, Insights and Forecast - by Application
- 5.2.1. Metallurgy
- 5.2.2. Parts and Components
- 5.2.3. Batteries
- 5.2.4. Nuclear
- 5.2.5. Other Applications
- 5.3. Market Analysis, Insights and Forecast - by Region
- 5.3.1. Asia Pacific
- 5.3.2. North America
- 5.3.3. Europe
- 5.3.4. South America
- 5.3.5. Middle East and Africa
- 5.1. Market Analysis, Insights and Forecast - by Type
- 6. Global Synthetic Graphite Market Analysis, Insights and Forecast, 2021-2033
- 6.1. Market Analysis, Insights and Forecast - by Type
- 6.1.1. Graphite Anode
- 6.1.2. Graphite Block (Fine Carbon)
- 6.1.3. Other Types (Graphite Electrode, etc.)
- 6.2. Market Analysis, Insights and Forecast - by Application
- 6.2.1. Metallurgy
- 6.2.2. Parts and Components
- 6.2.3. Batteries
- 6.2.4. Nuclear
- 6.2.5. Other Applications
- 6.1. Market Analysis, Insights and Forecast - by Type
- 7. Asia Pacific Synthetic Graphite Market Analysis, Insights and Forecast, 2020-2032
- 7.1. Market Analysis, Insights and Forecast - by Type
- 7.1.1. Graphite Anode
- 7.1.2. Graphite Block (Fine Carbon)
- 7.1.3. Other Types (Graphite Electrode, etc.)
- 7.2. Market Analysis, Insights and Forecast - by Application
- 7.2.1. Metallurgy
- 7.2.2. Parts and Components
- 7.2.3. Batteries
- 7.2.4. Nuclear
- 7.2.5. Other Applications
- 7.1. Market Analysis, Insights and Forecast - by Type
- 8. North America Synthetic Graphite Market Analysis, Insights and Forecast, 2020-2032
- 8.1. Market Analysis, Insights and Forecast - by Type
- 8.1.1. Graphite Anode
- 8.1.2. Graphite Block (Fine Carbon)
- 8.1.3. Other Types (Graphite Electrode, etc.)
- 8.2. Market Analysis, Insights and Forecast - by Application
- 8.2.1. Metallurgy
- 8.2.2. Parts and Components
- 8.2.3. Batteries
- 8.2.4. Nuclear
- 8.2.5. Other Applications
- 8.1. Market Analysis, Insights and Forecast - by Type
- 9. Europe Synthetic Graphite Market Analysis, Insights and Forecast, 2020-2032
- 9.1. Market Analysis, Insights and Forecast - by Type
- 9.1.1. Graphite Anode
- 9.1.2. Graphite Block (Fine Carbon)
- 9.1.3. Other Types (Graphite Electrode, etc.)
- 9.2. Market Analysis, Insights and Forecast - by Application
- 9.2.1. Metallurgy
- 9.2.2. Parts and Components
- 9.2.3. Batteries
- 9.2.4. Nuclear
- 9.2.5. Other Applications
- 9.1. Market Analysis, Insights and Forecast - by Type
- 10. South America Synthetic Graphite Market Analysis, Insights and Forecast, 2020-2032
- 10.1. Market Analysis, Insights and Forecast - by Type
- 10.1.1. Graphite Anode
- 10.1.2. Graphite Block (Fine Carbon)
- 10.1.3. Other Types (Graphite Electrode, etc.)
- 10.2. Market Analysis, Insights and Forecast - by Application
- 10.2.1. Metallurgy
- 10.2.2. Parts and Components
- 10.2.3. Batteries
- 10.2.4. Nuclear
- 10.2.5. Other Applications
- 10.1. Market Analysis, Insights and Forecast - by Type
- 11. Middle East and Africa Synthetic Graphite Market Analysis, Insights and Forecast, 2020-2032
- 11.1. Market Analysis, Insights and Forecast - by Type
- 11.1.1. Graphite Anode
- 11.1.2. Graphite Block (Fine Carbon)
- 11.1.3. Other Types (Graphite Electrode, etc.)
- 11.2. Market Analysis, Insights and Forecast - by Application
- 11.2.1. Metallurgy
- 11.2.2. Parts and Components
- 11.2.3. Batteries
- 11.2.4. Nuclear
- 11.2.5. Other Applications
- 11.1. Market Analysis, Insights and Forecast - by Type
- 12. Competitive Analysis
- 12.1. Company Profiles
- 12.1.1 Mersen Property
- 12.1.1.1. Company Overview
- 12.1.1.2. Products
- 12.1.1.3. Company Financials
- 12.1.1.4. SWOT Analysis
- 12.1.2 Asbury Carbons
- 12.1.2.1. Company Overview
- 12.1.2.2. Products
- 12.1.2.3. Company Financials
- 12.1.2.4. SWOT Analysis
- 12.1.3 Shenzhen Sinuo Industrial Development Co Ltd
- 12.1.3.1. Company Overview
- 12.1.3.2. Products
- 12.1.3.3. Company Financials
- 12.1.3.4. SWOT Analysis
- 12.1.4 Resonac Holdings Corporation (Showa Denko KK)
- 12.1.4.1. Company Overview
- 12.1.4.2. Products
- 12.1.4.3. Company Financials
- 12.1.4.4. SWOT Analysis
- 12.1.5 Shamokin Carbons
- 12.1.5.1. Company Overview
- 12.1.5.2. Products
- 12.1.5.3. Company Financials
- 12.1.5.4. SWOT Analysis
- 12.1.6 Mitsubishi Chemical Corporation
- 12.1.6.1. Company Overview
- 12.1.6.2. Products
- 12.1.6.3. Company Financials
- 12.1.6.4. SWOT Analysis
- 12.1.7 Nippon Carbon Co Ltd
- 12.1.7.1. Company Overview
- 12.1.7.2. Products
- 12.1.7.3. Company Financials
- 12.1.7.4. SWOT Analysis
- 12.1.8 Jiangxi Zichen Technology Co Ltd
- 12.1.8.1. Company Overview
- 12.1.8.2. Products
- 12.1.8.3. Company Financials
- 12.1.8.4. SWOT Analysis
- 12.1.9 Tokai Cobex GmbH
- 12.1.9.1. Company Overview
- 12.1.9.2. Products
- 12.1.9.3. Company Financials
- 12.1.9.4. SWOT Analysis
- 12.1.10 GrafTech International
- 12.1.10.1. Company Overview
- 12.1.10.2. Products
- 12.1.10.3. Company Financials
- 12.1.10.4. SWOT Analysis
- 12.1.11 BTR New Materials Group Co Ltd
- 12.1.11.1. Company Overview
- 12.1.11.2. Products
- 12.1.11.3. Company Financials
- 12.1.11.4. SWOT Analysis
- 12.1.12 Imerys
- 12.1.12.1. Company Overview
- 12.1.12.2. Products
- 12.1.12.3. Company Financials
- 12.1.12.4. SWOT Analysis
- 12.1.13 Shanghai Shanshan Technology Co Ltd
- 12.1.13.1. Company Overview
- 12.1.13.2. Products
- 12.1.13.3. Company Financials
- 12.1.13.4. SWOT Analysis
- 12.1.14 Graphit Kropfmhl GmbH
- 12.1.14.1. Company Overview
- 12.1.14.2. Products
- 12.1.14.3. Company Financials
- 12.1.14.4. SWOT Analysis
- 12.1.15 Graphite India Limited
- 12.1.15.1. Company Overview
- 12.1.15.2. Products
- 12.1.15.3. Company Financials
- 12.1.15.4. SWOT Analysis
- 12.1.16 Lianyungang Jinli Carbon Co Ltd
- 12.1.16.1. Company Overview
- 12.1.16.2. Products
- 12.1.16.3. Company Financials
- 12.1.16.4. SWOT Analysis
- 12.1.1 Mersen Property
- 12.2. Market Entropy
- 12.2.1 Company's Key Areas Served
- 12.2.2 Recent Developments
- 12.3. Company Market Share Analysis 2025
- 12.3.1 Top 5 Companies Market Share Analysis
- 12.3.2 Top 3 Companies Market Share Analysis
- 12.4. List of Potential Customers
- 13. Research Methodology
List of Figures
- Figure 1: Global Synthetic Graphite Market Revenue Breakdown (billion, %) by Region 2025 & 2033
- Figure 2: Global Synthetic Graphite Market Volume Breakdown (K Tons, %) by Region 2025 & 2033
- Figure 3: Asia Pacific Synthetic Graphite Market Revenue (billion), by Type 2025 & 2033
- Figure 4: Asia Pacific Synthetic Graphite Market Volume (K Tons), by Type 2025 & 2033
- Figure 5: Asia Pacific Synthetic Graphite Market Revenue Share (%), by Type 2025 & 2033
- Figure 6: Asia Pacific Synthetic Graphite Market Volume Share (%), by Type 2025 & 2033
- Figure 7: Asia Pacific Synthetic Graphite Market Revenue (billion), by Application 2025 & 2033
- Figure 8: Asia Pacific Synthetic Graphite Market Volume (K Tons), by Application 2025 & 2033
- Figure 9: Asia Pacific Synthetic Graphite Market Revenue Share (%), by Application 2025 & 2033
- Figure 10: Asia Pacific Synthetic Graphite Market Volume Share (%), by Application 2025 & 2033
- Figure 11: Asia Pacific Synthetic Graphite Market Revenue (billion), by Country 2025 & 2033
- Figure 12: Asia Pacific Synthetic Graphite Market Volume (K Tons), by Country 2025 & 2033
- Figure 13: Asia Pacific Synthetic Graphite Market Revenue Share (%), by Country 2025 & 2033
- Figure 14: Asia Pacific Synthetic Graphite Market Volume Share (%), by Country 2025 & 2033
- Figure 15: North America Synthetic Graphite Market Revenue (billion), by Type 2025 & 2033
- Figure 16: North America Synthetic Graphite Market Volume (K Tons), by Type 2025 & 2033
- Figure 17: North America Synthetic Graphite Market Revenue Share (%), by Type 2025 & 2033
- Figure 18: North America Synthetic Graphite Market Volume Share (%), by Type 2025 & 2033
- Figure 19: North America Synthetic Graphite Market Revenue (billion), by Application 2025 & 2033
- Figure 20: North America Synthetic Graphite Market Volume (K Tons), by Application 2025 & 2033
- Figure 21: North America Synthetic Graphite Market Revenue Share (%), by Application 2025 & 2033
- Figure 22: North America Synthetic Graphite Market Volume Share (%), by Application 2025 & 2033
- Figure 23: North America Synthetic Graphite Market Revenue (billion), by Country 2025 & 2033
- Figure 24: North America Synthetic Graphite Market Volume (K Tons), by Country 2025 & 2033
- Figure 25: North America Synthetic Graphite Market Revenue Share (%), by Country 2025 & 2033
- Figure 26: North America Synthetic Graphite Market Volume Share (%), by Country 2025 & 2033
- Figure 27: Europe Synthetic Graphite Market Revenue (billion), by Type 2025 & 2033
- Figure 28: Europe Synthetic Graphite Market Volume (K Tons), by Type 2025 & 2033
- Figure 29: Europe Synthetic Graphite Market Revenue Share (%), by Type 2025 & 2033
- Figure 30: Europe Synthetic Graphite Market Volume Share (%), by Type 2025 & 2033
- Figure 31: Europe Synthetic Graphite Market Revenue (billion), by Application 2025 & 2033
- Figure 32: Europe Synthetic Graphite Market Volume (K Tons), by Application 2025 & 2033
- Figure 33: Europe Synthetic Graphite Market Revenue Share (%), by Application 2025 & 2033
- Figure 34: Europe Synthetic Graphite Market Volume Share (%), by Application 2025 & 2033
- Figure 35: Europe Synthetic Graphite Market Revenue (billion), by Country 2025 & 2033
- Figure 36: Europe Synthetic Graphite Market Volume (K Tons), by Country 2025 & 2033
- Figure 37: Europe Synthetic Graphite Market Revenue Share (%), by Country 2025 & 2033
- Figure 38: Europe Synthetic Graphite Market Volume Share (%), by Country 2025 & 2033
- Figure 39: South America Synthetic Graphite Market Revenue (billion), by Type 2025 & 2033
- Figure 40: South America Synthetic Graphite Market Volume (K Tons), by Type 2025 & 2033
- Figure 41: South America Synthetic Graphite Market Revenue Share (%), by Type 2025 & 2033
- Figure 42: South America Synthetic Graphite Market Volume Share (%), by Type 2025 & 2033
- Figure 43: South America Synthetic Graphite Market Revenue (billion), by Application 2025 & 2033
- Figure 44: South America Synthetic Graphite Market Volume (K Tons), by Application 2025 & 2033
- Figure 45: South America Synthetic Graphite Market Revenue Share (%), by Application 2025 & 2033
- Figure 46: South America Synthetic Graphite Market Volume Share (%), by Application 2025 & 2033
- Figure 47: South America Synthetic Graphite Market Revenue (billion), by Country 2025 & 2033
- Figure 48: South America Synthetic Graphite Market Volume (K Tons), by Country 2025 & 2033
- Figure 49: South America Synthetic Graphite Market Revenue Share (%), by Country 2025 & 2033
- Figure 50: South America Synthetic Graphite Market Volume Share (%), by Country 2025 & 2033
- Figure 51: Middle East and Africa Synthetic Graphite Market Revenue (billion), by Type 2025 & 2033
- Figure 52: Middle East and Africa Synthetic Graphite Market Volume (K Tons), by Type 2025 & 2033
- Figure 53: Middle East and Africa Synthetic Graphite Market Revenue Share (%), by Type 2025 & 2033
- Figure 54: Middle East and Africa Synthetic Graphite Market Volume Share (%), by Type 2025 & 2033
- Figure 55: Middle East and Africa Synthetic Graphite Market Revenue (billion), by Application 2025 & 2033
- Figure 56: Middle East and Africa Synthetic Graphite Market Volume (K Tons), by Application 2025 & 2033
- Figure 57: Middle East and Africa Synthetic Graphite Market Revenue Share (%), by Application 2025 & 2033
- Figure 58: Middle East and Africa Synthetic Graphite Market Volume Share (%), by Application 2025 & 2033
- Figure 59: Middle East and Africa Synthetic Graphite Market Revenue (billion), by Country 2025 & 2033
- Figure 60: Middle East and Africa Synthetic Graphite Market Volume (K Tons), by Country 2025 & 2033
- Figure 61: Middle East and Africa Synthetic Graphite Market Revenue Share (%), by Country 2025 & 2033
- Figure 62: Middle East and Africa Synthetic Graphite Market Volume Share (%), by Country 2025 & 2033
List of Tables
- Table 1: Global Synthetic Graphite Market Revenue billion Forecast, by Type 2020 & 2033
- Table 2: Global Synthetic Graphite Market Volume K Tons Forecast, by Type 2020 & 2033
- Table 3: Global Synthetic Graphite Market Revenue billion Forecast, by Application 2020 & 2033
- Table 4: Global Synthetic Graphite Market Volume K Tons Forecast, by Application 2020 & 2033
- Table 5: Global Synthetic Graphite Market Revenue billion Forecast, by Region 2020 & 2033
- Table 6: Global Synthetic Graphite Market Volume K Tons Forecast, by Region 2020 & 2033
- Table 7: Global Synthetic Graphite Market Revenue billion Forecast, by Type 2020 & 2033
- Table 8: Global Synthetic Graphite Market Volume K Tons Forecast, by Type 2020 & 2033
- Table 9: Global Synthetic Graphite Market Revenue billion Forecast, by Application 2020 & 2033
- Table 10: Global Synthetic Graphite Market Volume K Tons Forecast, by Application 2020 & 2033
- Table 11: Global Synthetic Graphite Market Revenue billion Forecast, by Country 2020 & 2033
- Table 12: Global Synthetic Graphite Market Volume K Tons Forecast, by Country 2020 & 2033
- Table 13: China Synthetic Graphite Market Revenue (billion) Forecast, by Application 2020 & 2033
- Table 14: China Synthetic Graphite Market Volume (K Tons) Forecast, by Application 2020 & 2033
- Table 15: India Synthetic Graphite Market Revenue (billion) Forecast, by Application 2020 & 2033
- Table 16: India Synthetic Graphite Market Volume (K Tons) Forecast, by Application 2020 & 2033
- Table 17: Japan Synthetic Graphite Market Revenue (billion) Forecast, by Application 2020 & 2033
- Table 18: Japan Synthetic Graphite Market Volume (K Tons) Forecast, by Application 2020 & 2033
- Table 19: South Korea Synthetic Graphite Market Revenue (billion) Forecast, by Application 2020 & 2033
- Table 20: South Korea Synthetic Graphite Market Volume (K Tons) Forecast, by Application 2020 & 2033
- Table 21: Asean Countries Synthetic Graphite Market Revenue (billion) Forecast, by Application 2020 & 2033
- Table 22: Asean Countries Synthetic Graphite Market Volume (K Tons) Forecast, by Application 2020 & 2033
- Table 23: Rest of Asia Pacific Synthetic Graphite Market Revenue (billion) Forecast, by Application 2020 & 2033
- Table 24: Rest of Asia Pacific Synthetic Graphite Market Volume (K Tons) Forecast, by Application 2020 & 2033
- Table 25: Global Synthetic Graphite Market Revenue billion Forecast, by Type 2020 & 2033
- Table 26: Global Synthetic Graphite Market Volume K Tons Forecast, by Type 2020 & 2033
- Table 27: Global Synthetic Graphite Market Revenue billion Forecast, by Application 2020 & 2033
- Table 28: Global Synthetic Graphite Market Volume K Tons Forecast, by Application 2020 & 2033
- Table 29: Global Synthetic Graphite Market Revenue billion Forecast, by Country 2020 & 2033
- Table 30: Global Synthetic Graphite Market Volume K Tons Forecast, by Country 2020 & 2033
- Table 31: United States Synthetic Graphite Market Revenue (billion) Forecast, by Application 2020 & 2033
- Table 32: United States Synthetic Graphite Market Volume (K Tons) Forecast, by Application 2020 & 2033
- Table 33: Canada Synthetic Graphite Market Revenue (billion) Forecast, by Application 2020 & 2033
- Table 34: Canada Synthetic Graphite Market Volume (K Tons) Forecast, by Application 2020 & 2033
- Table 35: Mexico Synthetic Graphite Market Revenue (billion) Forecast, by Application 2020 & 2033
- Table 36: Mexico Synthetic Graphite Market Volume (K Tons) Forecast, by Application 2020 & 2033
- Table 37: Global Synthetic Graphite Market Revenue billion Forecast, by Type 2020 & 2033
- Table 38: Global Synthetic Graphite Market Volume K Tons Forecast, by Type 2020 & 2033
- Table 39: Global Synthetic Graphite Market Revenue billion Forecast, by Application 2020 & 2033
- Table 40: Global Synthetic Graphite Market Volume K Tons Forecast, by Application 2020 & 2033
- Table 41: Global Synthetic Graphite Market Revenue billion Forecast, by Country 2020 & 2033
- Table 42: Global Synthetic Graphite Market Volume K Tons Forecast, by Country 2020 & 2033
- Table 43: Germany Synthetic Graphite Market Revenue (billion) Forecast, by Application 2020 & 2033
- Table 44: Germany Synthetic Graphite Market Volume (K Tons) Forecast, by Application 2020 & 2033
- Table 45: United Kingdom Synthetic Graphite Market Revenue (billion) Forecast, by Application 2020 & 2033
- Table 46: United Kingdom Synthetic Graphite Market Volume (K Tons) Forecast, by Application 2020 & 2033
- Table 47: Italy Synthetic Graphite Market Revenue (billion) Forecast, by Application 2020 & 2033
- Table 48: Italy Synthetic Graphite Market Volume (K Tons) Forecast, by Application 2020 & 2033
- Table 49: France Synthetic Graphite Market Revenue (billion) Forecast, by Application 2020 & 2033
- Table 50: France Synthetic Graphite Market Volume (K Tons) Forecast, by Application 2020 & 2033
- Table 51: Russia Synthetic Graphite Market Revenue (billion) Forecast, by Application 2020 & 2033
- Table 52: Russia Synthetic Graphite Market Volume (K Tons) Forecast, by Application 2020 & 2033
- Table 53: Rest of Europe Synthetic Graphite Market Revenue (billion) Forecast, by Application 2020 & 2033
- Table 54: Rest of Europe Synthetic Graphite Market Volume (K Tons) Forecast, by Application 2020 & 2033
- Table 55: Global Synthetic Graphite Market Revenue billion Forecast, by Type 2020 & 2033
- Table 56: Global Synthetic Graphite Market Volume K Tons Forecast, by Type 2020 & 2033
- Table 57: Global Synthetic Graphite Market Revenue billion Forecast, by Application 2020 & 2033
- Table 58: Global Synthetic Graphite Market Volume K Tons Forecast, by Application 2020 & 2033
- Table 59: Global Synthetic Graphite Market Revenue billion Forecast, by Country 2020 & 2033
- Table 60: Global Synthetic Graphite Market Volume K Tons Forecast, by Country 2020 & 2033
- Table 61: Brazil Synthetic Graphite Market Revenue (billion) Forecast, by Application 2020 & 2033
- Table 62: Brazil Synthetic Graphite Market Volume (K Tons) Forecast, by Application 2020 & 2033
- Table 63: Argentina Synthetic Graphite Market Revenue (billion) Forecast, by Application 2020 & 2033
- Table 64: Argentina Synthetic Graphite Market Volume (K Tons) Forecast, by Application 2020 & 2033
- Table 65: Rest of South America Synthetic Graphite Market Revenue (billion) Forecast, by Application 2020 & 2033
- Table 66: Rest of South America Synthetic Graphite Market Volume (K Tons) Forecast, by Application 2020 & 2033
- Table 67: Global Synthetic Graphite Market Revenue billion Forecast, by Type 2020 & 2033
- Table 68: Global Synthetic Graphite Market Volume K Tons Forecast, by Type 2020 & 2033
- Table 69: Global Synthetic Graphite Market Revenue billion Forecast, by Application 2020 & 2033
- Table 70: Global Synthetic Graphite Market Volume K Tons Forecast, by Application 2020 & 2033
- Table 71: Global Synthetic Graphite Market Revenue billion Forecast, by Country 2020 & 2033
- Table 72: Global Synthetic Graphite Market Volume K Tons Forecast, by Country 2020 & 2033
- Table 73: Saudi Arabia Synthetic Graphite Market Revenue (billion) Forecast, by Application 2020 & 2033
- Table 74: Saudi Arabia Synthetic Graphite Market Volume (K Tons) Forecast, by Application 2020 & 2033
- Table 75: South Africa Synthetic Graphite Market Revenue (billion) Forecast, by Application 2020 & 2033
- Table 76: South Africa Synthetic Graphite Market Volume (K Tons) Forecast, by Application 2020 & 2033
- Table 77: Rest of Middle East and Africa Synthetic Graphite Market Revenue (billion) Forecast, by Application 2020 & 2033
- Table 78: Rest of Middle East and Africa Synthetic Graphite Market Volume (K Tons) Forecast, by Application 2020 & 2033
Frequently Asked Questions
1. What is the projected Compound Annual Growth Rate (CAGR) of the Synthetic Graphite Market?
The projected CAGR is approximately 15.1%.
2. Which companies are prominent players in the Synthetic Graphite Market?
Key companies in the market include Mersen Property, Asbury Carbons, Shenzhen Sinuo Industrial Development Co Ltd, Resonac Holdings Corporation (Showa Denko KK), Shamokin Carbons, Mitsubishi Chemical Corporation, Nippon Carbon Co Ltd, Jiangxi Zichen Technology Co Ltd, Tokai Cobex GmbH, GrafTech International, BTR New Materials Group Co Ltd, Imerys, Shanghai Shanshan Technology Co Ltd, Graphit Kropfmhl GmbH, Graphite India Limited, Lianyungang Jinli Carbon Co Ltd.
3. What are the main segments of the Synthetic Graphite Market?
The market segments include Type, Application.
4. Can you provide details about the market size?
The market size is estimated to be USD 15.67 billion as of 2022.
5. What are some drivers contributing to market growth?
Increasing Demand for Electric Vehicles; Growing Utilization of Electric ARC Furnace Process for Steel Production.
6. What are the notable trends driving market growth?
Metallurgy Segment to Drive the Market.
7. Are there any restraints impacting market growth?
Stringent Environmental Regulations; Decreasing Production of Steel.
8. Can you provide examples of recent developments in the market?
October 2022: Imerys Imerys Graphite & Carbon Company announced the launch of a landmark lithium exploitation project ('the EMILI Project'). It may significantly reduce the need to import lithium and aid in producing nearly 700,000 electric vehicle batteries annually.
9. What pricing options are available for accessing the report?
Pricing options include single-user, multi-user, and enterprise licenses priced at USD 4750, USD 5250, and USD 8750 respectively.
10. Is the market size provided in terms of value or volume?
The market size is provided in terms of value, measured in billion and volume, measured in K Tons.
11. Are there any specific market keywords associated with the report?
Yes, the market keyword associated with the report is "Synthetic Graphite Market," which aids in identifying and referencing the specific market segment covered.
12. How do I determine which pricing option suits my needs best?
The pricing options vary based on user requirements and access needs. Individual users may opt for single-user licenses, while businesses requiring broader access may choose multi-user or enterprise licenses for cost-effective access to the report.
13. Are there any additional resources or data provided in the Synthetic Graphite Market report?
While the report offers comprehensive insights, it's advisable to review the specific contents or supplementary materials provided to ascertain if additional resources or data are available.
14. How can I stay updated on further developments or reports in the Synthetic Graphite Market?
To stay informed about further developments, trends, and reports in the Synthetic Graphite Market, consider subscribing to industry newsletters, following relevant companies and organizations, or regularly checking reputable industry news sources and publications.
Methodology
Step 1 - Identification of Relevant Samples Size from Population Database


Step 2 - Approaches for Defining Global Market Size (Value, Volume* & Price*)

Note*: In applicable scenarios
Step 3 - Data Sources
Primary Research
- Web Analytics
- Survey Reports
- Research Institute
- Latest Research Reports
- Opinion Leaders
Secondary Research
- Annual Reports
- White Paper
- Latest Press Release
- Industry Association
- Paid Database
- Investor Presentations

Step 4 - Data Triangulation
Involves using different sources of information in order to increase the validity of a study
These sources are likely to be stakeholders in a program - participants, other researchers, program staff, other community members, and so on.
Then we put all data in single framework & apply various statistical tools to find out the dynamic on the market.
During the analysis stage, feedback from the stakeholder groups would be compared to determine areas of agreement as well as areas of divergence